City, University of London Institutional Repository
Citation
:
Yamaguchi, T., Brain, M. ORCID: 0000-0003-4216-7151, Ryder, C., Imai, Y. and
Kawamura, Y. (2019). Application of Abstract Interpretation to the Automotive Electronic
Control System. Lecture Notes in Computer Science (VMCAI 2019: Verification, Model
Checking, and Abstract Interpretation), 11388, pp. 425-445. doi:
10.1007/978-3-030-11245-5_20
This is the accepted version of the paper.
This version of the publication may differ from the final published
version.
Permanent repository link:
http://openaccess.city.ac.uk/id/eprint/21922/
Link to published version
:
http://dx.doi.org/10.1007/978-3-030-11245-5_20
Copyright and reuse:
City Research Online aims to make research
outputs of City, University of London available to a wider audience.
Copyright and Moral Rights remain with the author(s) and/or copyright
holders. URLs from City Research Online may be freely distributed and
linked to.
City Research Online:
http://openaccess.city.ac.uk/
[email protected]
Application of Abstract Interpretation to the
Automotive Electronic Control System
Tomoya Yamaguchi1, Martin Brain2, Chris Ryder3, Yosikazu Imai4, and Yoshiumi Kawamura5
1
Toyota Motor Corporation, 1200, Misuku, Susono, Shizuoka, Japan,
University of Oxford, Wolfson Building, Parks Road, Oxford, United Kingdom,
Diffblue, 10 St. Ebbs Street, Oxford, United Kingdom,
Nu-soft, 3-24-2 Shinyokohama, kouhoku, Yokohama, Kanagawa, Japan,
5 Toyota Motor Corporation, 1200, Misuku, Susono, Shizuoka, Japan,
yoshiumi [email protected]
Abstract. The verification and validation of industrial automotive sys-tems is increasingly challenging as they become larger and more complex. Recent automotive Electric Control Units (ECUs) have approximately one half to one million of lines of code, and a modern automobile can contain hundreds of controllers. Significant work-hours are needed to un-derstand and manage systems of this level of complexity. One particular challenge is understanding the changes to the software across develop-ment phases and revisions. To this end, we present a code dependency analysis tool that enhances designer understanding. It combines abstract interpretation and graph based data analysis to generate visualized de-pendency graphs on demand to support designer’s understanding of the code. We demonstrate its value by presenting dependency graph visuals for an industrial application, and report results showing significant re-duction of work-hours and enhancement of the ability to understand the software.
1
Introduction
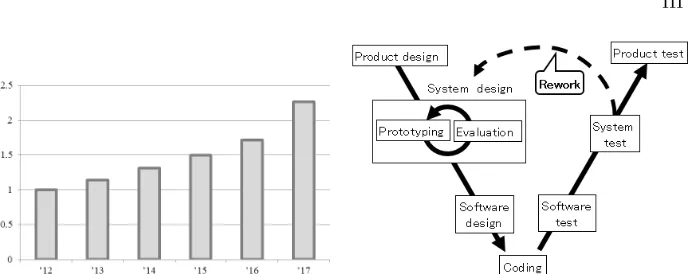
In recent years, functional requirements for automotive control systems have be-come far more sophisticated. This necessitated the development of more complex and larger scale control software, which lead to a significant increase in work-hours. Fig 1 shows the amount of work-hours for control software development based on our project management data, which reveals that work hours almost doubled from 2012 to 2017. Based on this trend, the work-hours are expected to increase considerably in the near future.
II
smaller subsystems, which we call unit-systems. The designer’s interests are to grasp the vehicle system architecture, the unit-system architecture, and the im-pact of their revisions or extensions at the program level. Therefore, accurate and comprehensive visualization of abstractions of the software will help to increase the designer’s understanding and will mitigate the increase in work-hours.
In this paper, we present a tool that provides various view graphs that can support the designer’s understanding of the system by using a static analysis technology. Characteristics of our tool include the following: (1) ability to con-trol the scalability and preciseness based on the designer’s interest, and (2) a guarantee of soundness (there are no missed dependencies). Traditional code analysis does not guarantee absolute precision. On the other hand, legacy static analysis guarantees precision but is not scalable. Thus we developed an abstract interpretation technology, which is based on static analysis methods, to our tool. In addition, a graph-based data base is exploited to manage enormous depen-dency for large scale code.
Specific contributions of the paper are:
– Explaining background on automotive control system software and the corre-sponding industrial challenges that the support the designer’s understanding to maintains our product quality under situation of increasing work-hours trend. (Section 2)
– Algorithmic and implementation innovations needed for scalable and precise abstract interpretation (Section 3)
– An overview of the C Analysis Tool (CAT) developed (Section 4).
– Results of the application of our tool to the actual control system code ( Section 5).
2
The Challenges of Modern Automotive Software
2.1 Architecture of Automotive Software
Figure 3 shows the software architecture of a modern vehicle. The vehicle system consists of several unit-systems, like the engine and the transmission, which have their own ECU; each ECU communicates via a CAN network. The majority of ECUs are implemented in C. The largest unit-system in the vehicle is the engine ECU, and we use it as a recurring example. The engine ECU has multiple features, such as ignition, injection, and variable valve control. Each feature contains program modules that are divided into functional units, each of which are collections of several functions. The functions that compose the modules are allocated to tasks for the Operating System (OS), which manages time driven and event driven tasks.
III
Fig. 1. Magnification of work-hour based on 2012.
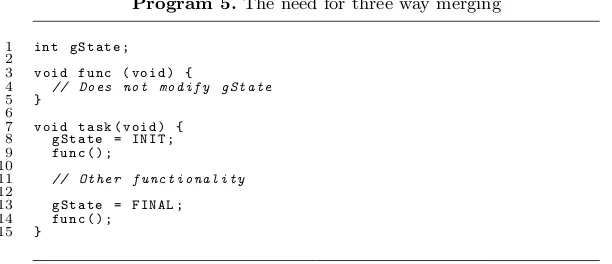
Fig. 2.Design development of automotive software development.
Fig. 3.Architecture of automotive control system.
sensor data, or ROM (Read Only Memory)/RAM (Random Access Memory) access. About five hundred such pointers are used in the lower layer.
2.2 Development Process
Figure 2 shows the automotive software development process for the Electronic Control Unit (ECU). Our process uses a version of the typical V-model design process. Since complex physical phenomena, such as the vehicle dynamics, are the target of the control algorithms, prototypes of the physical components are used to develop system software. The prototype development tends to be incre-mental, focused on components, while re-using, and extending legacy systems. The system design involves iterative development of the prototype, along with evaluation, while validating operation of the control system in actual usage en-vironments. Due to the use of iterative prototypes and corresponding control algorithms, a spiral-up type process is incorporated into the system design pro-cess on the left side of the V-model.
[image:4.612.140.479.274.410.2]IV
on actual vehicles, engine test beds, HILS (Hardware-in-the-Loop-Simulation), and SILS (Simulation-in-the-Loop-Simulation). Those tests are more intense (de-manding, in terms of system performance) and exhaustive than the evaluation at the system design phase and are employed to achieve and maintain quality up to the final product test phase.
A main source of inefficiency in our process is the rework involved to return to an earlier phase of the development process, in the left side of V-model, from a test process, in the right side of V-model. The most costly rework occurs when returning to the system design phase from the system test phase, due to the many development and testing steps that have already been performed to reach the testing phase. Thus making well defined system designs is important to reduce the amount of rework. In that sense, misunderstanding the system design is one of the significant causes of the rework. Accordingly, a good review process, founded on a firm understanding of the implementation, is required to help limit the amount of rework.
The designer will benefit from the following, either for a new development or for extending an existing system design.
1. Understanding the software architecture: It is important to decide which module or function should be revised beforehand. In that sense, the developer needs to understand the entirety of the program architecture on every level, such as the function, the module, the sub-system, and the system levels. 2. Impact analysis of the revised variables or the calibration parameters: The
designer is interested in what kind of influence their own design revision has to the system. The impact analysis is necessary in the Design Review Based on Failure Mode (DRBFM) [1] to prevent the revision leading to unexpected behaviors when revising variables or re-calibration of parameters.
The review process is basically done in manual or semi-manual manner, such as reading a natural language of the specification or using thegrepcommand in for C code. When considering the module or function level graph, this process can be sufficient, since the scale is small. However, if the system level graph is considered, the manual process becomes a development bottleneck, because the system scale is large, and the corresponding system graph is created manually.
2.3 Technical Issue and Approach
In order to automate the software architecture analysis and impact analysis, we present a method based on static analysis. The required functionality and challenges are as follows.
V
Program 1.Code example for struc-t/union.
1 s t r u c t st {
2 int m1 ;
3 int m2 ;
4 };
5
6 e x t e r n int g _ i n ;
7 s t r u c t st g _ s t ;
8 int g_out1 , g_out2 , g _ o u t 3 ;
9
10 v o i d m a i n ( v o i d ) {
11 if ( g _ i n == 1)
12 g _ s t . m1 ++;
13
14 if ( g _ i n == 2)
15 g _ s t . m2 ++;
16
17 g _ o u t 1 = g _ s t . m1 ;
18 g _ o u t 2 = g _ s t . m2 ;
19 g _ o u t 3 = g _ s t . m1 + g _ s t . m2 ;
20 }
Program 2.Code example for closed loop.
1 e x t e r n int g _ i n 1 ;
2 e x t e r n int g _ i n 2 ;
3 int g _ x 1 ;
4 int g _ x 2 ;
5
6 v o i d m a i n ( v o i d ) {
7 if ( g _ i n 1 )
8 g _ x 2 = 0;
9
10 g _ x 1 = g _ x 2 ;
11
12 if ( g _ i n 2 )
13 g _ x 2 = g _ x 1 ;
14 }
reads/writes; program (Control and Data) dependencies are needed to make a more helpful graph [2]. Particular challenges are;
1. The analysis must scale to a half million lines of code and handle several thousand global variable.
2. At some levels of detail we require precise handling of nested struct and union variables. These often contain flags indicates important conditions, like whether the engine is idling or whether the engine is in a fuel-cut mode. Program 1 shows an example. It has struct ston L1 and the members are accessed inmainfunction several times.
3. It is necessary to consider the software as a closed-loop system. In that case, the entry function is called repeatedly in the embedded controller; therefore, it is necessary to consider the previous status of global vari-ables. Program 2 shows an example. Whenmainon L6 is called repeat-edly for the closed-loop system, 2nd call of L10 depends 1st call of L13 in specific case. We call this capability the periodic option, which is an option for our data dependency analysis.
VI
Program 3.Code example for pointer.
1 # d e f i n e A R R A Y _ S I Z E 4
2 c o n s t int c A a r r a y [ A R R A Y _ S I Z E ] = { 10 , 20 , 30 , 4 0 } ;
3 int g A r r a y 1 [ A R R A Y _ S I Z E ];
4 int g A r r a y 2 [ A R R A Y _ S I Z E ];
5
6 v o i d m a i n () {
7 c o n s t int * p0 = c A a r r a y ;
8 int * p1 = g A r r a y 1 ;
9
10 for ( int i =0; i < A R R A Y _ S I Z E ; i ++) {
11 * p1 = c A a r r a y [ i ];
12 g A r r a y 2 [ i ] = * p0 ;
13 p0 ++;
14 p1 ++;
15 }
16 }
Program 4.Code example for function pointer.
1 s t r u c t st {
2 int (* req ) ( char , c h a r *) ;
3 };
4
5 int f1 ( char , c h a r *) ;
6 int f2 ( char , c h a r *) ;
7 c o n s t s t r u c t st f p t b l 1 [ ] = {
8 { f1 } ,
9 { f2 } ,
10 };
11
12 int g1 ( char , v o i d *) ;
13 int g2 ( char , v o i d *) ;
14 int (* c o n s t f p t b l 2 []) ( char , v o i d *) = {
15 g1 ,
16 g2 ,
17 };
18
19 v o i d f u n c ( int id , int len , c h a r * buf ) {
20 c o n s t s t r u c t st * p = & f p t b l 1 [ id ];
21 p - > req ( len , buf ) ;
22 }
is considered in an initial phase of development, all pointers should be re-solved to clarify all dependency. In this case, the work hours are estimated at about 125 h (=15 min * 500 pointers). This is an unreasonable amount of work-hours to spend resolving pointers.
The embedded ECU does not have un-resolvable pointers because it is a safety critical system and does not use dynamic memory allocation. Even considering pointers in loop statements, there are no unbounded loops be-cause the number of loops are based on constant values, like the number of banks, cylinders, and the look-up table size.
VII
revised variables or the calibration parameters to understand the influence of their revisions. The challenging aspect is to handle enormous dependency from a half million lines of code and on-demand access for forward and backward analysis.
As many of these challenges require understanding parts of the semantics of the program, purely syntactic approaches to the dependency graph are not sufficient. To this end, we use abstract interpretation, which can produce scal-able and precise results and further guarantee soundness regarding pointer and dependency analysis. To support the enormous information management on the slicing requirements, we use a non-relational database. In the next section, we describe the key technique: abstract interpretation.
3
Abstract Interpretation
Abstract Interpretation [4] is a mathematical framework for designing, develop-ing and understanddevelop-ing static analysis techniques [5]. It provides general results, based on order theory, that guarantee soundness and termination of an analysis given a few basic properties of the data structures and functions used. These allow the development of a new analysis to be reduced to developing one data structure and two (optionally three) functions:
Domain A domain is a mathematical object that represents a set of possible program states. The conventional approach to implementing abstract inter-pretation analyses to create a data-structure for the domain. Commonly this is anon-relationaldomain, a map from variable to an abstract representation of their possible values (for example intervals, or sets of dependencies).
Transform A function that takes the domain representing the state before an instruction and generates the domain representing the possible program states after. This is the abstract version of executing one step of the pro-gram. The transform function covering all possibilities (in this case, tracking all dependencies) is one of the key criteria for a sound analysis. Obviously the details of transformation will depend on the domain, for example, if the domain uses intervals then the transform function will perform interval arithmetic.
Merge A function that takes two domains and combines them into one that includes things represented by either (but may contain more). In the case of intervals, this would be merging the two intervals. Merge is the over-approximate version of a union and allows control-flow paths to be merged, a key criteria for termination.
VIII
3.1 Variable-Sensitivity Domain
As this project needs to compute dependencies for each variable individually and does not need to track the relationships between them, it is sufficient to use a non-relational domain. This means that we can represent the state of a program a given location using one map which stores an object for each variable. Doing so allows us a uniform and simple way of handling one of the requirements – a variable level of sensitivity in the analysis depending on whether it is being analyses at feature, module or task function level.
By implementing a common object interface, we can use dynamic dispatch to control the objects, and thus the precision, used to track arrays, pointers, structs, unions and combinations of them. When the program is analysed at the large scale, we can smash arrays, tracking one dependency set per arrays, and switch seamlessly to per-element dependencies at smaller scales. Similarly, we can switch from just dependencies to tracking constant value or intervals for each variable as well to increase precision for more detailed analyses.
Although this approach is less general than conventional approaches using separate value, array and pointer analyses and reduced products or open combi-nations [14], it scales better and handles large, complex, global data-structures (for example, pointers to arrays that are members of structs) in a clean and simple manner. It also simplifies various implementation and algorithmic im-provements discussed below.
3.2 Copy-on-Write Data Structures
As we need to generate dependencies for every location in the program and keep these in memory to handle periodic analysis as described above, memory is a significant concern. If we are to store 1,000,000 domains (one per line of code), each tracking up to 10,000 variables (not counting per-element analysis of arrays), then every byte required by a dependency set will need 10 GB of RAM. Here the “one big map” approach of the variable sensitivity domain is of great use. Although we have to store domains for every program location, the majority of them are largely similar to the domains at preceding locations. By using a custom copy-on-write map data-structure, we only have to store the difference
between two domains, which makes the memory consumption tractable. The authors believe a similar approach is implemented in Astr´ee [15] although the details are not public. This also gives a fast way of iterating across the differences between two domains.
3.3 Three-Way Merge
IX
Program 5.The need for three way merging
1 int g S t a t e ;
2
3 v o i d f u n c ( v o i d ) {
4 // D o e s n o t m o d i f y g S t a t e
5 }
6
7 v o i d t a s k ( v o i d ) {
8 g S t a t e = I N I T ;
9 f u n c () ;
10
11 // O t h e r f u n c t i o n a l i t y
12
13 g S t a t e = F I N A L ;
14 f u n c () ;
15 }
Consider the program in Program 5. The first call tofuncwill correctly track the dependencies and the constant value of gState. The second call to func will merge in its value of gState which causes a problem on function return : even though the function does not alter gState its value and dependencies will be set to the merge ofall possible calling locations. In the case of low-level utility functions this can cause very significant loss of precision, particularly when unwinding loops.
To avoid this problem without the cost of performing full context-sensitive analysis, we use the dependencies and modification information implicitly stored in the copy-on-write data structures. On function return, rather than just merg-ing the state at the end of the callee into the caller, we identify each of the variables (array elements, struct fields, etc. depending on the sensitivity) that has changed between the start and end of the callee and merge only those into the caller state, resulting in a three-way merge.
[image:10.612.148.454.134.266.2]4
C Analysis Tool
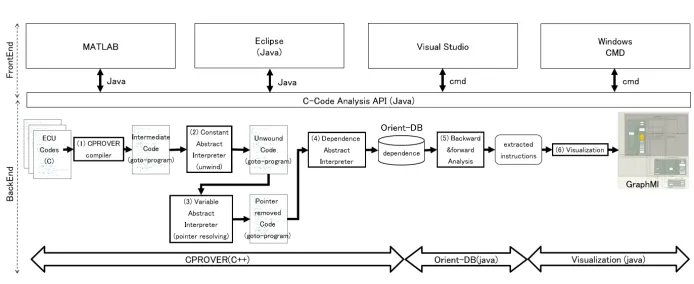
Figure 4 shows the C Analysis Tool (CAT) architecture. The CAT basically con-sists of three components. The CPROVER [7] component compiles ECU code and executes the abstract interpretation and finally outputs the instruction level of dependency. The Orient-DB [8] component is a non-relational database and deals with the enormous dependency information and analyzes forward and back-ward analysis based on the dependency on demand to implement the slicing. The visualization component converts instruction-level of dependency to a more user-friendly level. The visualization back-ends can be accessed via a Java-API, and the user can operate it from their own environment or an Integrated De-velopment Environment (IDE) like MATLAB R, EclispeR, Visual Studio R,
Windows RCMD and so on. Those components are explained in detail in
X
Fig. 4.C Analysis Tool architecture.
4.1 CPROVER
CPROVER [7] is an open-source C++ framework for building C, C++ and Java analysis and verification tools. It provides components for compilation, program transformation and analysis, abstract interpretation, symbolic execution and SMT solving. For instance, C Bounded Model Checker (CBMC) [9] is a well-known bounded model checker and is implemented using CPROVER.
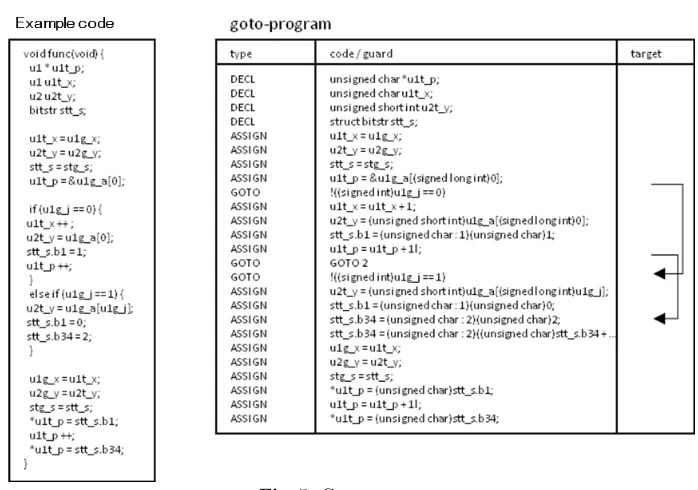
goto-cc CPROVER has a compilergoto-ccwhich supportsgcc[10] equivalent compiler options. This means goto-cc can compile C-code by just changing the command gcc to goto-cc in a make-file, which has a high advantage in industrial application. Thegoto-ccproduces a “goto-program”, which is a kind of intermediate representation (see Fig. 5). In our CAT tool, thegoto-ccis used in CPROVER compiler((1) in Fig. 4).
goto-analyzer is the abstract interpreter from CPROVER. It operates on goto-programs and thus is language independent. Thegoto-analyzersupports three types of abstract domain, which are the constant domain, the variable sensitivity domain, and the dependency domain.
Constant Domain ((2) in Fig. 4): Finds unwinding-bounds for the loops, then it unwinds the original code. The command isgoto-analyzer --constant
Variable Domain ((3) in Fig. 4): Simplifies and removes the data and function pointers with array and struct/union awareness. The command isgoto-analyzer --variable --structs --arrays
XI
Fig. 5.Goto-program.
and considers the status of the previous control step as necessary. The com-mand isgoto-analyzer --dependence-graph-vs
--structs --arrays --periodic-task
The CAT exploits the constant and variable sensitivity domains to handle loops and pointers and the dependency abstract interpreter for extracting pro-gram dependency. Finally, that outputs the dependency at the instruction-level to Orient-DB.
4.2 Orient-DB
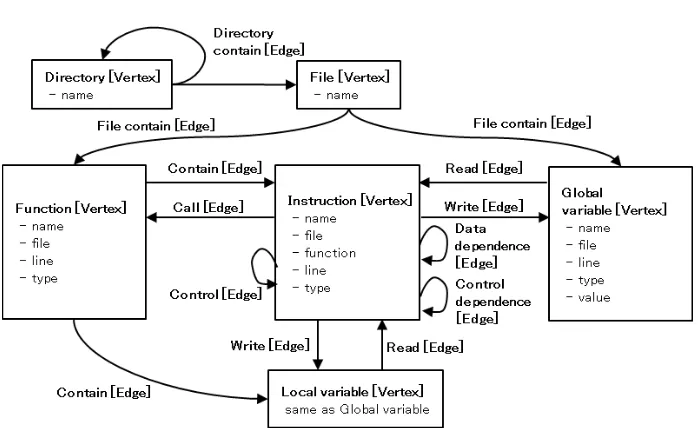
The Orient-DB [8][11] handles the dependency information that comes from a half million lines of code and CPROVER’s abstract interpreter (goto-analyzer). The sum of the control and data dependencies is approximately relations 445,000 from a half million lines of code. In general, applying a database is reasonable to handle such an enormous amount of information. One feature is that we ap-ply the oriented graph based database “Orient-DB”. This is because the code dependency is considered as a directed graph. Each instruction can be consid-ered a “vertex”, and each dependency can be considconsid-ered an “edge”. From that perspective, the impact analysis can be implemented as a backward and forward analysis from any slicing criterion.
XII
Fig. 6.Orient-DB data architecture.
Those are based on the C-code intermediate format from the goto-program. In addition, the file directory and the file are included to support the directory and file-level merging in the visualization layer. The edges represent the call, the control that expresses the instruction ordering, variable read, and write as in a typical program data dictionary. In addition to that, the data and control dependency that come from the dependency abstract interpreter are registered. The Orient-DB supports the edge based backward and forward analysis. CAT exploits that forBackward and Forward Analysis((5) in Fig. 4).
4.3 Visualization
The visualization component relatesVisualization((6) in Fig. 4). The Orient-DB can extract the vertices that correspond to instructions from the goto-program with any Orient-DB commands. It is easy to imagine that such an instruction-level graph may be difficult to understand. In practice, it is more detail than required to understand the software architecture for most cases.
XIII
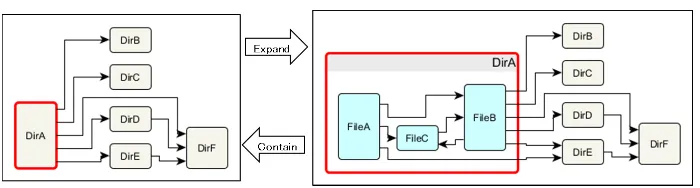
Fig. 7.Example of visualization process.
graph format is GraphMl [12]. yEd Graph Editor [13] is used as a viewer, and the Graph layout is used independently from the CAT to show the result. This component is also implemented in Java.
5
Experiment of CAT with Automotive Unit-System
We evaluate the CAT’s unit-system dependency graph generation and the impact analysis with actual code. We choose the engine ECU that is the largest scale in the vehicle system and has a half million of LoC. All experiments were run on a workstation computer with IntelR XeonR CPU E5-2690, 2.9GHz, 8 cores, 2 processor, and 256GB RAM on OS Ubunutu 16.04.
5.1 Result of Analysis for small examples
This section explains the result of CPROVERgoto-analyzerin Sec.4.1.
Dependency Analysis The result of dependency analysis goto-analyzer --dependence-graph-vs of Program 1 is shown in Fig. 8, which indicates the data dependency has offset of struct member.
The result of dependency analysis of Program 2 is also shown in Fig. 9, which indicates the control, data, and periodic dependency (shown as “later” on edge from L13 to L10 node) are extracted correctly. Above results indicate the requirements those are mentioned in Sec. 2.3 are satisfied. All those dependencies are exported in JSON format and stored to Orient-DB.
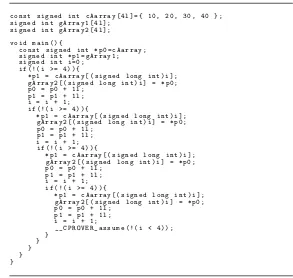
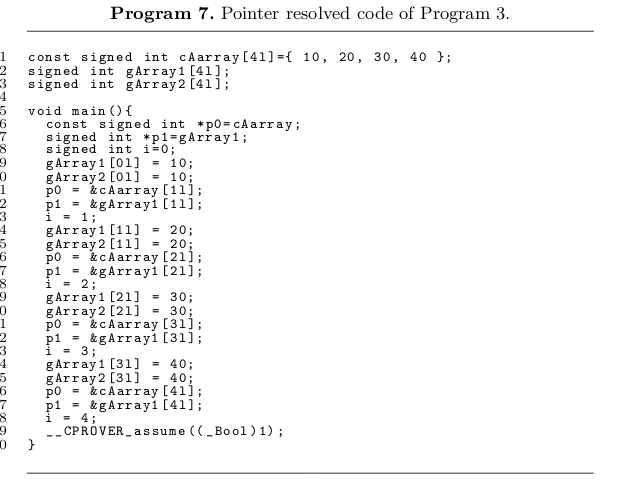
Pointer Resolution The first step of pointer resolution using CAT is unwind-ing the loops. Program 6 shows the result of loop resolvunwind-ing goto-analyzer --constantof program 3 in Sec. 2.3 by using the constant abstract interpreter. Theforloop on L10 in Program 3 is unwound and converted toifstatements. Program 7 shows the result of pointer resolving goto-analyzer --variable --structs --arrays of Program 6. This result shows the abstract interpreter can resolve complex pointer accesses that include loop and array access.
XIV
Fig. 8.Dependence result of Program 1
Fig. 9. Dependence result of Pro-gram 2
Program 6.Unwound code of Program 3.
1 c o n s t s i g n e d int c A a r r a y [4 l ]={ 10 , 20 , 30 , 40 };
2 s i g n e d int g A r r a y 1 [4 l ];
3 s i g n e d int g A r r a y 2 [4 l ];
4
5 v o i d m a i n () {
6 c o n s t s i g n e d int * p0 = c A a r r a y ;
7 s i g n e d int * p1 = g A r r a y 1 ;
8 s i g n e d int i =0;
9 if (!( i >= 4) ) {
10 * p1 = c A a r r a y [( s i g n e d l o n g int ) i ];
11 g A r r a y 2 [( s i g n e d l o n g int ) i ] = * p0 ;
12 p0 = p0 + 1 l ;
13 p1 = p1 + 1 l ;
14 i = i + 1;
15 if (!( i >= 4) ) {
16 * p1 = c A a r r a y [( s i g n e d l o n g int ) i ];
17 g A r r a y 2 [( s i g n e d l o n g int ) i ] = * p0 ;
18 p0 = p0 + 1 l ;
19 p1 = p1 + 1 l ;
20 i = i + 1;
21 if (!( i >= 4) ) {
22 * p1 = c A a r r a y [( s i g n e d l o n g int ) i ];
23 g A r r a y 2 [( s i g n e d l o n g int ) i ] = * p0 ;
24 p0 = p0 + 1 l ;
25 p1 = p1 + 1 l ;
26 i = i + 1;
27 if (!( i >= 4) ) {
28 * p1 = c A a r r a y [( s i g n e d l o n g int ) i ];
29 g A r r a y 2 [( s i g n e d l o n g int ) i ] = * p0 ;
30 p0 = p0 + 1 l ;
31 p1 = p1 + 1 l ;
32 i = i + 1;
33 _ _ C P R O V E R _ a s s u m e (!( i < 4) ) ;
34 }
35 }
36 }
37 }
38 }
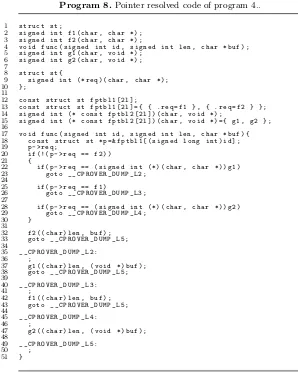
methodgoto-instrument --remove-function-pointers. The function pointer access p->req(len, buf) on L21 in Program 4 should be function f1 or f2. However, this heuristic method solves as all possible function;f1,f2,g1, org2
[image:15.612.155.448.313.591.2]XV
Program 7.Pointer resolved code of Program 3.
1 c o n s t s i g n e d int c A a r r a y [4 l ]={ 10 , 20 , 30 , 40 };
2 s i g n e d int g A r r a y 1 [4 l ];
3 s i g n e d int g A r r a y 2 [4 l ];
4
5 v o i d m a i n () {
6 c o n s t s i g n e d int * p0 = c A a r r a y ;
7 s i g n e d int * p1 = g A r r a y 1 ;
8 s i g n e d int i =0;
9 g A r r a y 1 [0 l ] = 10;
10 g A r r a y 2 [0 l ] = 10;
11 p0 = & c A a r r a y [1 l ];
12 p1 = & g A r r a y 1 [1 l ];
13 i = 1;
14 g A r r a y 1 [1 l ] = 20;
15 g A r r a y 2 [1 l ] = 20;
16 p0 = & c A a r r a y [2 l ];
17 p1 = & g A r r a y 1 [2 l ];
18 i = 2;
19 g A r r a y 1 [2 l ] = 30;
20 g A r r a y 2 [2 l ] = 30;
21 p0 = & c A a r r a y [3 l ];
22 p1 = & g A r r a y 1 [3 l ];
23 i = 3;
24 g A r r a y 1 [3 l ] = 40;
25 g A r r a y 2 [3 l ] = 40;
26 p0 = & c A a r r a y [4 l ];
27 p1 = & g A r r a y 1 [4 l ];
28 i = 4;
29 _ _ C P R O V E R _ a s s u m e (( _ B o o l ) 1) ;
30 }
[image:16.612.151.464.129.369.2]5.2 Visualization for Automotive Unit-System
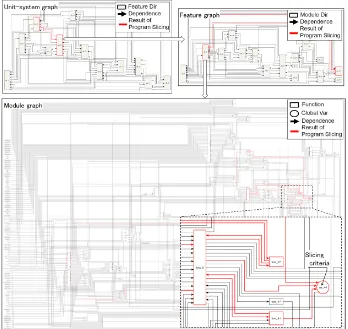
Figure 10 shows the engine unit-system dependency graph, where the red-line shows the extracted result of program slicing. The slicing criteria is an important variable for the engine control software and for the back-forward control and data-dependency analysis. The top segment of this figure shows the feature layer. The middle segment shows the module graph. The bottom segment shows the function and global variable graph. This figure shows the unit-system level, the feature level, and the module level hierarchically and with the designer preferred abstraction. The result shows that the program slicing gives the information the designer should focus on.
The time and memory consumption was evaluated while generating Fig. 10. First, the CAT compiling CPROVER compiler ((1) in Fig. 4) takes about 24 minutes. The abstract interpreters, the constant abstract interpretation ((2) in Fig. 4), the variable abstract interpreter ((3) in Fig. 4), and Dependency Abstract Interpreter ((4) in Fig. 4), which are for the dependency analysis, take about 7 hours and consumes a maximum of 198 GB memory. Forward and backward analysis (((5) in Fig. 4)) and Visualization ((6) in Fig. 4) take up to a few minutes.
XVI
Program 8.Pointer resolved code of program 4..
1 s t r u c t st ;
2 s i g n e d int f1 ( char , c h a r *) ;
3 s i g n e d int f2 ( char , c h a r *) ;
4 v o i d f u n c ( s i g n e d int id , s i g n e d int len , c h a r * buf ) ;
5 s i g n e d int g1 ( char , v o i d *) ;
6 s i g n e d int g2 ( char , v o i d *) ;
7
8 s t r u c t st {
9 s i g n e d int (* req ) ( char , c h a r *) ;
10 };
11
12 c o n s t s t r u c t st f p t b l 1 [2 l ];
13 c o n s t s t r u c t st f p t b l 1 [2 l ]={ { . req = f1 } , { . req = f2 } };
14 s i g n e d int (* c o n s t f p t b l 2 [2 l ]) ( char , v o i d *) ;
15 s i g n e d int (* c o n s t f p t b l 2 [2 l ]) ( char , v o i d *) ={ g1 , g2 };
16
17 v o i d f u n c ( s i g n e d int id , s i g n e d int len , c h a r * buf ) {
18 c o n s t s t r u c t st * p =& f p t b l 1 [( s i g n e d l o n g int ) id ];
19 p - > req ;
20 if (!( p - > req == f2 ) )
21 {
22 if ( p - > req == ( s i g n e d int (*) ( char , c h a r *) ) g1 )
23 g o t o _ _ C P R O V E R _ D U M P _ L 2 ;
24
25 if ( p - > req == f1 )
26 g o t o _ _ C P R O V E R _ D U M P _ L 3 ;
27
28 if ( p - > req == ( s i g n e d int (*) ( char , c h a r *) ) g2 )
29 g o t o _ _ C P R O V E R _ D U M P _ L 4 ;
30 }
31
32 f2 (( c h a r ) len , buf ) ;
33 g o t o _ _ C P R O V E R _ D U M P _ L 5 ;
34
35 _ _ C P R O V E R _ D U M P _ L 2 :
36 ;
37 g1 (( c h a r ) len , ( v o i d *) buf ) ;
38 g o t o _ _ C P R O V E R _ D U M P _ L 5 ;
39
40 _ _ C P R O V E R _ D U M P _ L 3 :
41 ;
42 f1 (( c h a r ) len , buf ) ;
43 g o t o _ _ C P R O V E R _ D U M P _ L 5 ;
44
45 _ _ C P R O V E R _ D U M P _ L 4 :
46 ;
47 g2 (( c h a r ) len , ( v o i d *) buf ) ;
48
49 _ _ C P R O V E R _ D U M P _ L 5 :
50 ;
51 }
5.3 Examination of Preciseness and Scalability
[image:17.612.146.444.131.510.2]In this section, we discuss the exhaustiveness of the abstract interpreter and the Orient-DB. Table 3 shows the scalability of the abstract interpretation. It shows the calculation time and memory consumption from several levels: task, module, and function. Every entry is the largest function in each levels. The related preciseness combinations are shown in Table 1. Each LoC refers to the scale of the code. The LoC is estimated from the goto-program, which completely resolves the loop and the context. Figure 11 shows the memory consumption Fig. 12 shows the trends of time and for each abstract interpreter.
XVII
Fig. 10.Engine unit-system dependence graph.
which is expected to take about 125 hours to resolve five hundred pointers man-ually (Sec. 2.3). As row “Unit #1-4” and column “Variable Time” shows, the variable abstract interpreter resolves the pointers from the largest unit entry in around 50 minutes. Actually we need to solve several unit entries, even though it can resolve in about 2 hours.
XVIII
[image:19.612.142.474.294.659.2]Fig. 11.Memory consumption. Fig. 12.Time consumption.
Table 1.Combination of preciseness options. Precisness Flow Context Loop Recurrent
#1 X
#2 X X
#3 X X
#4 X X X
#5 X X X
#6 X X X X
Table 2.Evaluation of Orient-DB.
# Criterion
# Extracted
instructions Time [ms]
1 146 68
2 419 146
3 536 188
42 3,562 1,065
88 5,949 1,349
The total num. of instr. is 200k.
Table 3.Evaluation of abstract interpretation.
Entry Pre. LoC Constant Variable Dependence Memory [MB] Time Memory Time Memory Time Module #1 4,715 540 00:00:04 12,015 00:04:45 14,395 00:04:42
#2 5,766 558 00:00:04 26,460 0:0:5:45 22,849 00:05:02
#3 7,182 8,843 00:03:49 10,137 00:03:19
#4 8,779 3,158 00:01:07 6,280 00:01:30
#5 14,364 19,740 00:07:10
#6 17,558 11,975 00:02:50
Feature #1 35,090 2,528 00:00:13 33,756 00:15:02 49,033 00:18:12 #2 34,874 3,222 00:00:23 89,819 00:21:51 92,351 00:27:39 #3 43,285 17,664 00:07:41 44,260 00:15:34 #4 50,072 15,770 00:06:46 55,348 00:17:10
#5 86,570 88,239 00:32:28
#6 100,144 109,197 00:38:56
Unit #1 115,126 10,200 00:00:50 64,753 00:53:01 96,699 00:47:14 #2 123,881 16,390 00:02:06 154,118 00:49:36 out of memory #3 132,663 48,008 00:40:41 99,864 00:39:33 #4 155,178 153,872 00:46:15 out of memory
#5 265,326 198,149 01:16:06
XIX
5.4 Discussion of Preciseness and Scalability
As demonstrated above, CAT can provide the unit-system dependency graph (See Fig. 10). In this section, we discuss the CAT’s components; CPROVER, Orient-DB, and Visualization.
CPROVER mainly provides the abstract interpreter, which is one of two key technical items. The abstract interpreter solves the pointer and the dependency at the instruction level. Table 3 shows the possibility of coordinating the scal-ability and the preciseness; however, the scalscal-ability still remains an issue. The abstract interpreter consumes up to 198 GB of memory, furthermore, Unit #1, #4, and #6 are out of memory. Actually, Unit #5 satisfies our visualization use-case (the context sensitivity or more precise analysis is not needed.). In general, that is too heavy to perform on a standard desktop PC, but the performance requirement can be overcome by sharing the Orient-DB repository via a network as the host. In this case, the computing demand on the local PC is not as high. From this experience, not only the large program scale (half million LoC) but also the many (several thousands of) global variable impacts the scalability. There are two main reasons for this. First, the domain information for each global variable cannot be released because they are “global” variables. Second, every global variable domain (status) needs to be stored for each instruction. This means the memory consumption is a multiplication of the number of global variables and LoC, approximately. The embedded controller cannot avoid using the global variable, and we typically cannot expect to decrease the LoC. The only way is to lessen the domain scale and update the domain objects.
The essential advantages of abstract interpretation are the soundness and the ability to trade off the preciseness with the computation time. The ideal usage is applying the abstract interpreter in a hierarchical fashion; meaning, in the early phase, use a less precise (scalable) abstract interpreter to simplify (erase dead code, simplify pointers), then in the later phase, gradually apply a precise (less scalable) abstract interpreter to the simplified code. The CAT exploits the abstract interpreter in this way; however, our design of data structures for the Orient-DB (Fig. 6) deals with the most precise instruction-level of the informa-tion and does not consider intermediate informainforma-tion like unwound-bounds and pointer simplifying. More sophisticated data-structures that can deal with the history of the result from the abstract interpreter are needed to better exploit the abstract interpreter.
XX
5.5 Future Work
Authors think the CAT tool achieved a trial level, even though still there remain improvement items. The biggest advantage of the CAT is that is capable to extracting the exhausting dependence analysis which includes pointer analysis with just one night. We have already presented a demo to designers. They are also interested in the capabilities of scalability and, the result of program slicing; even though it is the function level graph, the slicer extracts well because of the statement level of dependence analysis is done in behind. (See bottom of Fig. 10, the slicer does not extract all of input edges atfunc 6.)
We are planning trial with 3 domains; Vehicle Control, Engine and Fuel Cell domain. The vehicle control domain is rapidly increasing the work-hours due to applying Automated Driving Technology. The engine still remains the largest scale of controller in automotive. The fuel cell system is also complex system which involves FC stack, Battery, and Electric motor. We expect the around 8,000 hours’ reduction of work-hours per an ECU development when the CAT is deployed.
6
Conclusion
In this paper, we focus on the enhancement of control software development processes in the early development phases. The technical difficulty relates to the management of up to half a million lines of code per ECU. We applied an advanced static analysis method, abstract interpretation, to address function pointers and variable pointers and to extract an instruction-level of dependency. We systematize this process in the CAT tool, which uses CPROVER and Orient-DB. The CAT tool can handle a half million lines of code, resolve 500 pointers, and extract a half million dependencies within 8 hours. CAT provides system graphs to understand software architecture on demand. CAT is a flexible and sophisticated tool for reviewing code in early development phases.
References
1. Haughey, Bill. Design Review Based on Failure Modes (DRBFM) and Design Review Based on Test Results (DRBTR) Process Guidebook. SAE International, 2012. 2. Ron Cytron, et al. An efficient method of computing static single assignment form.
In: Proceedings of the 16th ACM SIGPLAN-SIGACT symposium on Principles of programming languages. ACM, 1989. p. 25-35.
3. Mark Weiser. ”Program slicing.” Proceedings of the 5th international conference on Software engineering. IEEE Press, 1981.
4. Patrick Cousot and Radhia Cousot, Abstract interpretation: a unified lattice model for static analysis of programs by construction or approximation of fixpoints. In: Proceedings of the 4th ACM SIGACT-SIGPLAN symposium on Principles of pro-gramming languages. ACM, 1977. p. 238-252.
XXI
6. Alfred V. Aho, Compilers: principles, techniques and tools (for Anna University), 2/e. Pearson Education India, 2003.
7. http://www.cprover.org/cbmc/ 8. https://orientdb.com/
9. Daniel Kroening and Michael Tautschnig. CBMC bounded model checker. In: Tools and Algorithms for the Construction and Analysis of Systems. Springer Berlin Hei-delberg, 2014. p. 389-391.
10. https://gcc.gnu.org/
11. Claudio Tesoriero, Getting Started with OrientDB. Packt Publishing Ltd, 2013. 12. http://graphml.graphdrawing.org/
13. https://www.yworks.com/products/yed?
14. Sandrine Blazy, David B¨uhler and Boris Yakobowski, Structuring Abstract Inter-preters Through State and Value Abstractions, VMCAI’17, 2017. p. 112–130. 15. Bruno Blanchet, Patrick Cousot, Radhia Cousot, J´erˆome Feret, Laurent