City, University of London Institutional Repository
Citation
:
Nadimi, S. and Fonseca, J. ORCID: 0000-0002-7654-6005 (2019). Image based
simulation of one-dimensional compression tests on carbonate sand. Paper presented at the
micro to MACRO Mathematical Modelling in Soil Mechanics, 29 May - 1 Jun 2018, Calabria,
Italy.
This is the accepted version of the paper.
This version of the publication may differ from the final published
version.
Permanent repository link:
http://openaccess.city.ac.uk/id/eprint/22904/
Link to published version
:
Copyright and reuse:
City Research Online aims to make research
outputs of City, University of London available to a wider audience.
Copyright and Moral Rights remain with the author(s) and/or copyright
holders. URLs from City Research Online may be freely distributed and
linked to.
Image based simulation of one-dimensional
compression tests on carbonate sand
Sadegh Nadimi*, Joana Fonseca**
* University of Leeds, Leeds, UK, Email: [email protected]
** City, University of London, London, UK, Email: [email protected]
Abstract High factors of safety and conservative methods are commonly used on foundation design on shelly carbonate soils. A better understanding of the behav-ior of this material is, thus, critical for more sustainable approaches for the design of a number of offshore structures and submarine pipelines. In particular, under-standing the physical phenomena taking place at the microscale has the potential to spur the development of robust computational methods. In this study, a series of one-dimensional compression tests were performed inside an X-ray scanner to ob-tain 3D images of the evolving internal structure of a shelly carbonate sand. A preliminary inspection of the images through five loading increments has shown that the grains rearrange under loading and in some cases cracks develop at the contacts. In order to replicate of the experiments in the numerical domain, the 3D image of the soil prior to loading was imported into a micro Finite Element (µFE) framework. This image-based modelling tool enables measurements of the con-tact force and stress map inside the grains while making use of the real microstruc-ture of the soil. The potential of the µFE model to contribute insights into yield in-itiation within the grain is demonstrated here. This is of particular interest to better understand the breakage of shelly grains underpinning their highly compressive behavior
Introduction
2
microscale has the potential to spur the development of robust computational methods.
This study makes use of a recent developed micro Finite Element (µFE) model [6] The model takes as input the geometrical grain scale data obtained from micro tomography (μCT) to model the individual grains and their interactions in the framework of combined discrete-finite-element method. The soil fabric is there-fore virtualized by meshing the constituent grains and allowing them to interact and deform according to appropriate constitutive model and frictional contact conditions. The contact response results from the deformation of contacting bod-ies, which accounts for the specificities of each contact surface. This simulation technique presents exciting avenues to model complex morphologies numerically
Experiments
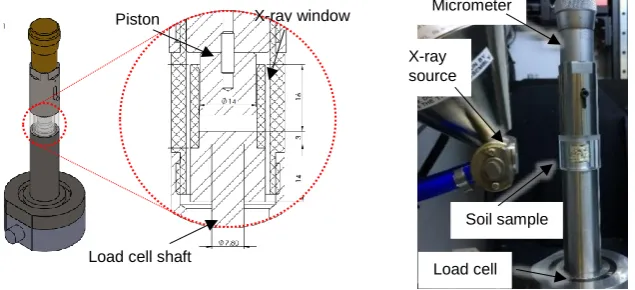
[image:3.595.137.455.495.640.2]One dimensional compression tests were performed under dry conditions inside an x-ray scanner. The system used was a Nikon XTH 225 ST located at the Research Centre at Harwell (RCaH), Oxfordshire (UK). The soil investigated was a shelly carbonate sand from the Persian Gulf with a median grain size of 2 mm. The ex-perimental set-up consisted of a load cell, a vertical piston a micrometer and a small oedometer as shown in Fig.1. The set-up was designed for this particular scanner and was mounted on the rotating table of the scanner. The size of the specimen was 13.5 mm in diameter with an aspect ratio (height/diameter) between 1.0 and 1.1. The force was exerted by a micrometer with 450N axial loading ca-pacity [7]. The sample container was made of Perspex with 2mm thickness which has less than 3 µm deflection under the maximum applied force. The lateral fric-tion has been minimized by considering a 1 mm gap between the container and the x-ray window. The exerted force was monitored by a low profile ‘pancake type’ load cell with a 500 N capacity.
Fig. 1. Schematic of the apparatus to perform one dimensional compression tests inside a µCT scanner
X-ray window
Load cell shaft
Piston Micrometer
Soil sample
The x-ray tomography data was acquired at an accelerating voltage of 90 keV. A total of 3142 projections were collected per scan, with an exposure of 500 ms per projection. The 3D images acquired had a resolution of 9.5 µm (length of voxel edge). The tests were performed at five loading stages up to a maximum 10% axi-al strain. In-house imaging processing codes were employed to segment the im-ages in order to identify the individual grains. This includes firstly to binarise the images using Otsu’s thresholding and subsequently apply an iterative watershed algorithm to overcome the challenges posed by the large diversity and complexity of the shapes associated with the bioclastic nature of shelly sands. The codes are fully described in [8].
Numerical Meshing
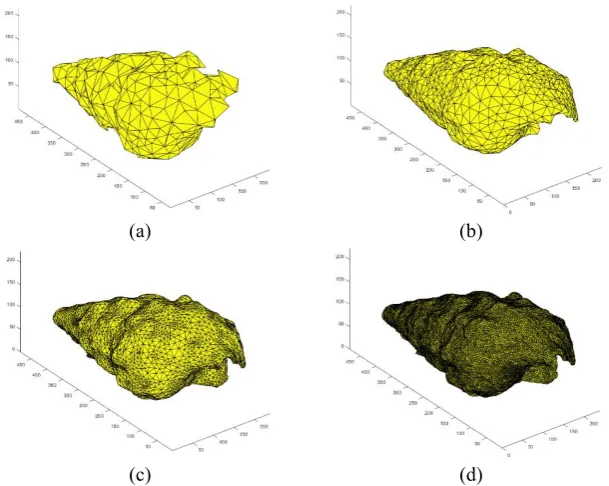
An important requirement of the meshing process is to obtain a good finite-element representation of irregular shaped grains which in shelly grains is particu-larly relevant. The surface mesh extraction technique used here was a refinement of the constrained Delaunay triangulation implemented using a developed Matlab (Mathworks, 2015) script to generate the image-based mesh. [6]. Triangular iso-surfaces were extracted from the 3D image with pre-set values for density, which controls the size and number of triangles representing the surface of each grain.
(a) (b)
[image:4.595.141.446.413.656.2](c) (d)
4
Fig. 2 shows a single grain meshed with different mesh sizes. The mesh size and quality is controlled by four parameters, which includes the minimum angle of the triangles, the maximum volume of an element, the maximum surface element size and the maximum distance between the center of surface bounding circle and the center of the element bounding sphere. Fig. 2a shows a coarse mesh with parame-ter values of 40°, 30, 30 and 10, respectively. It can be observed that this mesh size cannot capture well the irregular features of the shelly grain. The mesh was progressively refined in the three examples presented in Figs. 2b, 2c and 2d, a minimum angle of 40° was used in all cases due to efficiency issues. The four pa-rameters used in these cases were: 40°, 20, 30 and 5 (Fig. 2b), 40°, 30, 30 and 1 (Fig. 2c) and 40°, 3, 3 and 1 (Fig. 2d). It was found that the mesh presented in Fig. 2c (termed here fine mesh) is able to capture well grain shape while avoiding the more expensive computation cost of using a highly refined mesh in Fig. 2d (super fine mesh). Thus, the fine mesh was chosen for the simulation.
Figs. 3a and 3b show the virtualized assembly with coarse and fine mesh, respec-tively. The main drawback of using a coarse mesh is that contact interactions cannot be accurately simulated. The fine mesh used here corresponds to an ele-ment mesh size that is 5 times the voxel size of the images.
(a) (b)
Fig. 3. Numerical mesh generated for the full assembly using a (a) coarse mesh, (b) fine mesh.
Simulations
The numerical mesh was imported into the µFE model that runs in the Abaqus fi-nite-element package (Dassault Systèmes, 2014). The sample was confined later-ally using a rigid cylinder and the displacement was applied at the top of the sam-ple.
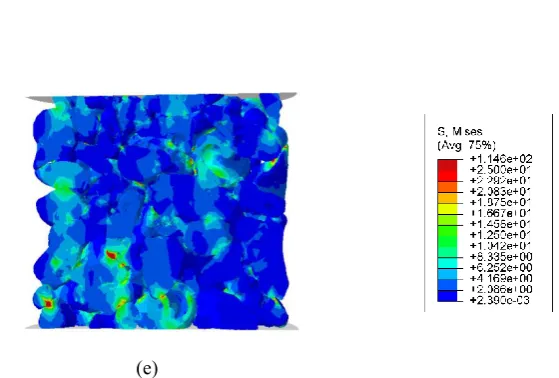
Fig. 4 shows the stress distribution in the full assembly at four stages of loading, using the von Mises criterion. The stages include: stage 0 at no applied loading (εa
be seen that at the initial stage, since the sample is not loaded yet, all grains have a stress field constant and equal to zero (Fig. 4a). At stage 1 the stress concentration starts at the grain contacts and propagates through the grains before being trans-mitted to other neighboring grains, again by way of their contacts (Fig. 4b). At stages 2 and 3 (Fig. 4c and 4d), the assembly becomes more heavily loaded and this is shown by the larger internal stress values exhibited at the grains. The stress at the contacts can be better visualized in the vertical cut through the sample pre-sented in Fig. 4e. These data enable the identification of the stress-transmitting particles and the investigation of the micro-mechanisms that lead to the breakage initiation within the grain.
(a) (b)
6
[image:7.595.137.417.106.295.2](e)
Fig. 4. Stress distribution in the full sample at (a) 0% strain, (b) 5% strain, (c) 7.5% strain, (d) 10% strain and (e) vertical cut through the sample at 10% strain
Conclusions
This paper presents a preliminary investigation into the numerical simulation of shelly carbonate sands that takes into account the detailed representation of grain shape. We have demonstrated here the capability of the model to measure the stress concentration at the contacts and its propagation throughout the grain skele-ton for materials with complex grain morphology.
Acknowledgments The authors gratefully acknowledge the financial support by the UK Engi-neering and Physical Sciences Research Council (EPSRC) under the grant number EP/N018168/1 and the collaboration of Prof Peter Lee from the RCaH.
References
[1] Coop, M.R. 1990. The mechanics of uncemented carbonate sands. Géotechnique, 40(4): 607– 626
[2] Semple, R.M. (1988). The mechanical properties of carbonate soils. In Engineering for cal-careous sediments (eds R. J. Jewell and D. C. Andrews), pp. 807–836. Rotterdam, the Neth-erlands: Balkema.
[3] Fonseca, J., Reyes-Aldasoro, C.C. & Wils, L. 2015. Three-dimensional quantification of the morphology and intragranular void ratio of a shelly carbonate sand. Proc. 6th Int. Symp. Def. Characteristics Geomaterials.
[4] API (American Petroleum Institute) (2007). Recommended practice for offshore platforms. Washington, DC, USA: API.
[5] Jardine, R., Chow, F., Overy, R. & Standing, J. (2005). ICP design methods for driven piles in sands and clays. London, UK: Thomas Telford Ltd.
[6] Nadimi, S. and Fonseca, J., 2017. A micro finite-element model for soil behaviour. Géotech-nique, https://doi.org/10.1680/jgeot.16.P.147.
[7] Nadimi, S., Kong, D. & Fonseca, J. 2017. From imaging to prediction of carbonate sand be-haviour. Paper presented at the ICTMS 2017, 26-30 Jun 2017, Lund, Sweden.