THE COMMON AGRICULTURAL POLICY AND THE EEC'S
TRADE RELATIONS IN THE AGRICULTURAL SECTOR
(EFFECTS ON THE DEVELOPING COUNTRIES) (1)
(1) The Commission asked its staff to prepare this study in connection with the European Parliament's resolution .of "18/9/80 no. 1-341/80
PREFACE
1. During the debate on hunger in the world, one of the problems of concern to the European Parliament was the repercussions of the
Community's agricultural policy and agricultural trade on the rural
development and food situation of the developing countries (DCs).
To enable it to consider this subject in greater depth, Parliament invited the Commission in its resolution of 18 September 1980 to undertake a study into
- the effects of the CAP on the international trade in foodstuffs;
the repercussions of the EEC's agricultural exports on world markets
and on the DCs.
2. Moreover, the alleged effects of the EEC's agricultural and
commercial policies on rural development in the Third World are also
a subject of concern to the DCs, who, at international meetings in
the field of rural development, frequently question - albeit in rather general terms - the "agricultural protectionism" of the developed
coun-tries in general and of the EEC in particular. In so doing they refer in particular to the analyses carried out by international bodies such
as the FAO, UNCTAD, the WFC, etc.
3. The purpose of this study is to answer the questions raised by
the European Parliament, while dealing at the same time with the analyses
put forward by certain international bodies.
This study consists of two parts.
The first part looks at trends in agricultural trade between the DCs and the EEC in general. Following an overall analysis, the study
endeavours to assess the repercussions of the CAP on the DCs'
agricul-tural trade. Moreover, the supply and demand trends for agriculagricul-tural
products in the DCs are examined with a view to establishing the outlook for · the future.
The second part is devoted to study of the EEC's agricultural
commercial policy with regard to the DCs. Following an outline of the
basic principles of the CAP and the main features of the multilateral and
bilateral framework within which agricultural trade between the EEC and
the DCs takes place, the study analyses trade between the EEC and the DCs
in the different types of products subject to a common market
Table of contents
Preface
Table of contents List of abbreviations
Summary and conclusions
PART I - Analysis of the developing countries' trade in
agricultural products with the EEC
1. The EEC's agricultural trade with the developing countries
1.1.0verall analysis
1.1.1. The EEC's imports from the developing countries
1.1.2. Community exports and the developing countries in the
context of the world market
1.2.Analysis of trade in the various types of agricultural products
1.2.1. The developing countries' exports
1.2.2. The EEC's exports 1.2.3. Tariff arrangements
2. The developing countries' production of and trade in agricultural
products
2.1. Trend of the developing countries' agricultural trade in volume
terms
2.2. Trend of supply and demand with regard to agricultural products
in the developing countries
2.3. Supply and demand with regard to the main products
2.4. Outlook : the developing countries' trade in agricultural
products in 1990 and 2000
2.4.1. Overall trend
2.4.2. Prospects for a number of products
*
* *
PART II -The Community's agricultural commercial policy with regard to
the developing countries
1. Outline of the basic principles of the EEC's agricultural policy
1.1. Objectives
2. The bilateral and multilateral framework for agricultural trade
between the developing countries and the EEC
2.1. The multilateral framework
2.2. The generalized preferences system
2.3. The preferential agreements
2.3.1. The Lome Convention
2.3.2. The Mediterranean Agreements
2.3.3. The EEC - Yugoslavia Agreement
3. Analysis of agricultural trade between the EEC and the developing
countries in the various types of product subject to a common
market organization
3.1. Oilseeds, vegetable oils and oilcake 3.2. Olive oil
3.3. Sugar
3.4. Cereals
3.5. Milk and milk products
3.6. Beef and veal
3.7. Poultrymeat
*
*
Tables
LISTE OF ABBREVIATIONS
ACP African, Caribbean and Pacific States, signatories with the EEC to the Lome Convention
CAP Common agricultural policy
CCT Common Customs Tariff
DC (Market economy) developing country according to the defini-tion used by the FAO and UNCTAD, i.e. Africa (excluding South Africa>, Latin America, Asia (Excluding China, North Korea, Kampuchea, VietNam, ~ongolia and the USSR) and Oceania (excluding Australia and New Zealand)
EEC European Economic Community
EUR-6 EEC as originally constituted (Belgium, Federal Republic of Germany, France, Italy, Luxembourg and the Netherlands)
EUR-9 EEC after the first enlargement :the above six Member countries plus the United Kingdom, Ireland and Denmark)
FAO Food and Agriculture Organization of the United Nations
GATT General Agreement on Tariffs and Trade
GSP Generalized System of Preferences
IBRD International Bank for Reconstruction and Development
MMI Maghreb countries (Morocco, Algeria and Tunisia), Mashreq countries (Lebanon, Egypt, Syria and Jordan)and Israel, with which the EEC has concluded Cooperation Agreements
MTN Multilateral trade negotiations organized under GATT from 1973 to 1979
NIMEXE Tariff nomenclature used by the EEC
SITC Standard International Trade Classification (international tariff nomenclature)
UN United Nations
UNCTAD United Nations Conference on Trade and Development
SUMMARY AND CONCLUSIONS
1. It can be concluded from this study that the inevitable repercussions of the
CAP on non-member countries, and in particular on the developing countries (DCs) (1), vary according to the product concerned and from country to
country; nevertheless the impact is relatively limited.
The repercussions were studied by setting trends in trade between the EEC a~d
developing countries in products covered by the CAP in the context of world
(2)
trade trends for agricultural products.
The main points brought out by the study may be summarized as follows :
1.1. The EEC is the world's largest importer of agricultural products and the
DCs' biggest customer. In 1979 the EEC imported almost S 55 000 million
worth of agricultural products worldwide, of which S 27 000 million came
from the DCs (this represented 27 % of world agricultural exports and
30 %of the DCs' agricultural exports). The EEC imports S 100 worth of
agricultural products from the DCs per head of population, approximately
twice the corresDonding figure for the United States <S 49) or Japan
<Z 56).
1.2. In total volume terms, the introduction of the CAP has had Little
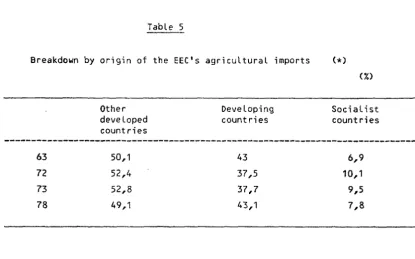
effect on the DCs' share in the EEC's agricultural imports. In 1979 the DCs supplied 43 %of the EEC's agricultural imports, a figure
inden-tical to that for 1962 (the year the CAP came into existence). Between
1962 and 1979 that market share fluctuated, but the fluctuations, following
fairly closely the trend of the DCs' share of the world market for
agricultural products, reflect more the changes in the supply of those
products offered by the DCs than any changes in the EEC's import policy.
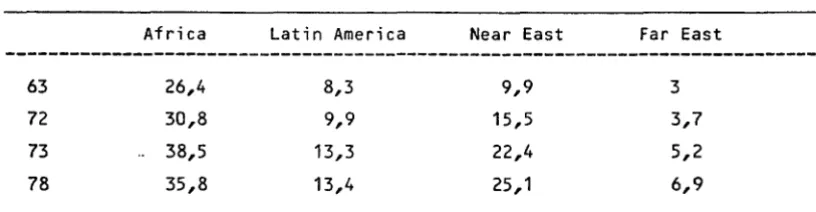
1.3. As regards the geographical area covered by the EEC's agricultural imports from the DCs, there were changes linked to supply developments in the
various regio~of the Third World. Indeed, the DC regions which conside-rably expanded their total exports (Latin America, Middle East) also
(1) For definition of "developing country (DC)", see List of abbreviations, page V.
increased their share of the Community market - at the expense of other
regions whose expansion of total agricultural exports was on the Low side (Africa in particular).
1.4. The CAP does not appear to have had any significant effect on the
compo-sition of agricultural imports from the DCs. If, in the DCs' total
agri-cultural trade, one isolates the products for which the DCs are net ex-porters and which are subject to CAP-based rules on importation into
the EEC, it is found that the proportion of the DCs' total atricultural
exports accounted for by such products does not differ appreciably
whether one considers exports to the whole world (21 %) or exports to
the Community alone (17 %). However, a more detailed analysis shows that
these products do not enter the EEC under the normal arrangements but
under specific commercial regimes granted to certain groups of countries;
this is the case with sugar (ACP sugar protocol, India), beef and veal (ACP), tobacco CGSP), etc •••
1.5. Analysis of the tariff artangements applicable to the DCs' agricultural
exports reveals that 60% of such exports, in value.terms, face a zero
duty, one-third are subject to a relatively low duty and only 7 %of the
products are actually subject to levies. These percentages illustrate the efforts made by the EEC at multilateral Level (GATT, MTN) and
bilateral Level (Lome, MMI) and via the introduction of the GSP.
2. The CAP has also had repercussions on the DCs' agricultural trade insofar
as it influences the trend of exports of agricultural products from
the Community. The repercussions, though varying from case to case, are
relatively Limited, generally speaking; it is permissible to state,
however, that European production and exports make a real
contri-bution to strengthening world food security.
2.1. The EEC is the world's second-Largest exporter of agricultural
products and the second-Largest supplier of such products to the DCs •
In 1979 it exported almost Z 21 000 million worth of agricultural
products worldwide, including Z 10 000 million to the DCs; these figures represent 10 % of world agricultural imports and 16 % of the
DCs' agricultural imports. By way of comparison, the United States
provides 20% of world agricultural imports and 23% of the DCs'.
It is important at this stage to note the EEC's sizeable agricultural
trade deficit both worldwide (Z 34 000 million) and with the DCs
<Z
17 000 million); the cover rate is 0.42 for all agricultural tradeand 0.37 for agricultural trade with the DCs.
2.2. The DCs are an important market for the EEC: they take 42 % of the
EEC's agricultural exports. This percentage is increasing, even though
the EEC's share of world trade has remained constant at around 10 %, following a slight increase when the CAP machinery was established.
The increase in the proportion of Community exports accounted for by
the DCs is the result of :
- the increase in the DCs' total agricultural imports. It is interesting
to note that this increase came about fairly suddenly in 1973 and
1974 as a result of the food crisis at that time and the increase
in the agricultural imports of the oil-exporting countries;
- the increase in the EEC's share of agricultural products imported by
DCs.
Although EEC exports have increased at more or less the same rate in all
the regions of the Third World in recent years, the importance of the
Middle East as a market for Community agricultural products has shown a particular increase.
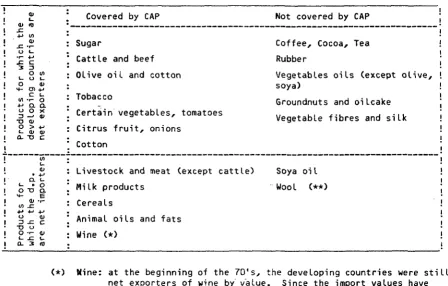
2.3. Most of the agricultural products exported by the EEC are products
covered by the CAP <nine-tenths). For the vast majority of these products,
the DCs are net importers. It can therefore be said that, in sofar as the DCs are concerned, changes in the EEC's agricultural production have
enabled it to help meet an ever-increasing demand for food, particularly
in the cereals and milk products sectors.
For the former product, the EEC occupies a relatively minor position
(5 %) on the market, which is dominated by the North American exporters;
for the latter product, the EEC has always occupied a dominant posi-tion (72 %of the world market in 1979).
It has to be recognized, however, that some Community exports do in fact compete with certain DC exports. Approximately 20 % of the EEC's agricul-tural exports worldwide consist of products, principally sugar and beef, for which the DCs are as a whole net exporters.
For both sugar and beef, the EEC share of the world market is relatively
small even though it has steadily increased in recent years.
3.1. If the trend of the DCs' trade is placed in a wider economic context, it can be seen that the slow expansion of DC exports and the rapid
increase in their imports are due above all to developments on their domestic markets • In fact, the most important factor in these develop-ments is the slow increase in production compared with the rise in
demand. In addition, consumption patterns in DCs have also changed
re-~ulting in an increase in imports of products which frequently are diffi-cult to produce locally <wheat, certain types of meat, dairy products). The expansion of EEC exports, in particular, is greatest in the case
of the developing countries whose domest1c demand has increaserl more rapidly than production.
3.2. This overall analysis is borne out by an examination of the development
of trade in the main groups of agricultural products.
Two types of products have to be distinguined here : those for which the
DCs run a deficit - which is expected- to increase between now and
1990 or the year 2 000 - and those of which the DCs have an exportable surplus.
a) The DCs' deficit will increase rapidly for products such as cereals or milk products. The EEC's exports help towards meeting the
deficit.
b) With regard to the products which are exported by the DCs and can
compete with Community products - not therefore including tropical
products (coffee, cocoa, tea, textile fibres, rubber)- problems
have already arisen or will arise for the Community. The level of the EEC's self-sufficiency rate for sugar and beef limits its
capacity for importing larger quantities from the DCs and means that in certain cases the EEC has exported on the world market.
In the oil crops sector, the EEC is still a net importer but
future enlargement will pose delicate problems in this field vis-a-vis traditional suppliers of olive oil.
3.3. A regional analysis of the agricultural situation in the third world
highlights the dramatic deterioration in Africa. Since 1960, Africa's share of world agricultural imports have been increasing and its share
in agricultural exports decreasing. This trend (also reflected by a fairly steep rise in the growth rate of imports and a decline in the
rate of export growth) is explained by the increasingly serious imbalance
between supply and demand of agricultural products.In fact, among the
diffe-rent developing regions, Africa has the greatest difference between the
rates of increase in production and consumption.
4. Examination of the trend of arrangements for trade between the EEC and the
DCs in the case of the most important agricultural products subject to a
common market organization leads to the following observations
4.1. The market organization have progressively abolished national protective
measures and established a Community regime, based essentially on
non-discrimination, which is generally more Liberal than were the national
measures preceding it.
The EEC's import policy is not geared solely to the levy refund
system, which is often identified with the CAP, but also embraces other arrangements : the combination of the levy and customs (e.g.
fresh beef and veal); the combination of customs duties and a reference
price system (wine, certain fruit and vegetables); or a customs duty
alone.
The quantitative import restrictions which most of the Member States
applied (or could apply) before the CAP was established do not form
part of the normal range of protective instruments at the EEC's
frontiers.
4.2. In the oilseeds, oils and oilcake sector, the EEC opted in 1966 for
Liberal import arrangements : for all seeds and oilcake the duty is
zero; f& oils , duties are between 5% and 15 %. Imports of oils from
the DCs are covered by preferential arrangements under the Lome
Convention (exemption from customs duty) or the GSP (reduction of duties). Community imports of these products have 9rown rapidly, the increase in
imports of oilseeds being accounted for first and foremost by the
United States, whereas the increase in imports of oils and oilcake is
accounted for by the DCs.
4.3. In the olive oil sector, the EEC introduced a levy system as from 1966. For this typically Mediterranean product there is no real world market.
To safeguard the interests of associated countries, such as the
Maghreb countries and Turkey, the EEC granted preferential arrangements
-under the cooperation agreements with those countries - whereby part
of the Levy is replaced by an export tax.
4.4. In th~ sugar sector, a new market organization was introduced as from 1 July 1981. This system covers prices, quotas and trade arrangements.
The new system stipulateG that henceforward charges for Community sugar
exports will borne by producers.
This is a fundamental change in the policy of the EEC, which had become
a net exporter of sugar with an increasing share of world exports. The
EEC maintains sizeable trade flows with the DCs : the EEC imports raw sugar from the DCs and re-exports refined sugar (particularly to
the Middle East). The EEC has given the ACP sugar producers and India
preferential arrangements guaranteeing them access to the European
market for fixed quantities at a price within the range of prices paid
to European producers.
4.5. The organization of the cereals market that has been in existence since 1967 rests essentially on the annual fixing of Community prices
0ntervention price, reference price and threshold price). In trade
with non-member countries, Levies are charged on imports and refunds
can be granted on exports. There is provision for reductions in the Levy for certain cereal imports from Morocco, Turkey and the ACP.
In addition, the EEC imports quantities of manioc- notably from Thailand
and Indonesia - which is used instead of cereals for animal feed. Since
the DCs have a Large cereals deficit, the EEC grants refunds on exports
and issues Long-~erm certificates which can help them. It has also stepped up its contribution of cereals supplied in the form of food aid.
The role p~ayed by the EEC on the world market has grown in recent ·years, particularly since the EEC's self-supply rate for cereals has risen above 100 %, but it is severely constrained by competition from the dominant North American exporters.
4.6. The market in milk and milk products is based on the principle of
intervention prices and trade with non-member countries is subject to the refund levy system. In order to limit the growth of internal
production, special measures such as the corresponsibility levy have been
introduced. The EEC is the world's largest exporter of milk and milk
products and the largest supplier to the DCs. For some ten years now
the EEC has been providing substantial food aid in the form of milk
products, thus allowing agricultural products available in Europe to help offset the DC's food deficit.
4.7. The Community rules covering imports of beef and veal provide for the
combined application of customs duties and a variable levy. In recent
years the EEC has become a net exporter of beef and veal but the trade balance with the DCs as regards this product shows a clear deficit for
the EEC. The DC's share of imports of beef and veal into.the Community
has shown a consistent increase. Under the Lome Convention, the EEC gave
the ACP meat exporters the right (subject to quota arrangements) to
replace 90 % of the levy by an export tax.
4.8. The Levies on poultrymeat are made up of two components : a "cereals" component, which takes account of the quantity of cereals needed as
a production input, and an "industrial" protection component. The
refunds are calculated in the light of the world market price for the products and the price in the Community. Since poultry rearing is
characterized by fairly advanced technology, the world market is dominated by the developed countries (EEC, USA) although . recently Brazil
has begun to develop its exports. EEC exports of poultrymeat to certain
DCs saw a rapid expansion during the seventies (Arab.peninsula, Iran) •
ANALYSIS OF THE DEVELOPING COUNTRIES' TRADE IN
0. Introduction
The possible repercussions of the CAP on the developing countries' (DCs')
agricultural trade cannot be studied in isolation.
Firstly, the CAP covers only a limited number of agricultural and food
products of interest to the DCs and in order to have a full idea of the
policy's direct and indirect repercussions on those countries it is
necessary to situate Community imports and exports of CAP products from
and to the DCs in the context of the EEC's total agricultural trade with the Des.
Secondly, agricultural trade between the EEC and the DCs can be analysed only in the context of world agricultural trade. It is important to know
to what extent changes in EEC-DC agricultural trade are compensated for
(or not) by changes in trade relations with other regions of the world.
In order to take account of these various aspects, this chapter first
considers the overall development of the EEC's agricultural trade before
analysing trade in the various types vf agricultural products. The second
chapter will then establish the link between the trend of the agricultural
trade of the DCs and their production/consumption of agricultural products so as to arrive finally at an outline of the possible development of the
DCs' agricultural trade between now and the year 2000.
A number of preliminary remarks should be made.
1. Two distinct periods are covered in the analysis. The first period, from 1963 to 1972, covers the establishment and early years of operation
of the CAP for the six-member Community (EUR-6), the common market organization machinery having entered into force in 1968.
An analysis of the data for this period makes it possible to identify
the impact of the introduction of these measures on the EEC's trade relations with the DCs.
The second period, 1973-78, covers the first years of the Gommunity of Nine
(EUR-9> and the progressive application of the agricultural and commercial
policies to the new members of the Community.
2. In order to be able to describe and analyse agricultural trade relations
between the EEC and the DCs in the context of world trade in agricultural
products, it has been necessary to base the study on the statistics
published by international organizations and these are available only up to and including 1978.
For the parts of the analysis dealing with the trend of EEC imports and
exports, on the other hand, Eurostat sources are used in order to ensure
that the most recent information is available.
3. To.permit a comparison of the statistical data from various Community and non-Community sources, the Standard International Trade Classification
(SITC) has been used in preference to the Community classification
(NIMEXE). In the SITC, agricultural exports include food products (SITC 0+1+22+4) and agricultural raw materials (SITC 2-22-27-28). The
NIMEXE definition of agricultural trade (Chapters 1 to 24) is more restric-tive than the SITC definition. For example, it does not include rubber, textile fibres, hides and skins, etc ••••
4. Most of the data on imports and exports are expressed in current prices
and in dollars or ECU. This, apart from the problems of conversion to the chosen currency unit, raises questions of interpretation because of the
phenomena of inflation and relative price trends that arise, particularly
if the analysis covers a fairly Long period.
In order to resolve these difficulties, two methods have been followed.
In the first chapter, the analysis is carried out in terms of "market
shares" so as to eliminate inflation. In the second chapter, the data have
1. The EEC's agricultural trade with the developing countries
1.1. Overall analysis
1.1.1. The Community's imports from the developing countries in the context
of world trade
a) The EEC's total agricultural imports amounted to more than
Z
55 000 millionin 1979.
Since its creation, the EEC has always kept its position as the world's
largest importer of agricultural products.
During the period 1963-72 (EUR-6), the EEC's share of world imports averaged
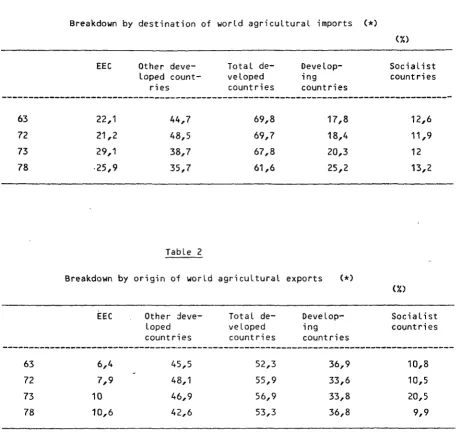
21.5 %; in 1973-78 (EUR-9), that share was around 27 %. This latter figure can be compared with Japan's share of world agricultural imports, which was 12.5 % during the period 1973-78, and with that of the United States, which averaged 11.3% during the same period (Table 1).
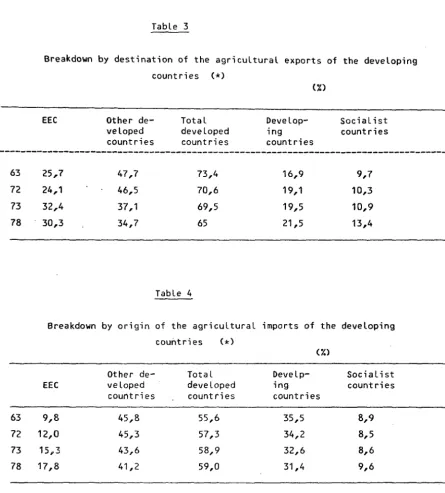
b) The EEC is the main market for the DCs' agricultural exports. In the
period 1963-72 (EUR-6), the EEC absorbed on average 25 % of the agricultural exports from those countries; in the 1972-78 (EUR-9) period, the figure was
almost 30 %. The DCs' exports of agricultural products to the EEC amounted
in 197~ tog 26 900 million (Table 3).
c) In comparison with the EEC, the other developed countries imports of
agricultural products from the DCs are appreciably lower : while in 1979 the EEC purchased almost g 27 000 million of agricultural products from the
Third World, American imports were less than one-half that figure
<S 11 600 million) and those of Japan approximately one-fifth (g 5 600 million). For the EEC, these imports represent 0.9% of its GOP; the
corresponding figure for the USA is only 0.5 % and for Japan 0.56 %. Per
head of population, agricultural imports from the DCs amount to g 104 for
the EEC, Z 53 for the USA and Z 49 for Japan.
into the Six accounted for by the DCs fell quite appreciably, from 43 % to 37.5 %, the beneficiaries being the developed countries and the socialist countries. In contrast, in the period 1973-78, there was an
increase in the above proportion from 37.7 %to 43 %. It is worth noting ,
moreover, that this market share was little affected by the enlargement of the EEC in 1972, which indicates that the DCs' share of agricultural imports
into EUR-6 on the one hand and into the new Member States on the other
were at similar levels (Table 5).
In order to be able to assess the causes of this development, it is
necessary to examine its various components. The trend of the DCs' share of
Community agricultural imports can in fact be broken down into three factors the trend of the DCs' share of world exports, the trend in the EEC's share
of world agricultural imports and the trend of the proportion of DC agricultural
exports which the EEC absorbs.
- The share of world agricultural exports accounted for by the DCs fell
from almost 37 % in 1963 to 33.6 % in 1972 before rising again to
37 % in 1978 (Table 2). The fluctuations in the growth of DC exports were
reflected on all the~port markets considered. The increase at the end of the period (the maximum figure being achieved in 1977)
is due essentially to the increase recorded then in the prices of
certain tropical products such as coffee and cocoa.
- The importance of the Community as an import market remained more
or less constant (22 % of world imports) in the period 1963-72;
that importance declined slightly (from 19% to 26 %) in the following
period (table 1).
- The importance of the Community market in total DC exports worldwide is, as has already been stated, showing a slight decline, having
fallen from 26 % in 1963 to 24 % in 1972 and from 32 % in 1973 to
30% in 1978 (Table 3).
e) An examination of these various components suggests that the most impor-tant factor in the fluctuations of the DCs1 share of the Community market
is the general trend of their agricultural exports in relation to world
exports.
During the most recent period there has also been a slight decline in the
importance of the EEC as an export market for the DCs. This decline has, however, been Less marked than that recorded by the other market-economy
developed countries. It is due principally to the expansion of inter-De
trade, which accounted for 17 %of the Des• agricultural exports in 1963
and 21.5% in 1978, and to the increase in the socialist countries• imports from the Des (which, starting from a Low level, increased to 10 % of the
Des• agricultural exports in 1963 and to 13.4 % in 1978).
f) A geographical breakdown of the Des• share of world agricultural exports shows that, with the exception of Africa, all the DC groups have
succeeded in improving their export performance. Although between 196~
and 1978 Africa's share of the world market in agricultural products fell from 9 % to 6 %, the share held by Latin America increased from 15 % to
16% and that of the Middle East from 1 %to 12 %, while the share held by
South and South-East Asia remained constant.
An analysis then has to be made, for each reqion, of the development of its tot~l aqricultural exports and of its position on the European market.
So1rh an analysis makes it possible to pinpoint the influence
exercised firstly by the geographical structure of the EEC's agricultural
trade and secondly by the trend of EEC demand on the development of DC-EEC
agricultural trade. Indeed, if the DC regions that are well represented on
the European market have experienced an expansion or decrease in their total exports, it can be said that the trend of DC supply is the preponderant
factor in the increase or decrease in the market share of the DCs as a
whole in EEC agricultural imports. If, on the other hand, the trend in the
importance of the EEC as a market for the various regions is preponderant, this means that it is the trend of EEC demand that is the main factor
behind the development of the DC share of the EEC's agricultural imports.
g) Overall - and for the whole of the period 1963-78 - the "supply" aspect
proves to be preponderant : in total DC exports, the share held by those regions from which the EEC imported the most has fallen. This is
particu-larly true of Africa, whose total agricultural exports as well as its exports
to the EEC are slowing down. The other developing regions have divided up
the share lost by Africa (Table 11).
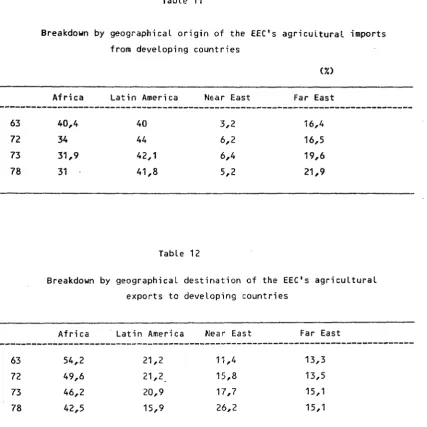
h) It can thus be seen that the DC group which at the beginning of the
period under consideration had the largest share of the European import
market and which enjoys the most favourable entry conditions has seen its position on the Community market eaten away (from 40 % in 1963 to 34 % in 1972 and from 32 % in 1973 to 31 % in 1978) compared with the exports from other DCs.
During the first period, this decline was beneficial to Middle East
exporters (who incresed their share of DC exports to the EEC from 3.2 % in 1963 to 6.4 % in 1972) and to Latin America (which increased its share of DC exports to the EEC from 40 % in 1963 to 44 % in 1972); during the second period, the benefit went to exports from the Far East <which increased from
19.6 % of DC exports to the EEC in 1973 to 22 % in 1978) (1)
The trend in the importance of the EEC as an export market for the various
DC regions (the "demand" effect) played a different role in the two periods:
in the first period, the decline in the relative importance of the EEC as
an outlet for the main exporters was in addition to the decline in the
market share of the DC regions which was also evident on the world market. In the second period, in contrast, the strengthening of EEC demand compensated
in part for the loss in market share suffered by the DCs because of the
relatively small increase in the quantities of exportable products they were offering on the world market.
Conclusion
This initial analysis enables a number of provisional conclusions to
be formulated :
- given that the share of DC exports in total Community agricultural imports
is following the same trend as the DC share of all other developed country
import markets, it seems at the very Least doubtful to point to the
EEC's specific commercial policy as the main reason for the decline in the
DCs' export performance. Firstly, the commercial policy has tended in
fact to move towards a Liberalization of import arrangements. Secondly,
the DCs' share of the Community market is not in constant decline but
is fluctuating, sometimes upwards sometimes downwards. Lastly, the
Community's policy cannot explain the fact that the DCs' performance on other
developed country markets has followed a similar trend.
(1) The growth here resulted in particular from the increase in Community imports of manioc from Thailand.
-The geographical breakdown confirms that the EEC's commercial policy
is not the main factor behind the trend in the DCs' share of the
Community market. It is in fact the trading partner enjoying, in general, the most favourable entry conditions that has lost the most ground.
1.1.2. Community exports and the developing countries in the context of the
world market
a) The EEC's total agricultural exports amounted to Z 27 000 million in
1980. The EEC is the world's second largest exporter of agricultural products
after the United States. It already occupied that position in 1963 (EUR-6)
when its market share was almost 6.5 % of world exports of agricultural
products. That market share increased slightly to almost 8% in 1972 (EUR-6)
and then increased to 10 % in 1973 after the first enlargement. During the
period 1973-80, the Community share fluctuated around that figure before reaching 11.1 %in 1980 (Table 2>. In the same period the relative shares
of the other major exporters generally declined : from 1973 to 1980 the
United States went from almost 20 % to just over 18.5 % of world exports,
while Canada moved from 5.5% to 4.6 %; the greatest drop was recorded by Australia from 5.2 %in 1973 to 4.0% in 1979.
b) In 1980 EEC exports of agricultural products to the DCs amounted to
Z 12 800 million. In the second half of the seventies, the EEC supplied an average of 16 % of the DCs' total agricultural imports, occupying second
place among the suppliers to the DCs (Table 4) after the United States
(23% of the DCs' agricultural imports).
In contrast to the other major exporters of agricultural products, the
EEC does not as yet have any medium- and Long-term commercial policy
instruments to facilitate the sale of its available agricultural products
to the DCs.
The refunds system is, however, applicable to the DCs, as it is to
all countries. Its development and effect on exports to the DCs will be
analysed with respect to certain products in Part Two of this study.
c) The DCs' market has been a dynamic outlet for the EEC's exporters,
particularly during the seventies. In the period 1963-72, the DCs' share of total extra-Community exports fluctuated around 27 %, and in the period 1973-78 increased from 31.5 %to 42.3 % (Table 6).
In order to have a better idea of the factors which determined this trend,
it is necessary to break it down into a number of components. The trend in
the DCs' share of EEC agricultural exports can in fact be broken down into
three components : the trend in the DCs' share of world agricultural imports, the trend in the importance of the EEC as an exporter of agricuLtural
products to the DCs and worldwide :
- following virtual stagnation in the DCs' relative share of world imports
of agricultural products around the 18 %mark in the period 1963-72,
that relative share increased rapidly between 1973 and 1978 from
20.3 %to 25.2 % (Table 1).
- The EEC's share of the DCs' agricultural imports increased from
10 % in 1963 ro 12 % in 1972; in the period 1973-78 it increased from 15 %to 18% (Table 4>.
That increase took place in the period 1963-72 (EUR-6) to the
detriment of the other DCs and during the period 1973-78 (EUR-9)
to the detriment of the other developed countries and to a lesser
extent other DCs.
-The EEC's share of world exports of agricultural products increased
from 6.4% in 1963 to 8% in 1972 (EUR-6) and from 9.4% to 11.1 %
from 1973 to 1980 (EUR-9). This means that the establishment of the CAP machinery coincided with a slight increase in the EEC's relative share
of the world market in agricultural products, which nevertheless remained
at a relatively low level (Tables 2 and 31).
It can be concluded from the above three findings that the increase in
the proportion of total Community agricultural exports accounted for
by agricultural exports to the DCs is due first and foremost to the fact
that the EEC became a larger supplier to the DCs and, furthermore, because the DCs increased their call on the world market.
During the first period, the importance of the EEC as a supplier to the
DCs increased at the same rate as the increase in its relative share of the
world market. During the second period the growth in the EEC's share of the DC's imports was more rapid than the increase in the EEC's share of
world trade.
It should also be noted that the increase in the DCs' relative share of
total world agricultural imports - up from 18% in 1963 to 24 % in
1977-took place fairly suddenly between 1973 and 1974. There are two reasonffor this:
the 1974 food crisis, which has had lasting effects on the structure
of world trade;
the increase in imports of agricultural products by the oil-exporting
countries.
d) A geographical breakdown enables a better assessment to be made of
the factors that have influenced the increase in the EEC's share of the DCs' import market. If the EEC's share of agricultural exports to the DCs
as a whole is increasing because of rising demand from certain DC regions,
it is clear that the "demand" factor has been the main explanation. In the
opposite case, it is the EEC's export effort, i.e. the "supply" factor that will be preponderant. In the period 1963-77, all the DC groups saw an
increase in their share of world imports. The greatest increase was recorded by
Africa (from 3.5 % of world imports in 1963 to 5.4 % in 1978) (Table 8).
In the first period, EEC exports to the various regions increased more or
less at the same rate on all markets. Since the geographical distribution
of agricultural trade (demand aspect) did not therefore influence the trend of
total agricultural exports, it was the strengthening in the EEC's position
as an exporter of agricultural products on all markets (supply aspect) that explains the increase in its share of the DCs' agricultural imports
(Tables 10 and 12).
In the second period, in contrast, the expansion of exports to the Middle East was greater than that of exports to 10ther destinations. The "DC demand"
factor is stronger than the "supply" factor as an explanation for the
expansion in the EEC's market share (Tables 10 and 12) •
e) These various analyses lead us to the conclusion that the EEC is
becoming an increasingly important supplier of agricultural products
to the DCs.
This increasing importance can be explained by two factors relating
in the first case to the supply side and in the second case to demand
for agricultural products :
-the EEC has made special efforts to channel agricultural products to
the DCs, notably via the supply of food aid;
the EEC's position as a traditional supplier to countries experiencing
worsening food deficits over the years (Africa) or countries with rapidly expanding markets (Middle East) has resulted in a more rapid increase
in the Community's agricultural sales than in those of other exporters •
1.2. Analysis of trade in the various types of agricultural products
In itself, the total amount of the EEC's imports from the DCs does not
give any indication as to the real effects of the arrangements for the
importation of agricultural products into the Community. If one wishes to
arrive at a more precise evaluation of the consequences of those arrangements on the real export possibilities of the DCs, it is necessary to distinguish
between the products involved according to whether or not they are affected by provisions resulting from the CAP. All the products for which there is a
common market organization accompanied by implementing measures have been
included in the category "CAP products".
The number of products covered by the classifications and analyses is limited by the data available in the FAO trade yearbooks, which constitute
the most detailed source of statistical information at international
level 1) <Table 13).
1.2.1. The developing countries'exports
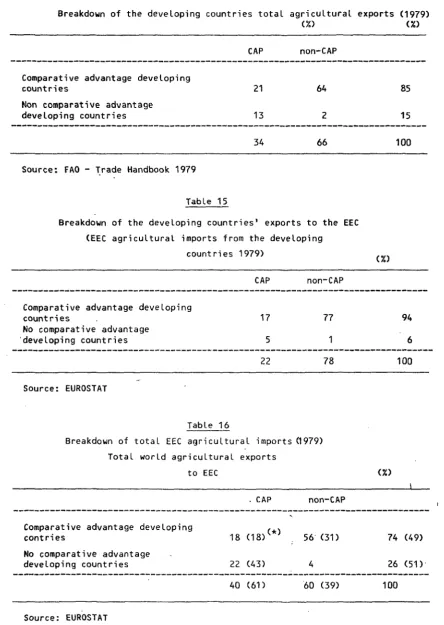
a) Tables 14 and 15 in the Annex, which have been drawn up on the basis
outlined above, show that of the total volume of the DCs' agricultural
exports worldwide one-third involves products covered by the CAP; in total DC exports to the EEC, the products covered by the CAP represent only 22 %.
This initial finding makes it possible to establish the scale of the problem
posed and the impact of the protection resulting from the application of the
CAP rules : the DCs export relatively less CAP products to the EEC than
to the world as a whole.
(1) These data cover almost 90 %of the DCs' agricultural exports worldwide
(excluding fischery and forestry products) and 80 %of DC exports to the
EEC.
b) Nevetheless, this first analysis cannot present the problems with a
sufficient degree of precision. For some of the CAP products exported by
certain DCs (e.g. cereals from Argentina), the DCs as a whole are net
importers. For these products, total DC supply is insufficient to satisfy
total demand.
For most products, a clear distinction can be drawn between the products
which the DCs export and those which they import. To start with there are few
borderline cases(those which move from deficit to surplus from one year to the next) and in addition the cover rate of the trade balance for most of
the products exported is greater than the cover rate of the DCs' total
agricultural trade balance (which currently stands at 1.25). This means
(1)
that for these products the DCs have a "reveaLed comparative advantage" in the context of agricultural trade. This is not therefore an absolute
advantage which would induce the DCs to monopolize the cultivation of these
products and restrict themselves to them. It is however a comparative
advantage which merely indicates that relative to other crops the DCs are better Cor less badly) placed for the products for which they have this
revealed comparative advantage. If we therefore take the products for which
the DCs have a revealed comparative advantage, i.e. of which they are net
exporters, it is seen that these products account for 21 %of their total
agricultural exports and 17 %of their exports to the Community.
(1) This concept is based on that established by B. Balassa (Trade
liberali-sation and revealed comparative advantage, Manchester School of Economic
and Social Studies, May 1965). For the purposes of this study, the Des
have a revealed co~ar&ive advantage for those products for which they are net exporters.
Comparing these two percentage figures, it can be seen that the
difference between these countries' situation vis-a-vis the EEC
and their situation vis-a-vis the rest of the world is not such as
to justify sweeping accusations with regard to the CAP's Level of protection
as it affects the DCs.
c) In order to assess the effect of the arrangements applied to the DCs as a whole, it is worthwhile comparing the structure of the EEC's
imports from the DCs with the structure of the EEC's total agricultural imports. Of the EEC's total agricultural imports almost 40 % consist of
products covered by the CAP. The difference between this figure and the
corresponding figure for the DCs (22%) is due to the fact that the other
suppliers (mainly from the temperate zones) tend to produce products for which the DCs have no revealed comparative advantage and which are in
direct competition with the EEC's agricultural production. It is true,
however, that even for the products for which the DCs have this comparative
advantage the corresponding figures are 18 % for all exports to the EEC
and 17 % for exports from the DCs (Table 16).
d) A more detailed analysis reveals that the agricultural products
subject to the rules of the CAP which the DCs export to the EEC are
products such as sugar, beef and olive oil (products covered by the special
preferences granted by the EEC to its overseas partners), tobacco {a product
covered by the GSP) and fruit and veg;etables (products covered by tariff
reduction arrangements often accompanied by seasonal restrictions.
It should also be noted that for these products the DCs' share of the
Community market has grown continuously, both in the period 1963-1972 and in the EUR-9 period.
In 1979, 91 % of the EEC's sugar imports came from the DCs compared with 84 % in 1973 (1)
Likewise, the DCs' share of Community beef imports increased from 36 % in 1963 to 56 % in 1972 (EUR-6) and then from 59 % in 1973 to 60 % in 1979.
As regards olive oil, the European and North/African countries around the
Mediterraean share the EEC market. Leaving aside the marked annual fluctuations, the DCs' share of imports is approximately 45 % compared with 55 %for the European countries (mainly Spain).
(1) In the period 1963-1972, the DCs' share of EEC sugar imports increased, in round figures, from 60 % to 80 %.
For both tobacco and fruit and vegetables, the DCs are the EEC's largest
suppliers. In 1979 they accounted for 65 %of extra-EEC imports (50% by value)
of fruit and vegetables and 56 % (50 % by value) of extra~EEC tobacco imports (Table·20).
An analysis of the import arrangements under which these products enter the
EEC shows that EEC imports of CAP products from the DCs are the result of
special measures adopted in favour of the DCs rather than of the application
<erga omnes) of the CAP rules. This reflects the EEC's policy of stimulating the DCs' agricultural exports while operating on a selective basis so as not
to endanger the achievements of the CAP.
1.2.2. The EEC's exports
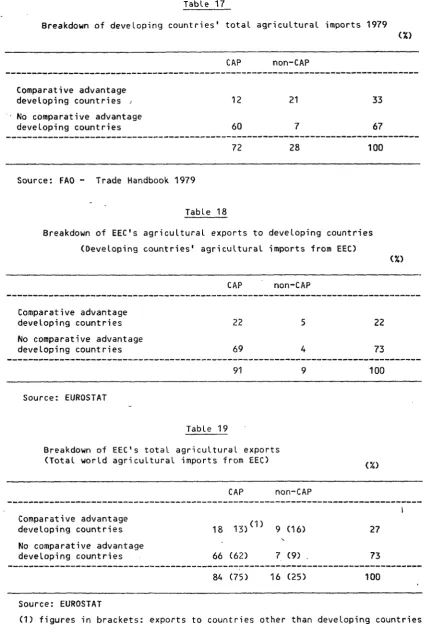
a) As might be expected, 90 % of the EEC's agricultural exports to the DCs
consists of CAP products. For the vast majority of these products, 80 % of
total agricultural exports), the DCs have no revealed comparative advantage
<Table 18). There therefore exists· a wide measure of complementarity between the EEC's exports and the DCs' imports. Basically, two groups of products
are involved : milk and mi~products (milk, butter, cheese) and cereals <Table 21).
For cereals, the EEC occupies a relatively minor position on the world market,
which is dominated by the North American exporters. The EEC's share of world
exports fluctuates around the 5 % mark.
On the milk and milk products market, in contrast, the EEC occupies a
dominant position, which has, moreover, become even stronger over the years
its market share for milk powder, for example, went from 66% in 1963 to 28 % in 1972 (EUR-6) and from 43 % in 1973 to 72 % in 1979 (EUR-9).
b) There is, however, an area of competition involving approximately 22 % of Community exports to the DCs. That competition is in respect of
agricultural products for which the DCs have a revealed comparative advantage
and which the EEC exports under the CAP machinery. This means therefore that for
a little over one-fifth of its exports, the Community is actually in
competi-tion with the products of the DCs on their own markets.
The same type of competition operates on the markets of the other developed
countries. It is interesting to note that on those markets only three-quarters
of the EEC's exports are of CAP products (compared with nine-tenths for exports
to the DCs). If the analysis is restricted to the products subject to the CAP for which the DCs have a revealed comparative advantage, the pourcentage
is much lower : those products account for 13 % of the exports to other
developed countries' markets and 22 % of the exports to DC markets (Table 19).
A more detailed analysis reveals that certain types of meat and sugar are
the products mainly involved here.
c) The proportion of the world sugar market held by EEC exports is increasing
all the time. From 4 % in 1963 the figure increased to 7 % in 1972. Between 1973 to 1979 that share doubled from 8 % to 16 % (EUR-9). Almost 80 %
( 1 ) of the EEC's sugar exports go to the DCs.
(1) It should be noted that the EEC imports raw sugar from the DCs and
exports refined sugar back to them.
The EEC share of world beef and veal exports is relatively Low but has been expanding rapidly, increasing from 3 % in 1973 to over 7 % in 1979.
Since 1979-80, the EEC has recorded a surplus on its beef and veal trade.
For preserved meat, however, the EEC share of the world market fell from
38 % in 1973 to 27 % in 1979, having stagnated around the 19 % mark in
the period 1963-72.
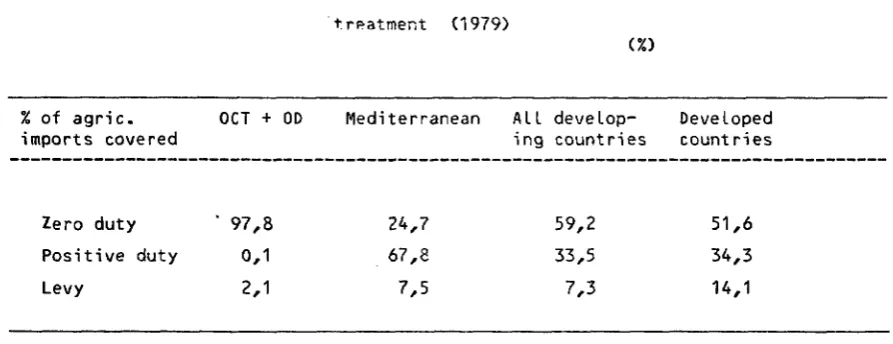
1.2.3. Tariff arrangements
Some interesting information can be gleaned from an analysis of the tariff arrangements applied to agricultural imports from the Des. Almost 60 %
of the agricultural imports from the DCs enter duty-free {CCT or preferential
arrangements), one-third enter sUbjectto duty and only 7% are subject to
levies. As might be expected the arrangements are more advantageous for the ACP countries, with which the EEC maintains special arrangements, than for
the other DCs : almost 98 %of agricultural imports from the ACP enter
duty-free, the imports subject to duty are negligible and 2 % are subject to levies. In contrast, a higher percentage of the imports from the MMI
countries are subject to duty (Table 22).
The main products subject to Levy which enter the Community from the DCs
are cereals, sugar, beef and veal and rice.
The agricultural products from the DCs (other than ACP and MMI) subject to a
duty benefit from the tariff reductions offered under the GSP or in the context of the Tokyo Round (tropical products offer and agricultural offer)
representing a total value of almost 4 000 million ECU •
2. The developing countries' production of andtrade in agricultural products
2.1. Trend of the developing countries' agriculrural trade in volume terms( 1)
The above trade analysis was carried out at current prices. In order to be
able to examine the trend of supply and demand with regard to agricultural
products in the DCs, it is necessary to convert the trade data from value
into volume terms (i.e. to express the data in constant prices). The reference date chosen is 1975.
a) Over the period 1960-77, the DCs' total exports increased by almost
10 % per annum on average. During the same period, the export price index for the DCs' agricultural products increased at the fairly rapid rate of
8.2 % per annum on average. In volume terms, the rate of increase in the DCs' exports of agricultural products was therefore 1.7 %, whereas the rate
of expansion in the volume of world trade in agricultural products was twice as rapid (3.8 %per annum).
During the period 1973-77, the rate of increase in the DCs' imports was
over 11.3 %. During the same period, the unit value of their imports
increased at an average rate of 6 % per annum. A large part of the increase in the DCs' imports during the period can therefore be attributed to an
increase in the volume of imports (5.3 %). In the same period, the rate of increase in the volume of world agricultural imports averaged 3.8 % per annum.
(1) The figures given in the text have been calculated on the basis of the
FAO statistics (particularly the trade yearbooks) •
b) The trend in the unit values of the DCs' exports and imports makes it
possible to calculate the trend in their terms of agricultural trade. Over
the whole period <1960-77) there was an improvement in the DCs' terms of
agricultural trade averaging 1.7% per annum. Two sub-periods should be
distinguished however :
- in the period 1960-74 - leaving aside annual fluctuations the terms
of agricultural trade remained more or less constant with a slight deterioration for the DCs;
- during the second period (1974-77), the DCs' terms of trade improved quite
appreciably due to a large extent to an increase in the export prices for
a number of products of great importance for the DCs, such as coffee and
cocoa.
c) The results of the analysis of agricultural trade in volume terms
confirm the findings of the analysis of trade in value terms and make
it possible to pinpoint the components of the trend. Althou~h the
DCs' performance in trade in agricultural products has been deteriorating
since the early sixties, this is not because the terms of agricultural
trade were moving against them. The deep-seated cause of the reduction in their share of world agricultural exports (noted in paragraph 1.1.),
and the reason for their increasing share of world imports, is the weak
growth rate in the volume of their exports and the high rate of increase
in the volume of their imports.
2.2. Trend of supply and demand with regard to agricultural products in
h d l . . <1)
t e eve op1ng countr1es
a) For most DCs, exports and imports of agricultural products account for
only a limited proportion of domestic production and consumption. Furthermore,
since external trade is frequently a way of disposing of surpluses and offsetting the deficits existing on the national market, it is impossible
to analyse the trend of the DCs'agricultural trade without linking this to the trend of internal supply and demand with regard to agricultural products in
the DCs.
b) On average, the rate of expansion in agricultural p~oduction in the DCs was at a higher Level than that of the developed countries. Nevertheless, the average annual rate of increase of 2.6 % for the period 1961-76 is barely higher than the rate of population increase <2.5 %). It is clearly pointless
to attempt at this Level of detail to give a satisfactory explanation for this
insufficient rate of increase.
c) On the dema·nd side, it can be seen that the rate of expansion in consumption averaged 3 % per annum, thereby exceeding the rate of increase in production. This increase can be explained by the population increase and also by the improvement in the standard of Living of certain categories
of the population.
Moreover, despite the Low Level of development of many DCs and the persisting
situation of malnutrition, the income elasticity of demand for agricultural products on a per capita basis is on average fairly Low (0.2 %). This can
only be explained by the existence of marked inter- en intra-De income
.!.
{1) The figures in this section have been calculated from statistics compiled
inequalities. In reality, if there were a better income distribution, it is probable that demand would increase more rapidly since such a redistribution
would stimulate the demand from the poorest sections of the population whose
income elasticity is without any doubt greater than the average figure given
above.
d) The effect of the DCs' internal supply and demand trends on their
trade in agricultural products is twofold :
-the DCs' supplies available for export expanded at a slower rate than agricultural production;
- imports had to increase at a faster rate to offset an increased deficit.
This explains the low rate of increase in the volume of the DCs' exports (1.7 %) and the reduction in their share of world exports, as well as
the rapid growth in imports (5.3 %) and the increase in their share of world imports.
e) A geographical breakdown of global growth rates in production and
consumption confirms these findings.
In all regions, with the exception of the Far East, consumption increased
at a more rapid rate than production. This difference is greatest for
Africa and the Middle East, where consumption increased at a rate
respecti-vely 1.5 and 1.3 times faster than production. This explains the rapid growth in their imports and the decline (or slow growth) in their exports
(Table 17>.
The fairly considerable concentration of EEC exports in these regions
(65 % of the EEC's agricultural exports in 1963), where imports are
increasing faster than in the DCs on average, explains in part the strengthening
of the EEC's position as an exporter of agricultural products to the DCs •
2.3. Supply and demand with regard to the main products
Demand and supply have not followed similar trends in the case of all
these products.
a) The drop in the self-supply rate has been greatest for cereals. For
all the DCs this rate fell from 96 % at the beginning of the sixties to 91 %
towards the end of the seventies and this has given rise to a worsening of
the net deficit (1) , which increased from 10 million t in 1963 to 64
million t in 1980. In absolute terms, the increase in imports has been greatest for wheat (the deficit of which increased from 14 million t in
1963 to 50 million t in 1980) but in terms of the rate of increase the
dete-rioration has been greatest for coar~grains : the DCs' surplus of coarze grains (still at 4 million t in 1963), which survived until the mid-seventies,
has recently been transformed into a net deficit, amounting in 1980 to
18 million t (i.e. a self-supply rate of 93 %). This trend can be explained
in part by a slowing-down in the increase in production and in part by the
increasing use in the richest Des of coarze grairn as animal feed.
For rice, relatively little of which is marketed internationally, the
DCs' fairly modest net deficit (0.5 million t in 1963) has become progressively worse and currently amounts to 2.5 million t (2), but the self-supply rate
has remained constant (almost 100 %).
b) As regards meat, despite a very marked increase in their production
(averaging 6 % per annum in the decade from 1970), the DCs, which were
net exporters overall in the early seventies (self-supply rate of 10% in 1973)
became net importers towards the end of the decade <self-supply rate of 99% in 1980).
(1) Gross figure of almost 100 million t in 1980
(2) Gross figure of almost 10 million t in 1980.
The result has been a marked expansion in imports of the various types
of meat : sheepmeat (average increase of 15 % per annum in the seventies), beef (19 %) and poultrymeat (22 %).
Following an increase in the early seventies,the DCs' exports of beef began
to fall in the second half of the seventies; the DCs' trade balance for
beef is therefore in danger of running into deficit in the next few years.
Their exports of poultrymeat have expanded very rapidly (40 % per annum on average between 1973 and 1980) but not enough to avoid a worsening in the trade balance for poultrymeat in absolute terms.
c) For sugar, both the DCs' production and consumption has shown a modest increase. Net exports have remained more or less unchanged at around 20 % of production.
d) In the DCs as a whole, the production of oils and fats and of oilcake
and oilseed meal has increased at a fairly rapid rate (5% and 7% respectively
per annum on average during the seventies). Nevertheless, the consumption of
these products has incrased even more rapidly (6.5 % and 8 % respectively)
with the result that the trade balance for oils and fats, which showed a
surplus in the early seventies, now shows a slight deficit. The DCs' trade
balance for oilcake and oilseed meal is still in surplus.
During the seventies, the DCs' exports of oilseeds were stagnant, resulting
in a drop in the DCs' share of world exports. This is due, first and
foremost, to the development of local processing of the seeds in the DCs and secondly to the rapid expansion of American exports soya) (1)
(1) It should be noted that Brazil has also considerably increased its
soya exports.