Morphology and Growth of Methyl Stearate as a Function of
Crystallization Environment
Diana M. Camacho,
†Kevin J. Roberts,
*
,†Frans Muller,
†Danielle Thomas,
†Iain More,
‡and Ken Lewtas
‡,#†Institute of Particle Science and Engineering, School of Chemical and Process Engineering, University of Leeds, Leeds, LS2 9JT,
United Kingdom
‡Infineum UK Ltd, Milton Hill Business and Technology Centre, Abingdon, OX13 6BB, United Kingdom
*
S Supporting InformationABSTRACT: In situ studies of methyl stearate growing from supersaturated n-dodecane, kerosene, and toluene solutions reveal strong evidence that solvent choice influences the crystal morphology and crystal growth kinetics. Crystals with similar habit are observed in all solvents, with the exception of lower supersaturations in kerosene, where a less symmetric morphology was observed. BFDH analysis based on the monoclinicC2 crystal structure of methyl stearate yielded the morphological indexation to be (110), (1−10), (−110), and (−1−10) for the dominant observed habit and (110) (1−10) (−1−10) (−240) (−3−10) for the less symmetric habit observed in kerosene solvent. Measurements of the growth
rate for the (110) and (1−10) faces are similar for all solutions ranging from 0.02 to 1.13μm/s, for significantly lower values of supersaturation in the case of toluene. The tendency of the growth rate dependence on σ was consistent with the Burton-Cabrera-Frank (BCF) growth mechanism inn-dodecane, the Birth and Spread (B&S) mechanism in kerosene and diffusion controlled in toluene solvent.
1. INTRODUCTION
Wax formation in diesel and biodiesel fuels at low temperatures is one of the major problems faced by the fuels industry as crystallization of the saturated compounds present in these solutions can plug upfilters and obstruct pipelines. Preventing wax formation in these multicomponent mixtures requires a good understanding of the crystallization behavior of saturated compounds such as fatty acid methyl esters (FAMEs) present in biodiesel fuel. Notably, growth kinetics and morphological studies can provide the basis to develop adequate technology, such as additives, that can modify the crystalśhabit to allow for the fuel’s adequateflow and settlement properties.
Relevant progress has been made in this area1including: the use of molecular dynamics (MD) to study crystal nucleation and growth2,3 and the prediction of crystal’s growth from the assessment of the solid/solution interface molecular structure.4,5 The prediction of the crystal’s habit, using the extended interface structural analysis (EISA) shows that interfacial molecular events can be efficiently incorporated to assess crystal growth and morphology when cosolvents, impurities, and additives are used.6Similarly, molecularly based simulations have been used to control and predict the crystal shapes of organic compounds based on energetic and crystal structure features, e.g., the control of AmB crystal shapes using tailor-made additives;7the effect of hydroxyl-propyl methylcellulose (HPMC) concentration and solvent on the crystal habit of Nifedipine (Nif);8the prediction of the shape of para-amino benzoic acid (PABA) crystals,9 and 6-methyl-2-thiouracil.10 Methodologies for the study of face specific growth kinetics include novel techniques such as the use of a growth cell coupled with phase contrast microscopy11,12and stereovision imaging to analyze the effect of solutionflow on crystal growth.13The publication by Van Driessche A.E.S. et.al.14 provides a thorough review of measuring techniques for the study of crystal growth kinetics.
[image:1.625.64.299.647.759.2]Received: September 28, 2016 Revised: November 22, 2016 Published: December 6, 2016
Table 1. Composition of Kerosene from 2D Gas Chromatography Analysis Performed by Infineum UK
hydrocarbon mass %
paraffins n-alkanes 16.29
iso-paraffins 23.04
cycloalkanes naphthenes 42.40
aromatics alkyl benzenes 7.60
benzocycloparaffins 6.80
naphthalenes 3.43
biphenyls/acenaphthenes 0.30
fluorenes 0.15
Article
pubs.acs.org/crystal
Despite the developments in this area, thus far there have been no relevant fundamental studies for crystallization of saturated methyl esters, such as methyl palmitate and stearate, due to the complex nature of crystallization of these materials. Morpho-logical and growth kinetic studies in saturated methyl esters are scarce, not only due to the difficulty of obtaining reliable crystallographic information for these compounds, but also due to the difficulty of growing observable faceted crystals.
Limited structural information, obtained through powder X-ray diffraction on methyl stearate, suggests this compound crystallizes in two polymorphic forms: monoclinic and ortho-rhombic. The unit cell parameters of the stable monoclinic15 form are thought to bea= 5.61 Å,b= 7.33 Å,C= 106.6 Å,β= 116.47°with crystal space group A2/a. Similarly the unit cell parameters of the orthorhombic16form area= 5.61 Å,b= 7.35 Å,
C = 95.15 Å with crystal space group Pnab. Observations of methyl stearate crystals have shown that this compound crystallizes in a plate-like morphology in which the expected dominant (001) face is believed to grow via a screw dislocation mechanism because of spiral growth on this face.17
Given the lack of studies on the crystallization of saturated methyl esters, it is the aim of this study to deliver fundamental information on the morphology and crystal growth kinetics of methyl stearate as a function of solution environment. These findings are complemented and cross-correlated insection 3.3
with unpublished results,29 where a fundamental analysis of methyl stearate nucleation was carried out.
2. MATERIALS AND METHODS
2.1. Materials.The solute methyl stearate and solventsn-dodecane and toluene were purchased from Sigma-Aldrich. The purity of the methyl stearate used was 96% and that of the two solvents was higher than 99%. No further purification was carried out. Kerosene was supplied by Infineum Ltd. Its hydrocarbon composition andn-alkanes chain length distribution is summarized in Table 1. and Figure 1 respectively.
[image:2.625.155.468.65.280.2] [image:2.625.332.558.304.505.2]2.2. Equipment and Experimental Procedure. In situ crystal growth studies were carried out using an experimental setup com-prising an optical microscope (Olympus BX51), operated in differential Figure 1.Kerosenen-alkane mass fraction distribution as obtained by 2D Gas Chromatography analysis performed by Infineum UK.
Figure 2.Experimental setup for crystal growth rates measurements, after ref11. (a) Olympus BX51 optical DIC microscope integrated with QImaging/QICAM camera. (b) Enlarged picture of the crystal growth
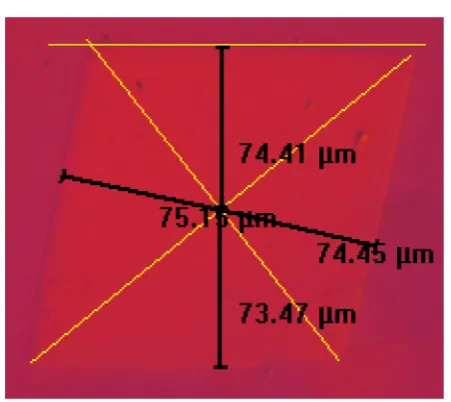
cell. Figure 3.Example of measurement of normal distances from the center
[image:2.625.59.310.306.475.2]interference contrast (DIC) mode, which was integrated with a QImaging/QICAM camera which captured crystal images as a function of time. The images were then analyzed using the QCapture Pro software. The associated growth cell comprising a simple temperature-controlled rectangular tank (10×12 cm, depth 1.5 cm) sealed with two removable rectangular glass plates. The solution was secured within a 0.5 mL sealed UV glass cuvette with a path length of 1 mm which was placed within the cell as close to the objective lens of the microscope as feasible. The temperature within the cell is controlled using a Huber Ministat 125 circulating water bath that circulates water through the growth cell. The overall system is shown inFigure 2.
Due the operational working temperature range of the growth cell used, different concentrated solutions were chosen for the analysis. In the case of the n-dodecane and kerosene systems, solutions with concentrations of 350 g/L of solvent were chosen. Likewise a solution with concentration of 538 g/L in the case of toluene was selected. This allowed for an operation temperature range above 10°C to avoid any condensation on the walls of the growth cell.
The supersaturation required for crystallization was created by reduc-ing the solution temperature from the equilibrium temperature (Te) to
different chosen temperatures within the metastable zone. Although the supersaturation is set by decreasing the solution temperature, circulating water through the cell, the growth of the crystals is only measured once the targeted temperature has been established. The supersaturation level at each temperature is calculated using expression1
σ= x −
xe 1 (1)
wherexis the solution concentration andxeis the molar fraction of the
solute in the solution at equilibrium, obtained from the van’t Hoff equation at the temperature of measurement.
The crystal morphology and subsequent growth of the observed crystals was followed by recording images at equal time-intervals, every 5−20 s depending of the speed of the crystal growth in each system. The growth rates of the individual faces (G) were obtained by following the increase with time of the normal distance from the center of the pro-jected two-dimensional (2D) crystal to the faces as shown inFigure 3. The crystal centers were defined by drawing lines that connected the crystal corners defined by the two most important observed faces. Ten to thirteen measurements of the normal distance increase were recorded. Due to the experimental challenges involved, notably due to these crystallization systems having a very small metastable zone width (MSZW), it was not feasible at this stage of experimental methodology and data acquisition to make a statistically significant number of mea-surements for these systems (only two growth meamea-surements were possible at each of the selected supersaturations). However, for a less challenging system such as ibuprofen,11 this has been assessed pre-viously where the standard deviation between measurements was found to be quite low. Similarly, the methodology has shown to be reproducible as it has been previously applied in the assessment of the growth kinetics of other organic molecules such as n-docosane12 and α-para-amino benzoic acid (PABA).9
2.3. Data Analysis. 2.3.1. Morphological Predictions. The morphological analysis was carried out making use of a methodology presented elsewhere.12This methodology relies on the iteratively pre-diction of the Bravais-Friedel-Donnay-Harker (BFDH) morphology using pairwise Miller indices and comparing these predictions with the micrographs obtained experimentally. A summary of this methodology is given in Figure 1 in theSupporting Information(SI) to this paper.
2.3.2. Crystal Growth Kinetics.Given the experimental method used to collect crystal growth rates, the measured growth rates are influenced not only by the incorporation of growth units into the crystal surface, but also by the diffusion of the growth units within the bulk of the solution. Thus, growth models that combine these two effects acting in series have been derived as part of this work.18This uses an analogy to a circuit as shown in Figure 2 of theSIdelivering specific kinetics models for the dependence of growth rate (G) on supersaturation as described by a power law,19the Birth and Spread (B&S) and Burton-Cabrera-Frank (BCF) models.20These models are given by expressions2,3, and4,
respectively. A value ofr= 1 in expression2corresponds to the case of rough interface growth (RIG).21 The complete derivation of these models is presented in section 3 of theSI.
σ = + σ ′ − ⎜ ⎟ ⎛ ⎝ ⎞⎠ G m s 1 k k 1 1 ( )
MT G r 1 (2)
σ = + σ ′ σ − ⎜ ⎟ ⎛ ⎝ ⎞⎠
( )
G m s 1 ( ) k k 1 1( ) exp
MT G 1/6 A1
[image:3.625.62.331.99.501.2](3)
Table 2. Parameters Used for the Collection of Crystals Micrographs for Methyl Stearate Crystallizing inn-Dodecane, Kerosene, and Toluene Solutions
C(methyl stearate) (g/L) MSZW (°C) temperature (°C) range supersaturation (σ) range
n-dodecane 350 4.3 (19.8−24.1) 20.2 to 21.0 0.30 to 0.39
kerosene 350 4.3 (17.7−22.0) 17.8 to 18.3 0.45 to 0.52
toluene 538 4.3 (10.2−14.5) 13.5 to 13.9 0.04 to 0.08
σ = + σ ′ σ ⎜ ⎟ ⎛ ⎝ ⎞⎠
( )
G m s 1 ( ) k k 1 1 ( )tanhMT G A2 (4)
whereσis the solution’s relative supersaturation,kGis the growth rate
constant,ris the growth exponent in the RIG interface growth kinetic
model, andA1andA2are thermodynamic parameters in the B&S and BCF interface growth kinetic models, respectively.k′MTis related the
coefficient of mass transfer within the bulk of the solution,kMTthrough
expression5 ρ ′ ⎜⎛ ⎟= ⎝ ⎞⎠ k m s
k C MW
MT
MT e s
s (5)
In this expressionρsis the solute density,MWsthe solute molecular
weight, andCethe equilibrium concentration (solubility).
3. RESULTS AND DISCUSSION
3.1. Morphological Observations as a Function of Solution Environment and Crystal Indexing. Using the setup for the measurements of crystal growth rates, images of C18:0 crystals growing from three solvents were obtained. Depending on the initial assessment of the solution behavior, different ranges of supersaturations within the MSZW were chosen for this analysis. In the case ofn-dodecane solutions, growth was difficult to observe above 21°C (σ< 0.3) and would occur too fast to be recorded below 20.2°C (σ> 0.39). Similarly for kerosene Table 3. List of the Predicted Zone Axis Defining the Different Zone Groups, Representative (hkl) Planes anddhklSpacing within Each Group
Orthorhombic (Pnab)
group zone axis [uvw] representative plane (hkl) interplanar distancedhkl
1 [100] (011) 7.33
(020) 3.68
(031) 2.45
(042) 1.84
(064) 1.22
2 [1−10] (111) 4.46
(220) 2.23
(331) 1.49
3 [2−10] (120) 3.08
4 [3−10] (131) 2.25
(260) 1.12
5 [0−10] (200) 2.81
(602) 0.94
6 [1−20] (211) 2.62
(420) 1.31
7 [3−20] (231) 1.85
(460) 0.92
8 [1−30] (311) 1.81
(620) 0.91
9 [2−30] (320) 1.67
MonoclinicA2/a
group zone axis [uvw] representative plane (hkl) interplanar distancedhkl
1 [100] (011) 7.31
(020) 3.67
(031) 2.44
(042) 1.83
(064) 1.22
2 [1−10] (111) 4.07
(220) 2.07
(331) 1.37
(442) 1.03
(664) 0.68
3 [2−10] (120) 2.96
(242) 1.47
4 [3−10] (131) 2.19
(260) 1.10
5 [0−10] (200) 2.50
MonoclinicA2/a
group zone axis [uvw] representative plane (hkl) interplanar distancedhkl
(402) 1.24
(602) 0.83
6 [1−20] (211) 2.34
(420) 1.18
7 [3−20] (231) 1.74
(460) 0.87
8 [1−30] (311) 1.62
(620) 0.81
9 [2−30] (320) 1.52
(642) 0.75
MonoclinicC2
group zone axis [uvw] representative plane (hkl) interplanar distancedhkl
1 [100] (020) 3.70
(062) 1.23
2 [−100] (0−20) 3.70
(0−62) 1.23
3 [1−10] (110) 4.14
(221) 2.03
(331) 1.36
4 [−1−10] (1−10) 4.14
(2−21) 2.03
(3−31) 1.36
5 [3−10] (130) 2.21
6 [−3−10] (1−30) 2.21
7 [0−10] (200) 2.50
(602) 0.82
8 [2−10] (240) 1.49
9 [−2−10] (2−40) 1.49
10 [1−30] (310) 1.63
11 [-1−30] (3−10) 1.63
12 [1−20] (420) 1.18
13 [−1−20] (4−20) 1.18
14 [3−20] (460) 0.88
15 [−3−20] (4−60) 0.88
16 [2−30] (640) 0.76
[image:4.625.65.566.92.685.2]17 [−2−30] (6−40) 0.76
solutions growth was difficult to observe above 18.3 °C (σ < 0.45) and would occur too fast below 17.8°C (σ> 0.52). For toluene systems the growth would occur very fast even at temperatures close to the solubility line and therefore the range of assessed supersaturations was limited. A summary of the width of the metastable zone at the corresponding solution concen-tration, together with the parameters used during the growth measurements for each system, is presented inTable 2.
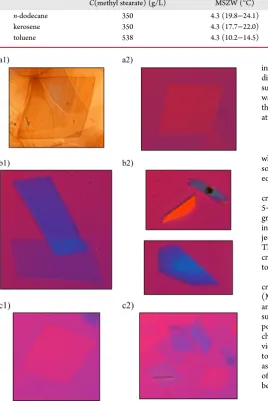
Selected micrographs of the crystals observed in the range of supersaturations studied for the three solvents are shown in
Figure 4.
In general the crystals observed in all cases were very thin plate-like crystals. The assessment of C18:0 crystal morphology reveals that the crystal habit does not change with solvent except for the crystal habits observed in kerosene at the lowest super-saturations (σ). Although the habit observed at higher super-saturation in kerosene solutions is more elongated when compared to those obtained in the other two solvents, the internal angles of the observed crystals are equal in all cases. The lozenge shape of these crystals could suggest that their morphology is based on an orthorhombic crystal system where crystals are bounded by ⟨110⟩ planes and the (001) plane. Lozenge crystals have previously been observed in methyl stearate and palmitate22or in crystals of similar molecules such as long-chain n-alkanes and stearic acid.17,23,24 The morphology observed at the lowest supersaturations in kerosene solutions, however, indicates that in this case, for certain levels of super-saturations (σ< 0.45), these crystals develop a habit more con-sistent with a less symmetrical crystal system.
The prediction of the morphology for C18:0 crystals was carried out following the procedure presented in Figure 1 of the
SI, using three different crystal structures that have been suggested for methyl stearate. The first two crystal structures correspond to monoclinic15and orthorhombic16crystal systems with space groupA2/aandPnabrespectively and the third one to the monoclinic crystal system with space groupC2. In the latter the unit cell parameters area= 5.60 Å,b= 7.39 Å,c= 47.96 Å, and
β= 91.15°(I. More/Infineum UK, personal communication, July 25, 2014).
BFDH analysis revealed 49, 81, and 147 habit planes for orthorhombic, monoclinic (A2/a), and monoclinic (C2) crystal systems, respectively. The expected (001) plane is obtained in all predictions for the indexation of the larger crystals face perpendicular to the c axes. According to the methodology (Figure 1 SI), all other resulting indices were arranged by grouping the lattice planes into 9 zones for thefirst two crystal systems and into 17 zones for the latter. These groups with their corresponding zone axes indexation, including the complete set of planes delivered by the BFDH prediction are given in section 2 of theSI.Table 3shows a summary of this information featuring some representative planes and correspondingdspacing within each group.
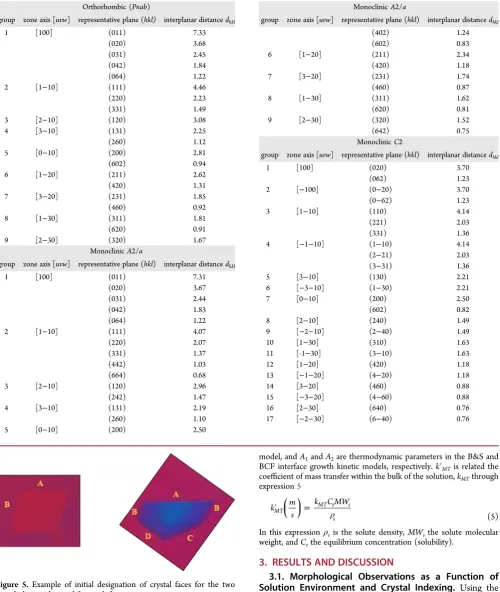
The interplanar angle correlation for the plane pairs was
carried out using the annotation in Figure 5 both for the
morphology observed at the lowest supersaturation in kerosene and for the dominant morphology observed in all solvents.
As for the case of orthorhombicPnaband monoclinicA2/a
crystal systems, the list of Miller indices obtained belong to the same zone axes groups, and thus a single analysis was carried out. This delivered only two pairs of Miller indices matching AB interplanar angles (111) and (1−11) or (011) and (311). How-ever, due to the geometry of the space group the prediction for the pairwise (111) (1−11) is the only one delivering the expected crystal lozenge shape. The same analysis using the monoclinicC2 crystal system delivered similar results with the pairs (110) and (1−10) or (240) and (2−40) matching the internal angle between A and B. This information is presented inTable 4.
[image:5.625.79.567.96.235.2]In the case of the indexation for the morphology observed at the lowest supersaturation of kerosene solutions, the set of matches for the pairs of Miller indices of the remaining inter-planar angles between BC/CD and BD faces are summarized also inTable 4. Miller indices for the BC and CD faces are pre-sented within the same column as the interplanar angles between these pairs of faces are coincidental.
Table 4. Likely Combinations of Miller Indices for the Four Faces of the Experimental Crystals Observed at the Lowest Supersaturationσ< 0.45 in Kerosene Solventa
AB BC or CD BD
Orthorhombic and monoclinicA2/a (111) (1−11) (011)-(111) (011)-(211)
(011) (311) (120)-(200)
(131)-(311) (200)-(231)
MonoclinicC2 (110) (1−10) (020)-(1−30) (110)-(4−60)
(240) (2−40) (110)-(3−10) (240)-(3−10)
(110)-(4−20) (310)-(4−60)
(110)-(6−40) (130)-(1−30) (420)-(6−40)
[image:5.625.152.463.271.327.2]aPlanes designated according toFigure 5.
Table 5. Potential Unique Solutions of the Methyl Stearate Crystals Morphology Observed at the Lowest Supersaturationσ< 0.45 in Kerosene Solventa
Within the morphology delivered by the orthorhombic/ monoclinicA2/acrystal systems there is only a pair of Miller indices that match the interplanar angles between BD faces, and
[image:6.625.108.503.86.669.2]one pair for AB faces, that also satisfies the faces present in the dominant lozenge shape morphology. This facilitates obtaining the solution for the entire morphology after cross-checking with
the indices allocated for BC/CD pairs. If AB faces are allocated the pair (111) (1−11) and BD faces the pair (011) (211) then the solution for BC/CD pairs should contain either the Miller
indices (011) or (211) together with either the (111) or (1−11) indices. The only pair that satisfies this condition is (011) (111). Therefore, the solution for the entire morphology is given by the indices (111) (1−11) (011) (211). Further modification of the perpendicular distance from the center of the crystal to the faces, produce the morphology prediction with lengths proportional to those observed experimentally.
Among the Miller indices pairs delivered by the prediction using the monoclinicC2 crystal system, only three of these pairs matched BD face interplanar angles and two pairs matched those angles between AB faces. Using the same principle as in the previous analysis, if AB pairs are given by the (110) (1−10) indices, then three options would be available for BC/CD faces as they have to contain either the (110) or (1−10) indices: (110) (3−10), (110) (4−20), and (110) (6−40) and two pairs would likely satisfy BD faces (110) (4−60) and (240) (3−10). This is so because by cross-checking, these pairs share either of their two indices. Similarly, if AB pairs are given by (240) (2−40), then BD would be given by the pair (240) (3−10) and BC/CD faces would be likely indexed by the (110) (3−10) pair. A summary of the unique potential morphology solutions using these indices combinations is given inTable 5.
[image:7.625.63.302.105.349.2]After performing the morphological predictions using the combinations inTable 5, the analysis suggests the indexation (110) (1−10) (3−10) (240) for the morphology observed at the lowest supersaturations in kerosene. Further modification of the perpendicular distance from the center of the crystal to the faces, in the corresponding ciffile, produce the morphology prediction with lengths proportional to those observed experimentally. Table 6. Mean Growth Rates of (110) and (1−10) Faces of
Methyl Stearate Crystals Growing inn-Dodecane, Kerosene, and Toluene
mean growth rateG(μm/s)
solvent σ no. crystals (110) (1−10)
n-dodecane 0.39 2 1.13 1.05
0.38 2 0.66 0.70
0.37 2 0.64 0.63
0.36 2 0.34 0.34
0.34 2 0.31 0.34
0.33 2 0.25 0.26
0.32 2 0.14 0.14
0.31 2 0.13 0.14
0.30 2 0.09 0.11
kerosene 0.52 2 0.15 0.35
0.50 2 0.11 0.25
0.49 2 0.12 0.27
0.48 2 0.08 0.15
0.46 2 0.07 0.14
0.45 2 0.02 0.01
toluene 0.08 2 0.37 0.34
0.06 2 0.27 0.27
0.05 2 0.16 0.17
0.04 2 0.02 0.03
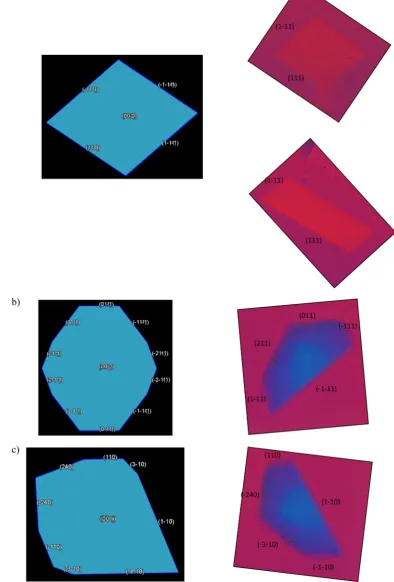
[image:7.625.69.561.397.722.2]Figure 6 compares the most likely morphology prediction, using either the orthorhombic/monoclinicA2/aor monoclinic
C2 unit cell parameters, with a micrograph taken from a selected experimental crystal. The selected micrographs feature both the dominant morphology observed in all solvents and that observed at the lowest supersaturations in kerosene systems. In the case of thefinal chosen morphology using the monoclinic crystal system with space groupA2/a, the occasional face (011) is predicted for the habit observed at lower supersaturation in kerosene. This is in agreement with the morphology of the B monoclinic polymorph reported for stearic acid crystals.24−26
Given the asymmetrical nature of the crystals’morphology observed at the lowest superaturations in kerosene, the mor-phology predicted by the monoclinic crystal systemC2seems to deliver the best match to those crystals observed experimentally. Thus, the final chosen indexation is (110) (1−10) (−1−10) (−240) (−3−10).
3.2. Mean Growth Rates and Growth Rate Mechanism of the (110) and (1−10) Faces of Methyl Stearate Crystals As a Function of Growth Environment. A sequence of images of methyl stearate crystals in a 0.5 mL cuvette cry-stallization cell in three different solvents is shown in section 4 of theSI. The mean growth rates of the (110) and (1−10) faces of single crystals of methyl stearate growing in n-dodecane, kerosene, and toluene are presented inTable 6.
Up to now no information has been reported in the literature on the growth and morphology of methyl ester crystals. How-ever, the growth rates of stearic acid crystals growing from different solvent systems have been studied.24−26 The values
reported for the (110) face of these crystals are within the same order of magnitude as those obtained in this work (Table 6).
In general growth occurs faster for crystals growing from toluene. In this case growth rates are within the same order of magnitude as those observed in the other two solvents but take place at supersaturations which are a much lower order of magnitude, e.g., 0.04 <σ< 0.08 for toluene compared to 0.30 <σ < 0.39 forn-dodecane.
Using the indices predicted for the monoclinic C2 crystal system the crystal faces were identified for the asymmetrical morphology produced for kerosene at lower supersaturation. These revealed the presence of the (−3−11) face, which grows at a rate of 0.16μm/s.
To assess the mechanistic regime of crystal growth the data collected for the (110) and (1−10) faces were fitted to the models described byeq 2to4. However, given that experimental
G(σ) observations showed there is a critical supersaturation (σcrit) below which growth does not proceed, this parameter was introduced within the models to account for its effect by subtracting it from the termσ.
Figures 7,8, and9show the bestfits of these models to the experimental data for both the (110) and (1−10) faces for
n-dodecane, kerosene, and toluene solvents, respectively. In addition to this, using the bulk and interface transfer coefficients obtained from the experimental datafitting, they also present the
trend of the total resistance to transfer of growth units
(
)
K 1
MTOT as
[image:8.625.65.567.67.385.2]a function of driving force. The driving force is defined as the difference between the actual solution’s concentration and the
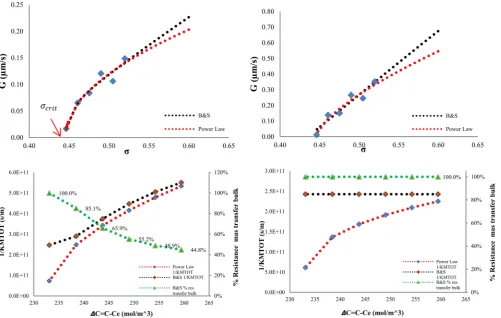
Figure 8.C18:0 growing from kerosene. For each set of four plots, aboveG(σ) experimental datafitted to the power law and B&S models; below: trend of the total resistance to mass transfer as a function ofΔCusing the parameters obtained from the datafitting to these models. The green line shows the trend of the ratio of the resistance to mass transfer in the bulk to the total mass transfer resistance using the parameters obtained from the B&S model
equilibrium concentration (solubility) (ΔC=C−Ce).K1
MTOT is
defined by the denominator of theG(σ) expressions given by the corresponding mechanistic model assessed.
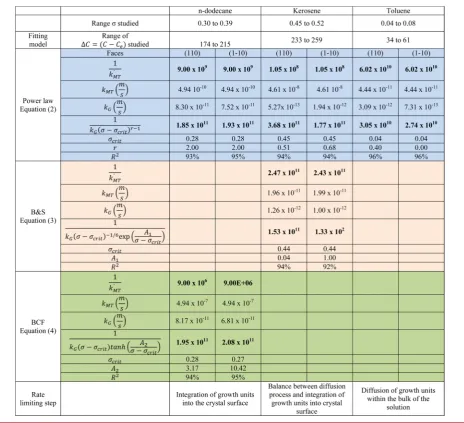
All relevant parameters obtained through this analysis are presented inTable 7. For comparative assessment, when more than one modelfitted well to the experimental data allfitting lines were drawn and the corresponding modeled parameters were also given. For illustration, although a more accurate assessment of the rate limiting step can be done throughFigures 7−9, an estimation of both the resistance to transfer within the bulk and that at the interface are given inTable 7using average values ofσ andCewithin the range of study.
Although the amount of experimental data collected is pro-bably not enough to accurately determine the values ofkMTand
kG, thefitting of the models presented to these data can none-theless deliver relevant mechanistic information.
While there is no direct visual evidence of the presence of screw dislocations for the (110) and (1−10) faces of C18:0 crystals, the best fittings to the experimental data for C18:0 growing fromn-dodecane solvent were obtained for the models given by both the power law and the BCF mechanism. Given that in the power law a value ofrequal to 2 is associated with the BCF mechanism, this strongly suggests that growth in this case proceeds via screw dislocations. Since a linear dependence of
K 1
MTOT
on ΔC is relevant to growth limited by bulk diffusion,
Figure 7 indicates that growth of C18:0 from n-dodecane is hindered by transfer of growth units at the crystal/solution
interface. In addition, the shape of the (ΔC)
K 1
MTOT lines is
coincident with that of the hyperbolic form given by the BCF mechanism but in opposite direction showing that as expected higher interfacial resistance would be placed at lower levels of driving force. The resistance to incorporation at the crystal/
solution interface
σ−σ σ−σ
⎛
⎝ ⎜ ⎜
⎞
⎠ ⎟ ⎟
(
)
k
1
( )tanh
G crit A
crit
2 ( )
(calculated using
average values ofσwithin the range of analysis) is significantly higher than the resistance to mass transfer within the bulk of the
solution
( )
′k 1
MT
(Table 7), this supporting surface integration as
the rate limiting step.
The bestfittings to the experimental data for C18:0 growing from kerosene solvent were obtained for the models given by both the power law and the B&S mechanism. However, since the fitting to the power law deliveredrvalues of 0.51 and 0.68, and a value of r equal to 0.83 could be associated with the B&S mechanism, the parameters obtained via thefitting to this model were taken for this analysis.Figure 8shows that if this is the case the resistance to mass transfer within the bulk would play a more important role on the face growth and would be rate limiting. This representing between 44.8% and 100% of the total resistance to transfer of growth units for the (110) face and 100% of the resistance for the whole range of σ studied for the (1−10) face. The differences in these proportions can be explained by the fact that the resistance to incorporation of
growth units at the interface σ−σ
σ σ −
−
⎛
⎝ ⎜ ⎜
⎞
⎠ ⎟ ⎟
(
)
k
1
( ) exp
G crit
A
crit
1/6 1 (calculated
[image:9.625.65.560.65.378.2]using average values ofσwithin the range of analysis) for the
(110) face is 9 orders of magnitude higher than that of the (1−10) face (Table 7). Considering that kG values are of the same order of magnitude, this significant difference is due to the value obtained for the parameterA1which is inversely related to the 2Dnuclei interfacial tension. Therefore, the more elongated habit of the crystals observed in this case is likely to be the result of differences between the molecular structures of the (110) and (1−10) faces in which the former would provide a less suitable surface for the formation of 2D nuclei, imposing a higher proportion of resistance to the face growth at the interface.
A fitting to the experimental data for C18:0 growing from toluene solvent was obtained only for the model given by the power law, and similarly to the case of growth in kerosene the resistance to mass transfer within the bulk is rate limiting. This
effect is shown inFigure 9where the proportion of
( )
′k 1
MT to the
total resistance to transfer
(
)
K 1
MTOT for both faces is above 50% all over the range of (σ) studied. Interestingly, this analysis delivered values ofrequal to 0.4 and 0 for the (110) and (1−10) faces respectively, which cannot be associated with any of the interface kinetic models given by expression (1) to (4) of the SI, this
indicating that growth from toluene would be entirely controlled by the diffusion of growth units toward the crystal.
A comparison between the values obtained for the resistance to mass transfer within the bulk, using the best modelfitting parameters, shows an interesting trend in which this resistance is 1 order of magnitude lower in toluene than in kerosene and 4 orders of magnitude lower inn-dodecane than in toluene. This result is likely to be due to the aromatic nature of toluene and the presence of both aromatic and cyclo-alkyl compounds in ker-osene that would provide stronger solute−solvent interactions due to the more polar nature of solvent molecules. This condi-tion would make difficult the desolvation process and decrease the rate of transfer of the solute molecules.
[image:10.625.82.547.90.513.2]The values obtained for the resistance to transfer at the inter-face are much more similar in magnitude, being only significantly lower for the (1−10) face of crystals growing from kerosene solvent, where their values are 8 and 9 orders of magnitude lower than those observed in the other solutions, likely due to very low resistance to the formation of 2Dnuclei. This resistance is 1 order of magnitude higher in n-dodecane than in toluene solvents which could only be the case if the faces of crystals growing from toluene provide sufficient and larger number of kink sites. Table 7. Crystal Growth Kinetics Parameters Obtained from the Best Fit of the Models Given fromeq 2to4to the Experimental
3.3. Combined Assessment of Methyl Stearate Crys-tallization as a Function of Solvent.Table 8 presents an overview of results together with those obtained from the assessment of nucleation in the same solutions’systems.29
If a comprehensive assessment is carried out drawing on the findings within each section of this paper together with those presented in ref29, it can be concluded that the crystallization process in toluene systems will deliver a lower number of crystals, with larger sizes in comparison to those crystals expected to be obtained from n-dodecane and kerosene solvents. This is consistent with lower nucleation rates and significantly higher crystal growth rates in this solution system. Thesefindings are supported by observation of the crystallization process under microscope in which fewer larger faceted crystals were observed
growing at such significant rate that their growth could only be recorded at very low supersaturationσbelow 8%. In this case the highest critical undercooling relates to the highest solubility (toluene) and presumably to the highest solution density, hence to the lowest solute diffusivity and mass transfer. Thus, given that diffusion of growth units in toluene is rate limiting, this suggests that the surface of methyl stearate crystals growing from this solvent would provide a more suitable structural environment, in which greater concentration of sites (kinks) available for molec-ular attachment could be expected.
[image:11.625.129.495.94.564.2]At the critical undercooling the number of crystals and nuclea-tion rates were found to be higher in kerosene as lowest inter-facial tensions (γ) were obtained in this case. If this is coupled with the fact that growth rates in these systems are around the Table 8. Summary of Parameters Obtained through the Combined Assessment of Solubility, Morphology and Nucleation and Crystal Growth Kinetics of Methyl Stearate in Three Different Solventsa
aYis the activity coefficient,ΔH
dissandΔSdissare the enthalpy and entropy of dissolution respectively,ΔHmixandΔSmixare the enthalpy and entropy
same order of magnitude than those observed in n-dodecane solvent then it could be expected that crystallization process in the former solvent will produce a larger population of crystals of smaller sizes.
We know from crystal growth theory20,27 that impurities (solvent) can disrupt the nucleation and growth processes, through their impact on molecular recognition and self-assembly associated with the growth process. Presumably such effects can only be remediated by increasing supersaturation, through which the critical cluster size becomes less than the separation between impurity molecules on the crystal surfaces, thus enabling the initiation of nucleation/growth. With toluene solute/solvent binding is much stronger when compared to the other solvents and hence higher supersaturation might be needed.
Conversely for crystal growth in toluene solutions, the process is rate-limited by mass transfer effect rather than by interface kinetics. This contrasts with growth fromn-dodecane and kero-sene solvents where surface integration is the rate limiting process. In the latter case the molecular similarity between alkyl solvent and methyl stearate may effect slower desolvation, compared to the aromatic solvent toluene at the growth interface, where the surface integration takes place in a much more confined environment when compared to that occurring within the bulk solution. In the latter case the solvent would be much more likely to be retained temporally at the interface thus acting as an“impurity”, which would impede growth until the super-saturation is high enough and surface nuclei radius small enough to allow growth to proceed.
4. CONCLUSIONS
A detailed analysis of the crystal morphology for methyl stearate, using a methodology based on a combined BFDH and zone axis analysis12yielded the morphological indexation to be (110) and (1−10) based on the monoclinicC2 crystal structure. Crystals growing from supersaturated n-dodecane, kerosene, and toluene solutions, as study using in situ optical microscope, at supersatu-ration (σ) levels of 0.30−0.39, 0.45−0.52, and 0.04−0.08, respectively, showed that the crystal morphology changes only in the case of methyl stearate crystallizing from kerosene at the lowest supersaturation values (σ< 0.45). The growth rates measured in toluene are of the same order of magnitude to those observed in kerosene, ranging from 0.02 to 0.37μm/s and are around half those observed inn-dodecane solutions, in which these values range from 0.09 to 1.13μm/s. Measurements of the growth for the (110) face in the case of kerosene solutions are much lower in magnitude compared to those for the (1−10) face, ranging from 0.02 to 0.15μm/s, which gives these crystals an elongated lozenge shape. Similar growth rates values are observed between the (110) face and the (1−10) face for crystals growing from n-dodecane and toluene solvents. The tendency of the growth rate dependence onσwas consistent with the BCF growth mechanism inn-dodecane, the B&S mechanism in kerosene, and diffusion controlled in toluene solvent.
■
ASSOCIATED CONTENT*
S Supporting InformationThe Supporting Information is available free of charge on the
ACS Publications websiteat DOI:10.1021/acs.cgd.6b01436. Description of the methodology used to solve crystal morphology; the complete set of planes delivered through the prediction of the BFDH morphology for methyl stearate crystals using three different sets of unit cell
parameters; the derivation of models expressions for the assessment of the dependence of single faces growth rates (G) on supersaturation (σ) and a sequence of images of methyl stearate crystals growing with time in three different representative diesel type solvents (PDF)
■
AUTHOR INFORMATIONCorresponding Author
*E-mail:[email protected].
ORCID
Diana M. Camacho:0000-0001-5330-4110 Present Address
#Lewtas Science & Technologies Ltd., Oxford, OX2, 7DY, UK
Notes
The authors declare no competingfinancial interest.
The research data supporting this publication can be accessed at
http://doi.org/10.5518/141.
■
ACKNOWLEDGMENTSThe authors gratefully acknowledge Infineum Ltd. for the funding of this research22,28which forms part of the doctoral studies of one of us (D.C.).28We also gratefully acknowledge the U.K. EPSRC for the support of nucleation and crystal growth research at Leeds and Manchester through funding the Critical Mass Project: Molecules, Clusters and Crystals (Grant references EP/IO14446/1 and EP/IO13563/1). One of the authors (D.T.) acknowledges the EPSRC Centre for Doctoral Training (CDT) in Particulate Products and Processes for the support of her studentship at the University of Leeds.
■
SYMBOLSA1, Growth parameter in B&S model
A2, Growth parameter in the BCF model
C, Solution concentration (m−3)
Ce, Equilibrium concentration (m−3)
dhkl, Interplanar distances within morphological (hkl) forms
J, Nucleation rate (nuclei mL−1s−1)
k, Boltzmann constant (J K−1)
kd, Docking rate (mol m−2s−1)
kG, Growth rate constant (m(1/m)s−1)
kMT, Mass transfer coefficient (m s−1)
r, Growth exponent
r*, Critical nucleus radius
R, Single face growth rate (ms−1)
S, Supersaturation ratio
T, Solution temperature (K)
Te, Solution saturation (or equilibrium) temperature (K)
V, Volume of solution (m3)
x, Mole fraction of solute in solution
xe, Equilibrium mole fraction
σ, Relative supersaturation
σcrit, Critical relative supersaturation
ρs, Solute density (kg m−3)
ΔHdiss, Enthalpy of dissolution (kJ mol−1)
ΔHmix, Enthalpy of mixing (kJ mol−1)
ΔSdiss, Entropy of dissolution (kJ mol−1K−1)
ΔSmix, Entropy of mixing (kJ mol−1K−1)
γ, Interfacial tension (mJ m−2)
■
ABBREVIATIONSBCF, Burton-Cabrera-Frank model
BFDH, Bravais-Friedel-Donnay-Harker model B&S, Birth and Spread model
MSZW, Metastable zone width
MW, Molecular weight
RIG, Rough Interface Growth model SD, Standard deviation
2D, Two dimensional 3D, Three dimensional
■
REFERENCES(1) Ma, C. Y.; Liu, J. J.; Wang, X. Z. Measurement, modelling, and closed-loop control of crystal shape distribution: literature review and future perspectives.Particuology2016,26, 1−18.
(2) Giberti, F.; Salvalaglio, M.; Parrinello, M. Metadynamics studies of crystal nucleation.IUCrJ2015,2, 256−266.
(3) Salvalaglio, M.; Perego, C.; Giberti, F.; Mazzotti, M.; Parrinello, M. Molecular-dynamics simulations of urea nucleation from aqueous solution.Proc. Natl. Acad. Sci. U. S. A.2015,112, E6−E14.
(4) Liu, X. Y.; Boek, E. S.; Briels, W. J.; Bennema, P. Prediction of crystal growth morphology based on structural analysis of the solid-fluid interface.Nature1995,374, 342−345.
(5) Liu, X. Y.; Boek, E. S.; Briels, W. J.; Bennema, P. Analysis of morphology of crystals based on identification of interfacial structure.
J. Chem. Phys.1995,103, 3747−3754.
(6) Gnanasambandam, S.; Enemark, S.; Rajagopalan, R. First-principle prediction of crystal habits in mixed solvents: alpha-glycine in methanol/water mixtures.CrystEngComm2011,13, 2208−2011.
(7) Jarzembska, K. N.; Kamiński, D.; Hoser, A. A.; Malińska, M.; Senczyna, B.; Wozńiak, K.; Gagos, M. Crontrolled crystallization, structure, and molecular properties of lodoacetylamphotericin B.Cryst. Growth Des.2012,12, 2336−2345.
(8) Kumar, D.; Thipparaboina, R.; Modi, S. R.; Bansal, A. K.; Shastri, N. R. Effect of HPMC concentration on crystal habit of nifedipine.
CrystEngComm2015,17, 1615−1624.
(9) Toroz, D.; Rosbottom, I.; Turner, T.; Camacho, D. M.; Hammond, R. B.; Roberts, K. J. Towards an understanding of the nucleation of alpha-para amino benzoic acid from ethanolic solutions: a multi-scale approach, Farad.Faraday Discuss.2015,179, 79−114.
(10) Jarzembska, K. N.; Kamiński, R.; Wenger, E.; Lecomte, C.; Dominiak, P. M. Interplay between charge density distribution, crystal structure energetic features, and crystal morphology of 6-methyl-2-thiouracil.J. Phys. Chem. C2013,117, 7764−7775.
(11) Nguyen, T. T. H.; Hammond, R. B.; Roberts, K. J.; Marziano, I.; Nichols, G. Precision measurement of the growth rate and mechanism of Ibuprofen {001} and {011} as a function of crystallisation environment.
CrystEngComm2014,16, 4568−4586.
(12) Camacho, D. M.; Roberts, K. J.; Lewtas, K.; More, I. The crystal morphology and growth rates of triclinic n-docosane crystallising from n-dodecane solutions.J. Cryst. Growth2015,416, 47−56.
(13) Wu, K.; Ma, C. Y.; Liu, J. J.; Zhang, Y.; Wang, X. Z. Measurement of crystal face specific growth kinetics.Cryst. Growth Des.2016,16, 4855−4868.
(14) Van Driessche, A. E. S.; Otalora, F.; Sazaki, G.; Sleutel, M.; Tsukamoto, K.; Gavira, J. A. Comparison of different experimental techniques for the measurement of crystal growth kinetics.Cryst. Growth Des.2008,8, 4316−4323.
(15) Aleby, S.; von Sydow, E. The crystal structure of methyl stearate.
Acta Crystallogr.1960,13, 487.
(16) MacGillavry, C. H.; Wolthuis-Spuy, M. Crystal structure of an orthorhombic modification of methyl stearate.Acta Crystallogr., Sect. B: Struct. Crystallogr. Cryst. Chem.1970,B26, 645−648.
(17) Sangwal, K. Additives and crystallization processes: from fundamentals to applications; Wiley: Chichester, 2007.
(18) Mullin, J.W.Crystallization, 4th ed.; Butterworth-Heinemann: Oxford, 2001.
(19) Garside, J. Industrial crystallization from solution.Chem. Eng. Sci.
1985,40, 3−26.
(20) Burton, W. K.; Cabrera, N.; Frank, F. C. The growth of crystals and the equilibrium structure of their surfaces.Philos. Trans. R. Soc., A
1951,243, 299−358.
(21) Weeks, J. D.; Gilmer, G. H. Dynamics of crystal growth.Adv. Chem. Phys.1979,40, 157−227.
(22) Jiang, H. Molecular-scale effect of tailor-made additives on the nucleation and growth and crystal properties of long-chain alkyl methyl-esters; School of Process Environmental and Materials Engineering, University of Leeds, 2012.
(23) Lundagermadsen, H. E.; Boistelle, R. Growth kinetics of the (001) faces of hexatriacontane (C36H74) in solution.J. Cryst. Growth1979,46, 681−690.
(24) Beckmann, W. Growth kinetics of the (001) and (110) faces of the B modification of stearic acid growing from n-alkanes. J. Cryst. Growth1986,79, 797−800.
(25) Beckmann, W.; Boistelle, R. Growth kinetics of the (110) face of stearic acid growing from butanone solutions, pure solutions and in the presence of an emulsifier.J. Cryst. Growth1985,72, 621−630.
(26) Beckmann, W.; Kammer, S.; Meier, J.; Boistelle, R. growth kinetics of the (110) face of the B-polymorphs and C-polymorphs of stearic-acid growing from octanone-2 solutions.J. Cryst. Growth1986,
74, 326−330.
(27) Boistelle, R.; Astier, J. P. Crystallization mechanisms in solution.J. Cryst. Growth1988,90, 14−30.
(28) Camacho, D. Crystallisation in diesel and biodiesel fuel in relation to their solution composition; PhD Thesis; School of Chemical and Process Engineering, University of Leeds, 2015.