White Rose Research Online URL for this paper: http://eprints.whiterose.ac.uk/136712/
Version: Accepted Version Article:
Crown, W., Buyukkaramikli, N., Sir, M.Y. et al. (7 more authors) (2018) Application of constrained optimization methods in health services research: Report 2 of the ISPOR Optimization Methods Emerging Good Practices Task Force. Value in Health, 21 (9). pp. 1019-1028. ISSN 1098-3015
https://doi.org/10.1016/j.jval.2018.05.003
Article available under the terms of the CC-BY-NC-ND licence (https://creativecommons.org/licenses/by-nc-nd/4.0/).
[email protected] https://eprints.whiterose.ac.uk/ Reuse
This article is distributed under the terms of the Creative Commons Attribution-NonCommercial-NoDerivs (CC BY-NC-ND) licence. This licence only allows you to download this work and share it with others as long as you credit the authors, but you can’t change the article in any way or use it commercially. More
information and the full terms of the licence here: https://creativecommons.org/licenses/ Takedown
If you consider content in White Rose Research Online to be in breach of UK law, please notify us by
1
Application of Constrained Optimization Methods:
Report 2 of the ISPOR Optimization Methods Emerging Good Practices Task Force
William Crown, PhD1, Nasuh Buyukkaramikli, PhD2, Mustafa Y. Sir, PhD3, Praveen Thokala, PhD4, Alec Morton, PhD5, Deborah A. Marshall 6,7, PhD, Jon Tosh8, PhD, Maarten J.
Ijzerman, PhD9, William V. Padula, PhD10, MS, Kalyan S. Pasupathy, PhD11
Running title: Constrained Optimization Methods Report 2
Word count: 7819 Number of pages: 33 Number of figures: 1 Number of tables: 1
Appendices: Count (2), Pages (14)
William Crown, PhD, Chief Scientific Officer, OptumLabs, Boston, MA, USA
Nasuh C. Buyukkaramikli, PhD, Scientific Researcher, institute of Medical Technology assessment (iMTA), Erasmus University Rotterdam, Rotterdam, The Netherlands
Mustafa Y. Sir, PhD, Assistant Professor, Health Care Systems Engineering, Mayo Clinic Robert D. and Patricia E. Kern Center for the Science of Health Care Delivery, Rochester, MN, USA
Praveen Thokala, MASc, PhD, Research Fellow, University of Sheffield, Sheffield, UK Alec Morton PhD, Professor of Management Science, Department of Management Science, Strathclyde Business School, University of Strathclyde, Glasgow, Scotland, United Kingdom Deborah Marshall, PhD, Canada Research Chair, Health Services & Systems Research; Arthur J.E. Child Chair in Rheumatology Research; Director, HTA, Alberta Bone & Joint Health Institute; Associate Professor, Department Community Health Sciences, Faculty of Sciences, Faculty of Medicine, University of Calgary, Calgary, Alberta, Canada
Jonathan C. Tosh, PhD, Senior Health Economist, DRG Abacus, Manchester, UK Maarten J. IJzerman, PhD, Professor of Clinical Epidemiology & Health Technology
Assessment (HTA); Head, Department of Health Technology & Services Research, University of Twente, Enschede, The Netherlands
William V. Padula, PhD, MS, MSc, Assistant Professor, Department of Health Policy & Management, Johns Hopkins Bloomberg School of Public Health, Baltimore, MD, USA *Kalyan S. Pasupathy, PhD, Associate Professor, Healthcare Policy & Research; Scientific Director - Information & Decision Engineering; Scientific Director - Clinical Engineering Learning Labs, Mayo Clinic Kern Center for the Science of Health Care Delivery, Rochester, MN, USA
2
Financial Support: None of the authors received financial support for their participation in this
ISPOR Task Force. All authors volunteered their time for discussion, research, and writing of this report. This research was supported in part by ISPOR, which contributed one staff liaison for this project.
Précis: Use of optimization methods can identify optimal solutions to problems in care delivery
and policy, with a potential to improve clinical outcomes and cost effectiveness.
Optimization TFR Acknowledgements
The co-authors thank all those who commented orally during four task force workshop and forum presentations at ISPOR conferences in the US and Europe in 2016 and 2017. The co-authors gratefully acknowledge the following 26 reviewers who contributed their time and expertise through submission of written comments on the ISPOR Optimization Methods Emerging Good Practices Task Force Reports 1 and 2: Ekkehard Beck, Bjorn Berg J. Jaime Caro, Koen Degeling, Brian Denton, Beth Devine, Stephanie Earnshaw, Talitha Feenstra, Chris Hane, Katherine Hicks, Julie L. Higle, Ng Chin Hui, Adam Letchford, Dawn Lee, Nan Liu, Lena Burgos Liz, Nikolas Popper, Farhan Abdul Rauf, Emily S. Reese, Ajit Singh, Eunju Todd, Pepijn Vemer, Amir Viyanchi, Richard J. Willke, Beth Woods, Greg Zaric. Their generous feedback improved the manuscript and made it an expert consensus ISPOR Task Force Report.
Special thanks to Bhash Naidoo, Senior Technical Adviser (Health Economics) – NICE Centre for Guidelines, National Institute for Health and Care Excellence, London, England, UK for his comments.
3
Application of Constrained Optimization Methods:
Report 2 of the ISPOR Optimization Methods Emerging Good Practices Task Force
Abstract
Constrained optimization methods are already widely used in healthcare to solve problems that
represent traditional applications of operations research methods such as choosing the optimal
location for new facilities or making the most efficient use of operating room capacity. In this
paper we illustrate the potential utility of these methods for finding optimal solutions to problems
in healthcare delivery and policy. To do so, we selected three award-winning papers in
healthcare delivery or policy development reflecting a range of optimization algorithms.
Two of the three papers are reviewed using the ISPOR Constrained Optimization Good Practice
Checklist adapted from the framework presented in the initial Optimization Task Force Report.
The first case study illustrates application of linear programming to determine the optimal mix of
screening and vaccination strategies for the prevention of cervical cancer. The second case
illustrates application of the Markov Decision Process to find the optimal strategy for treating
Type-2 diabetes patients for hypercholesterolemia using statins.
The third paper is used as an education tool. The goal is to describe the characteristics of a
radiation therapy optimization problem and then invite the reader to formulate the mathematical
model for solving it. This example is particularly interesting because it lends itself to a range of
possible models, including linear, non-linear, and mixed-integer programming formulations.
From the case studies presented, we hope the reader will develop an appreciation for the wide
range of problem types that can be addressed with constrained optimization methods, as well as
4 Highlights
- Constrained optimization methods are informative to decision makers in providing
insights about optimal target solutions and the magnitude of the loss of benefit or
increased costs associated with the ultimate clinical decision or policy choice. Failing to
identify a mathematically superior or optimal solution represents a missed opportunity to
improve economic efficiency in the delivery of care and clinical outcomes for patients.
- The ISPOR Optimization Methods Emerging Good Practices Task Force’s first report
provided an introduction to constrained optimization methods to solve important clinical
and health policy problems. This report also outlined the relationship of constrained
optimization methods relative to traditional health economic modeling, graphically
illustrated a simple formulation and identified some of the major variants of constrained
optimization models, such as linear programming, dynamic programming, integer
programming, and stochastic programming.
- This second report illustrates the application of constrained optimization methods in
healthcare decision making using three case studies. The studies focus on determining
optimal screening and vaccination strategies for cervical cancer, optimal statin start times
for diabetes and an educational case to invite the reader to formulate radiation therapy
optimization problems. These illustrate a wide range of problem types that can be
5 Background to the Task Force - Box
The proposal to initiate an ISPOR Good Practices for Outcomes Research task force was
evaluated by the ISPOR Health Science Policy Council then recommended to the ISPOR Board of Directors for approval.
The task force was comprised of international subject matter experts representing a diverse range of stakeholder perspectives (academia, research organizations, government, regulatory agencies and commercial entities). The task force met approximately every five weeks by teleconference and in person at ISPOR conferences. All task force members reviewed many drafts of the report and provided frequent feedback in both oral and written comments.
To ensure that ISPOR Good Practices Task Force Reports are consensus reports, findings and recommendations are presented and discussed at ISPOR conferences. In addition, the first and
final draft reports are circulated to the task force’s review group. All reviewer comments are
6 1. Introduction
There are often many different options for improving healthcare policy or improving current
practice in healthcare organizations. The optimal solution among those options, i.e., the
solution that best achieves a defined goal, such as maximizing patient quality-of-life or
minimizing patient waiting time for services, may not be readily apparent. Constrained
optimization methods use mathematical techniques to help efficiently and systematically
identify the best (optimal) of all possible solutions to a problem while considering the relevant
constraints, such as budget limits or staffing capacity.
Of course, mathematically optimal solutions to all problems are not always feasible; other
non-quantifiable criteria such as political barriers that cannot be accounted for by defined constraints
have to be considered. However, optimization techniques can still be highly informative to
decision makers in providing insights about optimal target solutions and the magnitude of the
loss of benefit or increased costs associated with the ultimate policy choice. In healthcare,
failing to identify a mathematically superior or optimal solution represents a missed opportunity
to improve economic efficiency in the delivery of care and clinical outcomes for patients.
The ISPOR Optimization Methods Emerging Good Practices Task Force provided an
introduction to constrained optimization methods to solve important health policy and clinical
problems in its first report [1]. The previous report outlined the relationship of constrained
optimization methods relative to traditional health economic modeling and simulation models
and identified some of the major variants of constrained optimization models, such as linear
7
In addition, the report graphically illustrated the formulation and solution of a straightforward
integer program to maximize health benefit subject to a budget constraint. Further, it explained
the steps in an optimization process: 1) structuring the problem, 2) formulating the mathematical
model, 3) developing the model, 4) validating the model, 5) selecting the optimization method,
6) performing the optimization and conducting sensitivity analysis, 7) reporting results, and 8)
using the results for decision-making.
The principal objective of this second Optimization Task Force Report is to illustrate the
application of constrained optimization methods in healthcare decision making. To identify
relevant examples, we began by searching for award-winning health care papers from the
Institute for Operations Research and Management Sciences (INFORMS) and the Association
for European Operations Research Societies (EURO). From these papers, we then selected
examples with models relevant for health economic policy or clinical decision making. Finally,
we endeavored to select papers that collectively illustrated a variety of different constrained
optimization methods. The three papers that received the most votes from the task force
members were selected.
In this report, two of these three papers are compared with the steps in formulating, solving,
validating, reporting, and using optimization models originally published as Table 3 in the first
Optimization Emerging Good Practices Task Force Report. A slightly modified version of this
previous table is presented as the ISPOR Constrained Optimization Good Practice Checklist
(Table 1) in the current report. The first case study illustrates the application of linear
programming to determine the optimal mix of screening and vaccination strategies for the
8
The second case illustrates application of the Markov Decision Process to find the optimal
strategy for treating Type-2 diabetes patients for hypercholesterolemia using statins [3]. Finally,
the third paper is used as an education tool. The goal is to describe the characteristics of a
radiation therapy optimization problem and then invite the reader to formulate the mathematical
model for solving it. This example is interesting because it lends itself to a range of possible
models, including linear, non-linear, and mixed-integer programming formulations. (Detailed
formulations for each model are provided in Appendix 1.)
Although we are clearly limited in the number of permutations that we can present with these
three cases we hope the reader will develop a sense of the wide range of problem types that can
be addressed with constrained optimization methods, as well as the variety of methods available.
2. Overview of applications of constrained optimization in health care
Constrained optimization methods are already widely used in healthcare areas such as choosing
the optimal location for new facilities, making the most efficient use of operating room capacity,
workforce planning, etc. They can also be instrumental in guiding clinical decision making in
actual clinical practice where health professionals and patients face constraints, such as
proximity to treatment centers, health insurance benefit designs, and the limited availability of
health resources.
Optimization is also beneficial for planning healthcare expenditure. An obvious example is the
resource allocation problem faced by a planner with a number of investment opportunities, but a
fixed budget inadequate to fund all available opportunities [4]. Perhaps the simplest case of this
is where the investment opportunities are incremental to current care, and fall into distinct
9
mental health) with separate budgets [5]. In this situation, decisions about investments in
different clinical areas can be made independently of one another.
However, more commonly the healthcare budget needs to be allocated across different
conditions. The problem of choosing the best set of investment opportunities to fund under a
fixed budget constraint in order to meet an objective, such as maximizing total QALYs can be
addressed as an optimization problem [6]. Given a number of eligible interventions and a fixed
budget, optimization can be used to solve resource allocation problems.
In fact, the task central to health economic analysis, of evaluating whether the incremental
cost-effectiveness ratio (ICER) of an intervention is below a critical threshold, can be shown to be
related to budget constrained optimization. According to the theoretical definition, under a strict
set of assumptions, the threshold represents the inverse of the shadow price of the budget
constraint – the shadow price is defined as how much the objective (QALYs) would increase for
a one-unit increase in the constraint (budget) [7].
Other resource allocation problems may be even more complicated. There may be significant
and complex interactions between different investments; and there may be additional constraints
to be considered such as limits on the number of staff or bed capacity [8]. For example,
consider the case of allocating resources for the prevention and cure of an infectious disease such
as HIV, Hepatitis C, tuberculosis, malaria, or polio [9, 10]. If the planner invests in vaccination,
there may be fewer cases to treat in the future (and so investment in highly capital-intensive
treatment facilities may be wasted). On the other hand, vaccination is itself costly, and if the
10
more details on these complexities, see the Economic Analysis of Vaccination Programs: An
ISPOR Good Practices Task Force Report [12].
Optimizing investment in such infectious disease programs is more complicated because they
may involve making multiple runs of a state-of-the-art simulation [13, 14] of the infectious
disease dynamics, to plot out how the particular patterns of resource allocation perform against
the objective (of minimizing the total number of cases or maximizing the probability of
achieving disease eradication). For a review of mathematical approaches to infectious disease
prediction and control, see [15].
In other settings, the critical resource(s) might not be money; for example, when allocating
donated organs such as kidneys not every kidney will be compatible with every donor. In
addition, the medical condition of the eligible recipients will be different, some will be more
urgent than others. In this case, the underlying problem can be categorized as a matching
problem [16]. In matching problems, not everyone will get the best match. However, the
objective with kidney allocation is generally to ensure that as few as possible people and kidneys
are left unmatched (patients without kidneys; kidneys without patients) [17] present a discussion
about how to incorporate fairness in such problems. Some measures of deservingness, e.g., time
on waiting list, may be incorporated in the objective function. Nevertheless, some fairness
considerations may also be included as constraints, e.g., at least x % of transplants should go to
patients of a certain blood type. The 2012 Nobel Prize in Economics was awarded to Shapley
11
Other clinical problems where optimization can be applied relate to problems of disease
management, e.g., timing of the initiation of treatment, or the sequence of treatments. The
promise of health gain from treatment must be balanced against reasons for holding off
treatment, which may include cost, undesirable side-effects, and emergent drug resistance. It
may be the case that there is an optimal stage in the disease prognosis or point in the patient’s
life cycle where the balance shifts from favoring non-intervention to favoring treatment. The
MDP approach provides an ideal framework [18] to study such problems for identifying critical
initiation points. This framework has been used to analyze timing decisions in diseases as
diverse as HIV, diabetes, and breast cancer [3, 19, 20]. Optimization methods can be applied to
identify the optimal treatment sequences when a large number of treatments are available--for
example, in rheumatoid arthritis [21].
Finally, constrained optimization methods have also been applied to disease diagnosis [22, 23],
the development of optimal treatment algorithms [24, 25], and the optimal design of clinical
trials [26]. Health technology assessment using tools from constrained optimization methods is
also gaining popularity [27]. We also encourage the readers to refer to the initial ISPOR
Optimization Emerging Good Practices Task Force Report, which presented a more
comprehensive overview of the different applications for which optimization techniques can be
used [1].
3. Steps in an Optimization Process
Table 1 reproduces the steps of the optimization process previously presented in the initial
Optimization Task Force Report. It is reproduced here as the ISPOR Constrained Optimization
12
example will all be discussed in light of this framework. The primary purpose of Table 1 is to
support the design of optimization studies by prompting the user to report and justify the choices
made at each step of the process. It should be noted that the steps outlined in Table 1 do not need
to be conducted sequentially. In fact, most of the optimization studies involve performing these
steps in an iterative manner to solve the problem. Along with guiding the design of optimization
studies, Table 1 can also be used to support the critique and quality assessment of published
optimization studies. The steps in Table 1 are described in detail in the text below.
Problem structuring
The first step is to determine if constrained optimization is an appropriate methodology to
address the problem at hand. It involves identifying if there are any quantifiable constraints and
whether a specific goal can be achieved by changing some (decision) variables. This problem
structuring phase should be done in consultation with the key stakeholders and decision makers
to ensure that the optimization problem is appropriately specified. This will ensure that the
objective functions and constraints are appropriate and get their ‘buy-in’ to change the decision
variables in order to achieve an optimal solution. A clear textual description of the decision
problem should be reported and validated with the key stakeholders and decision makers.
Mathematical formulation
This involves converting the textual description into a mathematical representation of the
optimization problem. Objective function(s) and constraints need to be defined in analytical form
as a function of decision variables and parameters. Note that decision variables are changed
during optimization iterations in order to identify the optimal solution, while parameters remain
13
parameters need to be justified. The type of objective function (single objective or
multi-objective, linear or non-linear, stochastic or deterministic) and the type of estimation (analytical
estimation or via simulation modelling for complex problems) need to be specified. Similarly,
for constraints, the number of constraints and the type of estimation used for the constrained
quantity need to be reported and justified. The sources and the values of the parameters used to
estimate the objective function(s) and constraints also need to be justified. The mathematical
representation of the optimization problem should be reported after validation with the key
stakeholders and decision makers.
Model development
This involves programming the model in software to estimate the objective function(s) and
constraints, using decision variables and parameters as inputs. It should be noted that in some
instances, the analytical form of the mathematical formulation can be programmed directly
because the mathematical formulation sufficiently defines the relationships between objective
function(s)/constraints and decision variables/parameters. However, in other instances, a
simulation model needs to be developed to estimate the objective function(s)/constraints. Models
should be designed so that the objective function can be evaluated based upon the full range of
possible decision variables (the feasible region or search space). The model structure and
assumptions should be reported and validated with the key stakeholders and decision makers.
The initial mathematical formulation and model development steps affect the specification of the
particular optimization method to be applied. These steps are closely related and interdependent.
This is one important reason why the steps in optimization do not always have to follow the
14 Model validation
Before the optimization is undertaken, the underlying model needs to be verified and validated,
to ensure the robustness of the results for different analyses performed. This means that the
model should be consistent with reality within specified tolerances. Once the model has been
developed to the point where it is producing estimates, the model code also needs to be checked
to ensure the model results are valid. In the case of models that represent an analytical
formulation directly, this is relatively straightforward as this involves checking the specific
model results used as parameters for estimating the objective function and constraints.
However, when a simulation model is used to evaluate the objective function, this would
necessitate a combined approach of simulation-optimization [28, 29]. This is a bit more difficult
because it involves checking the model results for all combinations of decision variables.
Meta-modeling techniques [30], i.e., Meta-modeling the simulation model outputs as functions of simulation
inputs, can circumvent getting the simulation results for all variables in the parameter space.
These topics are beyond the scope of this report; we suggest reviewing Sargent (2009) and Law
(2006).
Modelers are encouraged to validate the model results in different parts of the decision variable
space to have enough confidence that the model used is appropriate for optimization [31, 32].
This should also involve asking the key stakeholders and decision makers to check the model
results for face validity.
Select optimization method
15
variables (continuous or discrete), and the type of objective function (single objective or
multi-objective, linear or non-linear, stochastic or deterministic), and the type of constraints (single vs
multiple constraints). The optimization algorithm/tool used also needs to be justified on the basis
of the optimization method, as well as the estimation type (analytical formulation vs simulation
optimization) and other relevant characteristics of the model (number of decision variables or
transferability of the problem to other well-known problem types). The methods and tools chosen
for optimization need to be reported and justified.
Perform optimization/sensitivity analysis
This involves running the optimization model, identifying the optimal solution, and
understanding the impact of alternative parameters on the optimal solution using sensitivity
analyses. Settings used for the optimization, such as the convergence level required or the
maximum number of iterations, need to be justified. In some problems, searching for the optimal
solution might be computationally feasible, whereas in others, solving time increases to such an
extent that the use of heuristics is justified.
As with decision modelling, optimization can have stochastic uncertainty in parameters and
model structure. Stochastic optimization [33], robust optimization techniques [34] and sensitivity
analyses can be used to deal with parameter uncertainty. However, structural uncertainty needs
to be dealt with by thinking about the choices throughout the optimization process. For example,
is a linear program really appropriate? Are the simplifications and assumptions appropriate and
to what extent is there a risk of a wrong/sub-optimal decision being reached? The choice of
decision variables, parameters, constraints, and model assumptions also need to be structurally
16
The optimal solution needs to be checked to identify if it is feasible and, if so, sensitivity
analyses should be conducted. The optimization settings and the sensitivity analyses need to be
explained to the key stakeholders/decision makers and reported in detail.
Report results
This involves specifying the values of the decision variables, objective function and constraints
at the optimal solution, for the base case analyses, as well as the sensitivity analyses. The
optimization results (i.e. optimal solution for the base case and sensitivity analyses) need to be
reported and validated with the key stakeholders/decision makers. Also, the performance of the
optimization tool/method needs to be reported, such as the time taken to identify the optimal
solution, number of iterations required, and the convergence level (if applicable). These results
should be reported in a manner that is understandable and interpretable by relevant stakeholders
and decision makers.
Decision making
The meaning of the optimal solution should be explained to the decision makers. This involves
converting the mathematical optimal solution into clear, concise plans for implementation. At
this stage, the choices made at all the stages of modelling and optimization--type of model, data,
assumptions, the design, settings and others--need to be validated to ensure the results of
optimization problem are plausible and consistent with decision maker objectives. Also, the
possibility of amending the decision variables to the values specified by the optimization process
17
To reiterate, the results of the optimization should not be used mechanistically: it is the decision
makers that implement the findings, hence they should be comfortable with the methodology,
data, and assumptions involved in the whole optimization process.
4. Optimization Case Studies
In this section, we consider two constrained optimization studies and compare their structure to
the steps outlined in Table 1. The first case study focuses on resource allocation for the
prevention/cure of infectious diseases while the second illustrates the use of constrained
optimization to guide optimal treatment initiation. These cases illustrate different modeling
techniques, as well as extensions of the application of constrained optimization methods beyond
the typical realm of scheduling, shipping cost minimization, maximization of facility capacity,
etc. Please note that the educational case study and the model formulations appear in Appendix
I and II, respectively.
Case Study 1. Selecting a Mix of Prevention Strategies Against Cervical Cancer [2]
Problem Structuring
Cervical cancer is the second most common cancer in women under 35 years old in the UK. The
objective of this study was to identify the optimal mix of primary and secondary prevention
strategies for cervical cancer that achieves maximum reduction in cancer cases under budget and
logistic constraints. The authors applied the optimization model in two countries with different
healthcare organizations, epidemiology, screening practices, resource settings and treatment
costs: one in the UK, and one in Brazil. They considered two cervical cancer prevention
18
Primary prevention – Because an HPV infection is the most common cause of cervical
cancer, HPV vaccination is a primary prevention strategy. Two HPV vaccines are
currently available. Both vaccines have an efficacy of approximately 98% against the
cervical cancer vaccine HPV types (HPV 16 and 18), but with a different cross-protection
profile against oncogenic non-vaccine HPV-types. The implementation of vaccination
varies widely among countries with regard to the strategy selection (national
immunization program or individual based); the logistics (via a separately established
vaccination setting or via primary healthcare); the age group targeted; and the gender
selection (female only or all patients).
Secondary prevention - Cytology-based screening programs have contributed to a
decrease of up to 80% in the incidence and mortality of cervical cancer in countries with
a well-established, organized screening program. However, despite their potential,
cytology-based screening programs sometimes have a limited impact due to factors such
as sensitivity of the screening method (ability of the test to correctly identify those
patients with the disease), treatment failure and the level of resources required for an
adequate follow-up of patients.
Four prevention strategies were evaluated: screening; vaccination; screening plus vaccination;
and no prevention because these were the options available for cervical cancer prevention in the
UK and Brazil at the time of the study. Only cytology-based screening was included in the
model, with sensitivity estimates based on published literature. Different screening interval
scenarios were explored, from every year to every 25 year. Women are screened only twice over
19
It was assumed that vaccination is administered at age 12 and induces lifelong protection against
HPV. In total, 52 different strategies were tested for each country. These 52 strategies defined
the full range of possible combinations of vaccination (not available or available) and screening
interventions (not available or available with intervals between screenings estimated from 1 year
to 25 years in 1-year increments). The final scenarios can be listed as follows: (scenario 1: no
screening & no vaccine; scenario 2: 1-year screening interval & no vaccine; scenario 3: 2-year
screening & no vaccine; … , scenario 26: 25 year screening & no vaccine’ scenario 27: no
screening & vaccine; scenario 28: 1 year screening & vaccine; scenario 29: 2 year screening &
vaccine ; … , scenario 52: 25-year screening & vaccine).
Mathematical Formulation
The optimization model used a linear programming formulation consisting of a single linear
objective function and multiple linear constraints. The model was continuous, allowing
fractional values for the decision variables. It was static, meaning that the problem was solved
once at steady state. Finally, the model was deterministic which assumed that all the outputs
were known and there was no stochastic variation.
Fifty-two decision variables, , each representing the proportion of the population addressed by
each strategy considered, , were used with separate identifiers for strategies
involving screening and strategies involving vaccination in order to deal with screening and
vaccination coverage constraints. Given the aim was to minimize the number of cervical cancer
cases, the objective function was represented as the sum of the cervical cancer cases (at steady
state for 100 000 women) for each strategy, , multiplied by the proportion of population
20
The linear programming formulation for the cervical cancer prevention strategy optimization is
given as
min (1)
subject to
(budget constraint)
(2)
(strategy coverage bounds)
(3)
(complete population distribution)
(4)
(screening coverage upper bound)
(5)
(vaccination coverage upper bound)
(6)
min
(upper bound on population with no coverage)
(7)
21
The model has five constraints: budget, strategy coverage, total population, screening and
vaccination coverage limits. The first constraint is to ensure that the sum of the cost for each
strategy (at steady state for 100000 women), , multiplied by the proportion of the population
receiving each strategy, , is less than the overall budget constraint, . The strategy coverage
constraint ensures that the proportion of each strategy is between 0 and 1. The complete
population distribution constraint guarantees that all the 52 variables add to 1. That is, the sum
of the proportion of the population receiving each strategy should reflect the entire population.
Also, the sum of the proportion of the population receiving strategies including screening should
be less than the government-imposed screening coverage limit, . Similarly, the sum of
proportion of population receiving strategies including vaccination should be less than the
externally (e.g., government) imposed vaccination coverage limit, . Note that the
parameters and are derived from the Markov cohort model (see details below) for each
strategy .
Model Development
The mathematical formulation described above used the outputs of a health economic Markov
cohort model (number of cervical cancer cases CCi and total costs bi for each strategy i) as input
parameters. The Markov cohort model describes the population level’s natural history of cervical
cancer for the evaluation of the clinical and economic consequences of different prevention
strategies. The model considers a population of 100,000 women under a given prevention
strategy at steady state level. The Markov model consists of following states: no HPV infection,
HPV infection, cervical intraepithelial neoplasia (CIN) stages, cancer, and death (both cancer
22
Once patients are infected with HPV, individuals can progress and regress from HPV infection
and CIN stages. Vaccination is assumed to reduce the HPV infection rates, and detection through
screening provides the possibility of the treatment of CIN. Overall vaccine efficacy in the UK
and Brazil was calculated from the country-specific proportions of each HPV type in cervical
cancer. Other clinical and cost inputs were specified of each of these two countries.
The time horizon of the optimization problem was one year, and the health/cost outcomes across
the whole population were derived from the lifetime cohort results from the Markov model.
The model was run with a cohort of women over their lifetime for each one of the 52 scenarios
described above separately for both countries. The results of each scenario were used to estimate
the number of cervical cancer cases and total costs expected over one year at steady state for 100
000 women. The estimated number of cervical cancer cases ( ) and total costs ( ) of each of
the 52 prevention strategies were then used as input parameters for the optimization model.
Model validation
No validation effort was reported, neither for the health economic model nor for the optimization
model.
Select optimization method
Due to the relatively small size of the linear programming formulation described above--a total
of 52 decision variables and 57 constraints--a standard primal simplex method was chosen to
solve the problem.
Perform optimization/sensitivity analysis
This optimization problem was programmed in Microsoft Excel as a linear program and solved
23
cervical cancer prevention strategies that minimize the expected cervical cancer cases under a
fixed budget, as well as screening and vaccination coverage constraints. The optimization model
was solved twice using separate parameter sets reflecting the settings in UK and Brazil.
The base-case analysis assumed that the maximum screening coverage is the pre-vaccination
coverage rate (65% in the UK and 50% in Brazil), maximum vaccination coverage was set to
80%, and the overall budget was the pre-vaccination budget allotted to screening and treatment
of cervical lesions. No explanation was given as to why these maximum coverage rates were
chosen in the base-case.
Sensitivity analyses were performed to understand the effect of altering the budget or the
achievable screening or vaccination coverages (the constraints in the model) as well as the
duration of vaccine protection which was one of the parameters in the economic modeling. The
budget constraint was varied from a 20% reduction to a 150% increase over the pre-vaccination
levels, while the screening and the vaccination coverage levels were varied from 0% to 100%.
Report results
The optimal mix of strategies in the UK was 65% vaccination plus screening with a screening
interval of 6 years, and 15% vaccination alone. In Brazil, the optimal mix was 50% vaccination
plus screening with a screening interval of 5 years, and 30% vaccination alone. These optimal
mixes of strategies would result in a reduction of cervical cancer by 41% in the UK and 54% in
Brazil from pre-vaccination levels with no budget increase. It can be easily observed that in both
countries, the optimal coverage rates for both preventive interventions are at the maximum levels
24
In the sensitivity analyses, increasing the budget permits a shortening of the screening interval,
but the effect on the reduction in cervical cancer cases is modest and tends to reach an early
plateau. Vaccination alone (screening coverage set to 0%) could provide a reduction in cervical
cancer cases compared with the pre-vaccination situation of screening alone with a lower budget.
In both countries, the effect of reduced vaccine efficacy duration (25 years compared with
lifetime) still results in a reduction in cervical cancer compared with the pre-vaccination strategy,
but not as much as the base-case analysis. In both countries, a sharp reduction in the expected
number of cervical cancers is seen when the vaccine coverage rate exceeds the maximum
screening coverage rate or when screening coverage rate exceeds the maximum vaccine coverage
rate while maintaining the budget (treatment and prevention) constraint.
Decision Making
In this case study, within the same budget, results of the optimization program show that it would
be possible to substantially reduce the number of cervical cancer cases by implementing an
optimal combination of HPV vaccination (80% coverage) and screening at pre-vaccination
coverage (65% UK, 50% Brazil) while extending the screening interval to every 6 years in the
UK and 5 years in Brazil.
Optimization models can be used to determine the optimal mix of primary and secondary
prevention strategies minimizing cervical cancer burden under budget and logistic/infrastructure
constraints. The key strength of optimization modeling is its ability to evaluate multiple
combinations of different interventions and identify the mix that provides the maximum expected
25
budget. In addition, it allows the decision maker to set constraints reflecting local conditions,
such as a limited available budget or limited achievable coverage rates.
In this paper, the optimization model uses the health economic model outcomes as its input
parameters. Therefore, the validity of the optimization results is based on the validity of the
health economic model. Furthermore, the implementation issues, such as how it will be decided
who will receive vaccination, screening or both, were not discussed. In its current form, the
optimization model is used more to demonstrate the potential value of adding vaccination
strategy and to coordinate this addition with the existing screening practices in the UK and
Brazilian health systems.
For implementation purposes, a more advanced optimization model, as well as a more detailed
health economic model that takes into additional considerations and interactions, (e.g. herd
protection, resistance dynamics of the virus, transmission to the others, decreased secondary
infections, infertility avoidance, logistic/infrastructure, socio-economic and equity concerns,
etc.), are needed. Lack of these essential considerations in the economic and optimization models
limits the usefulness of the results provided in the paper.
Case Study 2: Optimizing statin treatment initiation using MDP [3]
Problem Structuring
Type-2 diabetes (T2D) leads to many chronic outcomes, including stroke, coronary heart disease
(CHD), kidney failure, etc. This study focuses on the selection of T2D patients for statin therapy
of hypercholesterolemia. The market for statins is significant and remains burdensome to health
26
report overprescribing (prescribing statins to those patients who only achieve marginal benefit)
and under-prescribing (not prescribing statins to those patients most likely to benefit). Given this
debate, Denton and colleagues’ aim was to identify the optimal time to initiate statin treatment
for hypercholesterolemia in T2D patients.
The problem is set up using an MDP framework. Traditional health services research methods
focus on efficacy and/or cost-effectiveness at a snapshot in time to inform decisions, while MDP
provides an in-depth modeling and understanding for optimal decisions at multiple time points
over a patient’s disease history. Due to the nature of the modeling, it provides the ability to
personalize decisions, as opposed to one-size-fits-all policies and guidelines established for
medical decisions. However, similar to other approaches, MDPs have assumptions based on data
and/or the structure of the model.
Mathematical Formulation
The model optimizes a cost-reward function over time using a MDP. We recognize that MDPs
are not commonly associated with constrained optimization because they typically do not have
“constraints” in the same sense that the term is used in the mathematical programming literature
(for example, in the previous case study). However, the ability of dynamic programming models
to identify the optimal solution to the MDP--the optimal pattern of statin therapy initiation over
time--provides an excellent example of a clinical use case for constrained optimization as long as
one recognizes that constraints in a MDP are implicitly defined based upon allowable transitions
27
The structure of the model reflects shared decision-making by providers and patients over time
as a function of patient age, patient clinical history, and several health states. History is
dependent on CHD or stroke, as well as nine cholesterol levels pertaining to low, medium or
high HDL and LDL levels. Patient information aligning with the data across three major heart
studies provides much higher sensitivity to the proper time to initiate and maintain a statin
regimen. The MDP model determines the optimal decision at each epoch, to maximize the
overall rewards while accounting for costs of all future states.
Reward function: where t is a time index for
discrete decision epochs, is an index for states at time period T is the statin
treatment decision at time T, discounts the objective function depicting reduced
value of rewards in future years, and is the number of years in a decision epoch.
Reward function for each time period:
where ND reflects the number of years in a
decision epoch, is the monetary value of quality adjusted life years
t is the annual cost of statin treatment in period is the annual follow up care cost of stroke in period
is the annual follow up care cost of
CHD event in period CS(sT) is the one time cost of stroke occurring in period t.
Reward function for final time period:
, where
is the post-decision horizon expected reward. The authors separate the time
28
during the decision horizon, the rewards from the post-decision horizon still need to be included.
For instance, while the decision to initiate statin therapy is only until age 80, the rewards of
treatment after age 80, need to be included in the model.
Model Development
The starting age of the patients in the model was 40, and it was assumed that the patients could
start statin treatment at any point between 40 and 80 in 2-year increments. If all these treatment
options were modeled as separate scenarios, as is common in both clinical trials and economic
evaluations, the problem would soon become quite complicated, especially if these treatment
options were compared incrementally.
However, using optimization techniques, one can identify a “single” optimal age for initiating
statin treatment that maximizes the ‘reward’ function. The authors interpreted reward in terms of
expected net monetary benefit E(NMB) as a function of quality-adjusted life years (QALYs),
Cost and willingness-to-pay threshold ( ), that is:
E(NMB) = QALYs* – Cost (9)
Model Validation
The authors do not describe the model validation process, although it is clear from the
manuscript’s acknowledgements section that the authors interacted extensively with experts
within the clinical system where the research was conducted, as well as with external reviewers.
Select Optimization Method
The problem is set up using a MDP. The MDP framework is intended for dynamic streams of
29
indices for decision epochs. Each decision in the stream guides the evolution of the system
being modeled (typically the patient’s health in medical applications) and may enable or
foreclose further decisions. The patient’s health at each time point is typically the state, and the
decisions or actions are identified. MDPs can be considered as a hybrid between a Markov
model and a decision tree.
Just as in Markov models, in an MDP, a patient’s health state changes over time, transitioning
from one discrete state to another according to a specified matrix of probabilities. However,
typically in a Markov model, the decision maker has a choice between two or more treatment
regimens to start the patient on initially. By contrast, in an MDP, the decision maker can make a
choice about treatment in every time period. Thus, it is possible to model at a more granular
level. At each time point, one may decide to start, stop or switch treatments, for as long as the
patient survives. The constraints may involve the changes in states and/or the decisions. The
transition from one state to another is characterized probabilistically.
In this study, the critical decision is when to start statins. Starting statins is taken to be a one-time
irreversible decision. Thus, in each time period from age 40 to death - or age 80 - there is a
binary “start” or “delay” decision. Much of the complexity of the model is in the modeling of
the health states. There are 324 health states describing various combinations of cholesterol and
high-density lipoprotein levels (3 each), as well as stroke and CHD states (6 each).
Transition probabilities are parameterized based on a proprietary clinical database. The
objective function is a combination of health sector costs—such as the cost of treatment
30
discounted over time. The risk of adverse events is modeled, for comparison through three
third-party risk models.
Different risk-prediction models have estimated probabilities of T2D complications in patients
based on sociodemographic and environmental risk factors. These predictive models can specify
the type of treatment to reduce the risk of comorbidity. The most common validated risk models
from several large studies are the United Kingdom Prospective Diabetes Study (UKPDS), the
Framingham Heart Study (U.S.) and Archimedes, based on data trial results from the Heart
Protection Study of 2002.
In particular, the article Optimizing the start time of statin therapy for patients with diabetes[3]
aimed to identify the optimal decisions for individual patients based on their attributes including
age, gender, total cholesterol and high-density lipoprotein (HDL). The authors also performed
the analyses using the predictions from each of the three risk models above. Because the choice
of the risk model may impact the treatment decision, they noted that the predictions from the
models could be different.
Performing optimization
The solution method is based on a backward induction approach starting with the last epoch .
Knowing the optimal future actions, the optimal decision at the current epoch can be established
using recursive optimality in the following equation.
Recursive optimality: max
Where
31
Decision variable:
Sensitivity Analysis
Where uncertainty in the model existed based on recommended statin starting therapy, the results
of the optimization approach were tested for the low, medium and high cost of statins across
willingness-to-pay threshold ranging from $25,000/QALY to $100,000/QALY in $25,000
increments. This additional analysis provides insight into the value of the model
recommendations, and whether the recommendation results from using a low- or high-value
proposition as a starting point. The model was also calibrated to best-available data from that
time when statins did not have as much information on long-term effectiveness. Given that
post-market knowledge of statin effectiveness is greater now than in 2009, these results express
uncertainty where greater knowledge now exists.
Report Results
The MDP model also unifies results across the three risk models, where there is noticeable
variability in recommended treatment between studies. The Framingham model determines never
to initiate statins for three of the nine metabolic states. The Archimedes risk model does not offer
statin start points for all metabolic states, and predicts statin starting points based on statistical
inference rather than by generalizable samples of patients, making the model prone to statistical
32
In contrast, the UKPDS and Framingham risk models fit smoothed Weibull distributions across a
well-defined population sample. The UKPDS and the Framingham model, give numerically
different, but qualitatively similar optimal statin start time results. However, using the
Archimedes risk model in the optimization did not produce a smooth pattern for initiating statin
therapy as observed with the UKPDS and Framingham models. The authors attribute this to
“statistical error” associated with the Archimedes estimates.
The study demonstrates the value of the MDP framework, providing insight into when to start
statin treatment. As one would expect, the model generally shows that statins should be started
earlier for more severely ill patients. Exactly how early depends on the severity of the patient’s
condition, but also on model parameters and which risk model is used. Interestingly, for less
severe and elderly patients, from the results of Figure 2 in the article, it seems that it may not be
worthwhile starting statin therapy at all. Women are in general recommended to start statin
treatment later than men.
Decision Making
The study is an example of how the MDP modeling approach can provide personalized and
clinically relevant recommendations (for patients of type x, start statins at age y) and integrate
and compare different data sources and risk models. As there are many questions about the right
time to start, stop and switch treatment in medical care, this seems an underused and highly
33
Traditional health services research methods focus on efficacy and/or cost-effectiveness at a
snapshot in time to inform decisions, MDP provides an in-depth modeling and understanding for
optimal decisions at multiple time points over the patient’s disease history. Due to the nature of
the modeling, it provides the ability to personalize decisions, as opposed to one-size-fits-all
policies and guidelines established for medical decisions. However, similar to other approaches,
MDPs have assumptions based on data and/or the structure of the model. Once the results are
obtained, sensitivity analyses can be performed (e.g., for some range of variation in the transition
probabilities). Once satisfied with the solution, translation is in the form of guidelines and/or
decision tools. Owing to the modeling and computational nature of the MDPs, they can easily be
translated into decision support systems to use in practice.
This example showed the use of MDP for optimizing the start time of statin therapy. MDPs can
be used for other similar decision-making problems for breast or prostate cancer screening, the
decision for biopsy, initiating HIV therapy treatment policies, etc. The underlying theme is
focusing on decisions over time, with decisions at one point affecting future states and decisions
operating under constrained resources. The results of the optimization models can help establish
optimal clinical guidelines [35].
5. Conclusion
In this second report, the task force’s primary objective is to provide an overview of areas where
optimization methods can be applied and describe three case studies illustrating the application
of constrained optimization methods to critical clinical and health policy questions. The cases
illustrate several major variants of these methods and demonstrate their potential in
34
In the first case study, linear programming methods were used to identify the optimal mix of
HPV vaccination and screening to minimize the number of cervical cancer cases subject to a
budget constraint. Similarly, in the second case study, MDP and dynamic programming were
used to identify the optimal time to initiate statin therapy in type-2 diabetes patients. The first
two case studies describe the translation of the original problem into its mathematical
formulation, its estimation, interpretation, and use. In contrast, the third is an educational case
that allows the reader to work through the formulation of a constrained optimization problem
using the ISPOR Constrained Optimization Good Practice Checklist.
The healthcare sector faces major challenges with regards to appropriate diagnosis and treatment,
allocation of scarce resources, designing policies, etc. These methods provide an approach for
finding optimal solutions to complex problems in the face of constraints. As such, they are
complementary to and build on the health economic models and simulation methods that are
widely used to guide clinical and policy decision making.
Constrained optimization methods can improve the current reimbursement decision-making
processes, which take the budget constraints partially into account. In the constrained
optimization framework, budget constraints can be incorporated explicitly, together with other
types of constraints, like human resource or geographical equity constraints. In addition, when
there are numerous treatment options available for treating patients with a specific condition,
constrained optimization might prove to be an efficient method for developing treatment
protocols or guidelines compared to the classical economic evaluation framework.
In the current healthcare landscape, health economic modeling is widely used to make
reimbursement decisions for new technologies, particularly outside the United States.
35
beyond the reimbursement decision itself including the best way to integrate the new technology
with the health-care delivery system, as well as in technology disinvestment decisions. These are
becoming crucial as personalized medicine and performance-based payment concepts become
more common.
It is important to recognize that application of constrained optimization methods in healthcare is
still an emerging area and that there are some challenges that must be addressed. Constrained
optimization methods can be limited by data availability and quality, and validating an
optimization model can be challenging. Choosing and applying the appropriate method can be
difficult and require specific expertise. Interpreting results and knowing which solution
algorithm is likely to be best requires a level of methodological understanding and
sophistication.
However, despite these obstacles, the application of constrained optimization methods to health
care decision making offers substantial potential benefits which make them a valuable addition
to the arsenal of analytic methods at the disposal of the researcher. Approaching a problem in
the context of mathematical optimization forces modelers to identify and quantify the endpoint
that they are trying to accomplish. But most importantly, constrained optimization takes into
account the limits placed on the solution by real-world factors such as budgets, availability of
treatments, staffing capacity, and patient characteristics. As a result, the identified optimal
solution is much more likely to be feasible to implement.
In a disease management problem, by treating patients optimally, we have the potential to
improve population health and enhance the value associated with health care expenditure. For
individual patients, this means providing treatment with the proper therapy faster. For
36
performance of their medical practice, and offer more efficient health care delivery. The task
force hopes that these two reports will encourage modelers to explore the use of optimization
methods and looks forward to seeing more published optimization applications and the
development of further guidelines and resources as the use of these methods becomes more
widespread.
APPENDICES 1 & 2 – See separate document.
Appendix 1 – Educational Case
37 References
1. Crown W, Buyukkaramikli N, Thokala P, et al. Constrained Optimization Methods in Health Services Research-An Introduction: Report 1 of the ISPOR Optimization Methods Emerging Good Practices Task Force. Value Health. 2017;20(3): 310-319.
2. Demarteau N, Breuer T, Standaert B. Selecting a Mix of Prevention Strategies against Cervical Cancer for Maximum Efficiency with an Optimization Program. Pharmacoeconomics. 2012; 30(4):337-353.
3. Denton BT, Kurt M, Shah ND, Bryant SC, Smith SA. Optimizing the start time of statin therapy for patients with diabetes. Med Decis Making. 2009;29(3):351-367.
4. Stinnett AA, Paltiel AD. Mathematical programming for the efficient allocation of health care resources. Health Econ. 1996;15(5):641-653.
5. Airoldi M, Morton A, Smith JA, Bevan G. STAR--people-powered prioritization: a 21st-century solution to allocation headaches. Med Decis Making. 2014;34(8)965-975.
6. Martello S, Toth P. Knapsack problems: algorithms and computer implementations. 1990: John Wiley & Sons, Inc.
7. Weinstein, M. and R. Zeckhauser, Critical ratios and efficient allocation. Journal of Public Economics, 1973. 2(2): p. 147-157.
8. Thokala P, Dixon S, Jahn B. Resource modelling: the missing piece of the HTA jigsaw? Pharmacoeconomics. 2015;33(3):193-203.
9. Castillo-Chavez C, Feng Z. Global stability of an age-structure model for TB and its applications to optimal vaccination strategies. Math Biosci. 1998;151(2): 135-154.
10. Juusola JL, Brandeau ML. HIV Treatment and Prevention A Simple Model to Determine Optimal Investment. Med Decis Making. 2016;36(3):391-409.
11. Lee EK, Yuan F, Pietz FH, Benecke BA, Burel G.Vaccine prioritization for effective pandemic response. Interfaces. 2015;45(5):425-443.
12. Mauskopf J, Connolly M, et. al. , Economic Analysis of Vaccination Programs: An ISPOR Good Practices Task Force. Value Health, 2018.
13. Marshall, D.A., et al., Selecting a dynamic simulation modeling method for health care delivery research Part 2: report of the ISPOR Dynamic Simulation Modeling Emerging Good Practices Task Force. Value in health, 2015. 18(2): p. 147-160.
14. Marshall DA, Burgos-Liz L, IJzerman MJ, et al.Applying Dynamic Simulation Modeling Methods in Health Care Delivery Research-The SIMULATE Checklist: Report of the ISPOR Simulation Modeling Emerging Good Practices Task Force. Value Health. 2015;18(1):5-16.
15. Dimitrov NB, Meyers LA. Mathematical approaches to infectious disease prediction and control. JJ Hasenbein, ed. INFORMS TutORials in Operations Research, 2010. 7: p. 1-25.
16. Roth AE, Sotomayor M. Two-sided matching. Handbook of game theory with economic applications, 1992. 1: p. 485-541.
17. Bertsimas D, Farias VF, Trichakis N. Fairness, efficiency, and flexibility in organ allocation for kidney transplantation. Operations Research. 2013;61(1):73-87.
18. Puterman ML. Markov decision processes: discrete stochastic dynamic programming. 2014: John Wiley & Sons.
19. Shechter SM, Bailey MD, Schaefer AJ, Roberts MS. The optimal time to initiate HIV therapy under ordered health states. Operations Research. 2008;56(1):20-33.
20. Chhatwal J, Alagoz O, Burnside ES. Optimal breast biopsy decision-making based on
mammographic features and demographic factors. Operations research. 2010;58(6):1577-1591. 21. Tosh J, Stevenson M, Akehurst R, Strong M. Simulation optimisation of Treatment Sequences for
38
22. Lee EK, Wu TL. Disease diagnosis: optimization-based methods Disease Diagnosis: Optimization-Based Methods, in Encyclopedia of Optimization, C.A. Floudas and P.M. Pardalos, Editors. 2009, Springer US: Boston, MA. 753-784.
23. Liberatore MJ, Nydick RL. The analytic hierarchy process in medical and health care decision making: A literature review. Eur J Oper Res. 2008;189(1):194-207.
24. Ehrgott M, Holder A, Reese J. Beam selection in radiotherapy design. Linear Algebra Appl. 2008;428(5-6): 1272-1312.
25. Lee EK, Zaider M. Operations research advances cancer therapeutics. Interfaces. 2008;38(1):5-25.
26. Bertsimas D, O'Hair A, Relyea S, Silberholz J. An Analytics Approach to Designing Combination Chemotherapy Regimens for Cancer. Management Science. 2016;62(5):1511-1531.
27. Thokala P, Ochalek J, Leech AA, Tong T. Cost-Effectiveness Thresholds: the Past, the Present and the Future. Pharmacoeconomics. 2018;36(5): 509-522.
28. Lin RC, Sir MY, Pasupathy KS. Multi-objective simulation optimization using data envelopment analysis and genetic algorithm: Specific application to determining optimal resource levels in surgical services. Omega. 2013;41(5): 881-892.
29. Fu MC. Optimization for simulation: Theory vs. practice. INFORMS J Comput. 2002; 14(3):192-215.
30. Barton RR. Metamodeling: a state of the art review. in Proceedings of Winter Simulation Conference. 1994.
31. Eddy DM, Hollingworth W, Caro JJ, et al. Model transparency and validation: a report of the ISPOR-SMDM Modeling Good Research Practices Task Force-7. Med Decis Making.
2012;32(5):733-743.
32. Vemer P, Corro Ramos I, van Voorn GA, Al MJ, Feenstra TL. AdViSHE: A Validation-Assessment Tool of Health-Economic Models for Decision Makers and Model Users. Pharmacoeconomics. 2016;34(4): 349-361.
33. Spall JC. Introduction to Stochastic Search and Optimization: Estimation, Simulation, and Control. 2003. John Wiley & Sons, Inc.
34. Gorissen BL, Yanikoglu I, den Hertog D. A practical guide to robust optimization. Omega. 2015;53:124-137.
39
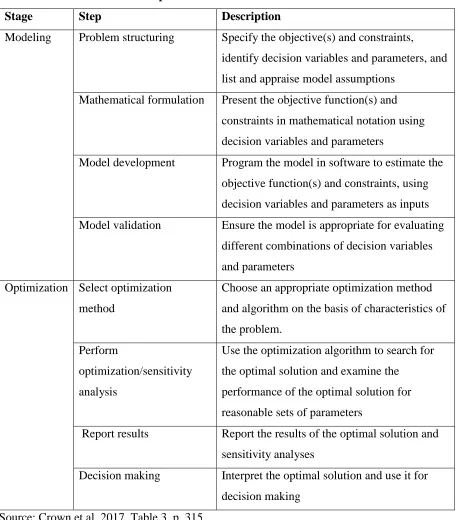
Table 1. ISPOR Constrained Optimization Task Force Good Practice Checklist
Stage Step Description
Modeling Problem structuring Specify the objective(s) and constraints,
identify decision variables and parameters, and
list and appraise model assumptions
Mathematical formulation Present the objective function(s) and
constraints in mathematical notation using
decision variables and parameters
Model development Program the model in software to estimate the
objective function(s) and constraints, using
decision variables and parameters as inputs
Model validation Ensure the model is appropriate for evaluating
different combinations of decision variables
and parameters
Optimization Select optimization
method
Choose an appropriate optimization method
and algorithm on the basis of characteristics of
the problem.
Perform
optimization/sensitivity
analysis
Use the optimization algorithm to search for
the optimal solution and examine the
performance of the optimal solution for
reasonable sets of parameters
Report results Report the results of the optimal solution and
sensitivity analyses
Decision making Interpret the optimal solution and use it for
decision making
40
[image:41.612.75.237.95.301.2]Discrete representation of patient anatomy
Figure 1: Patient anatomy is discretized into voxels, and treatment beams are discretized into