A STUDY OF HEARTRATE VARIABILITY
IN
OFFSPRINGS OF TYPE 2 DIABETES MELLITUS
Dissertation submitted in
Partial fulfilment of the regulations required for the award of
M.D.DEGREE in
PHYSIOLOGY – BRANCH V
THE TAMILNADU MEDICAL UNIVERSITY CHENNAI
MAY – 2019 Department of Physiology
PSG INSTITUTE OF MEDICAL SCIENCE AND RESEARCH, PEELAMEDU, COIMBATORE
CERTIFICATE
This is to certify that the dissertation entitled “A STUDY OF HEARTRATE VARIABILITY IN OFFSPRINGS OF TYPE 2 DIABETES MELLITUS" is an original work done by Dr.S.M. Imthiaz during his post-graduation in Physiology from 2016 to 2019. This dissertation has been done under the guidance of Dr.G.V.LathaDevi, Professor, Department of Physiology, PSG Institute of Medical Sciences and Research, Coimbatore.
Dr.M.Nagashree Dr. G.V.LathaDevi
Professor & HOD Professor
Department of Physiology Department of Physiology
PSG IMS & R PSG IMS & R
Place: Coimbatore Dr. S. Ramalingam
DECLARATION
I hereby declare that this dissertation entitled “A STUDY OF HEARTRATE VARIABILITY IN OFFSPRING'S OF TYPE 2 DIABETES MELLITUS” was prepared by me under the guidance and supervision of Dr.G.V.Lathadevi, Professor, Department of Physiology, PSG IMS&R.
This dissertation is submitted to the Tamilnadu Dr.M.G.R. Medical University in partial fulfilment of the university regulation for the award of MD Degree in Physiology.
ACKNOWLEDGEMENT
All good things come to an end. So is my three year study at the Department of Physiology in PSG IMS & R coming to an end and now it is time to thank all those who had contributed to the completion of my dissertation.
First and foremost I would like to thank God Almighty for helping me to complete my dissertation. Next I would like to express my gratitude to Dr.S.Ramalingam Dean PSG IMS&R for permitting me to do my dissertation in PSG IMS&R.
I would like to place on record my sincere gratitude to Dr.R. Nagashree Head, Department of Physiology, who has always been a great source of encouragement in all my endeavours and I sincerely acknowledge her help in the completion of my dissertation.
My Sincere thanks to all the other staff members of the Department of Physiology, Dr.V.Kannan, Dr.N.Shuba, Dr.Deepalakshmi, Associate Professors, Dr.Vijaya Baskaran, Dr. Divya Rajesh, Assistant Professors for their friendly approach and constant support. My special thanks to Dr.Deepalakshmi for teaching me HRV recording without which this study would have been impossible and Dr.V.Kannan for his kind words and encouragement.
I thank the librarian for helping me to identity books and research articles. My healthfelt thanks to my colleagues for creating a friendly environment to complete my work with ease. My sincere thanks to lab technicians and attenders for their help. A special note of thanks and acknowledgement to Mrs.Vimala Prabakaran, Secretary, Department of Physiology for all her help.
I place on record the help rendered by staff at the Master Health Check-up. PSG IMS & R whose co-operation helped me get patients for my study and I thank the patients who voluntarily lent their support.
I acknowledge my gratitude to PSG IMS&R Ethical and Research Committee for their approval.
CONTENTS
S.NO TITLE PAGE NO
1 INTRODUCTION 1 - 10
2 AIMS AND OBJECTIVES 11
3 REVIEW OF LITERATURE 12 - 26
4 MATERIALS AND METHODOLOGY 27-41
5 RESULTS 42 - 69
6 DISCUSSION 100 – 109
7 CONCLUSION 110 - 111
8 BIBLIOGRAPHY
1
INTRODUCTION
Diabetes Mellitus [DM] is probably one of the oldest diseases
known to man. It was first reported in Egyptian manuscript about 3000
years ago1. It is the most prevalent endocrine and metabolic disease
which affects human beings. The disturbance of carbohydrate, protein
and fat metabolism cause a defect in insulin secretion which can lead to
chronic hyperglycemia causing diabetes mellitus.2
Epidemiological studies
According to the International Diabetes Federation (2010), at least
285 million people in the world have been affected by diabetes and the
number might escalate to 438 million by the year 2030. Out of this two
thirds will be from the low to middle income countries.3
India, the second most densely populated country in the world has
been severely affected by the global diabetes epidemic. As per the
International Diabetes Federation (2013), approximately 50% of all
people with diabetes live in just three countries: China (98.4 million),
India (65.1 million), USA (24.4 million).4
By the end of 2025 ,75 % of the people in the developing countries
2
India.(5)Diabetes is one of the major causes of concern in India as a very
large number of people are affected by diabetes and the number is
increasing every year.It may trigger upto 57.2 million by 2025 and by
2030 nearly 80.9 million Indians will be affected with diabetes6
The risk factors associated with diabetes are stress, insulin
resistance, and increased body mass index, family history of diabetes,
physical inactivity and sedentary life style habits.
Diabetes mellitus is classified generally into 2 types
Type 1 diabetes mellitus which is also known as Insulin Dependent
Diabetes Mellitus [IDDM] is due to defects in insulin secretion. It is an
auto immune disease which causes destruction of the insulin secreting
beta cells in the pancreatic islets.
Type 2 diabetes mellitus which is also called Non Insulin
Dependent Diabetes Mellitus [NIIDM] is caused by reduced sensitivity of
tissues to the metabolic effects of insulin. This is called as insulin
resistance.7
Type 2 diabetes mellitus (Type 2 DM) shows strong familial
aggregation. Increase in age, obesity, and physical inactivity are high risk
factors which result in type 2 diabetes. Nearly 55% of type 2 diabetes
3
an increase in childhood obesity which has resulted in this type of
diabetes mellitus in children and adolescents.8
Type 2 diabetes mellitus and coronary heart diseases are the most
widely spread non communicable diseases in the developing countries.
The spread of Diabetes mellitus has increased in past 30 years in India
due to lack of awareness and illiteracy.9 Type 2 diabetes mellitus is found
to be most prevalent in families with high degree of genetic involvement.
Insulin resistance because of reduced glucose utilization in skeletal
muscle is found to be present in many non diabetic first degree relatives
of type 2 diabetes mellitus patients. It is associated with increased
frequency of human leucocyte antigen alleles. The HLA types DR3 and
DR4 are most commonly associated with diabetes mellitus. Identical
twins are more prone to develop diabetes than others. The risk is around
70-90 percent.10
Risk of developing diabetes is greater in a person if one of the
parents have type 2 diabetes mellitus. The risk increases up to 40%, if
both parents have type 2 diabetes mellitus.10
The pathophysiology of type 2 diabetes mellitus is characterized by
4
glucose production, Obesity-visceral or central is particularly common in
type 2 diabetes mellitus.
Obesity leads to insulin resistance. Circulating levels of insulin
may be normal or increased in such people, yet it is inadequate to control
blood glucose levels due to insulin resistance. Their glycemic status can
be brought to control by weight reduction and antiglycemic drugs, as
insulin resistance can be improved with weight reduction11. A diabetic
patient may have symptoms like visual blurring, polydipsia, polyuria and
polyphagia. The patient may also have marked weight loss in severe
uncontrolled diabetes. If left uncontrolled, the patient may go in for
diabetic ketoacidosis. Negligent attitude, irregular improper drug intake
by the patient or non effective treatment might ultimately result in
diabetic coma and death.
Insulin Resistance
Insulin resistance is due to:-
• Inability of muscle and fat to respond to insulin when there is
increase in glucose and when the liver is unable to respond because
of decreased glucose output.
• Inability of the beta cell to compensate insulin resistance by
5
People are affected by type 2 diabetes mellitus as a consequence of
over eating when combined with obesity and under-activity. Risk of
developing type 2 diabetes mellitus increases 10 fold in people with body
mass index of more than 30 Kg/m2. These diabetics have genetically
impaired beta cell function, lessoned beta cell mass or susceptibility of
beta cell being attacked by toxic substances like free fatty acids or
inflammatory cytokines. 10
Criteria for Diagnosis of Type 2 Diabetes Mellitus:
• Fasting plasma glucose greater than 126 mg/dl or symptoms of
diabetes.
• Random blood glucose greater than 200 mg/dl
•
HbA1c greater than 6.5 percent or post prandial plasma glucose
greater than 200 mg /dl during glucose tolerance test. 10
Heart Rate Variability (HRV)
Heart rate variability measures the time taken between hear beats
and is an effective tool in assessing the autonomic function of the heart.
HRV is also known as RR variability.12
HRV analysis is a non invasive method of assessing cardiac
6
regulating cardiac activity. HRV is most effective in monitoring the
autonomic nervous system (ANS).13 In order to maintain homeostasis of
the cardiovascular system, interactions between the sympathetic and
parasympathetic nervous system becomes integral.14 The balancing action
of the sympathetic nervous system and parasympathetic nervous system
plays a pivotal role in controlling heart rate. Sympathetic over activity
increases heart rate and reduces cyclical beat to beat variation, on the
other hand parasympathetic over activity decreases heart rate and
increases beat to beat variation. 13
Heart rate fluctuations around the mean heart rate reflects the status
of cardiorespiratory control system. HRV is an important tool for
monitoring post infarction condition of diabetic patients.13
HRV is a tool for measuring neurocardiac functions that reflects
interactions between the heart and the brain and the autonomic nervous
system.13
The Role of HRV in Diabetes Mellitus
Uncontrolled diabetes can result in severe autonomic dysfunction
of vital organs and may even lead to sudden death. Diabetic patients have
higher risk of death after acute myocardial infarction than non –diabetic
7
HRV can measure the autonomic activities through low frequency,
an index of sympathetic modulation and of high frequency, an index of
parasympathetic modulation.
HRV analysis helps to evaluate the autonomic cardiac activity in
various pathophysiologic conditions. Any impairment in heart rate
variation is considered to be a marker of autonomic neuropathy in
diabetic subjects.16
Heart rate variability serves as a marker for the autonomic control
on cardiac electrophysiological properties. It also provides information
for accurately determining risk factors.16
HRV analysis is non- invasive, risk free, easy to perform and has
become an effective and vital tool which provides prognostic information
to detect heart diseases.
A healthy heart is not static and changes dynamically with respect
to physiological functions. If variability of RR interval is high then the
functioning of heart is good. The mortality related to cardiac disorders
may rise due to increased sympathetic over activity and parasympathetic
hypo activity. 17
Visceral fat has its action on liver which could result in increase in
8
uptake and its utilization. Cytokines constituting the tumour necrosis
factor and hormones consisting of leptin are secreted from adipose tissue
and could result in interference with insulin action. Through increased
physical activity and dietary restraint the development of type 2 diabetes
mellitus can be prevented.18
Complications of Diabetes Mellitus
The diabetes mellitus complications can be grouped into the micro
vascular and macrovascular complications. Long term complications of
diabetes may lead to retinopathy which may result in loss of vision,
nephropathy which may result in renal failure and peripheral neuropathy
which might result in foot ulcers and amputation.19
Diabetic Neuropathy
Nerve dysfunction as a consequence of diabetes mellitus is known
as diabetic neuropathy. This is due to neurovascular injury which
involves small blood vessels that supply nerve fibres.
Diabetic Retinopathy
Diabetes mellitus is an important cause of preventable blindness in
both the developing and the developed countries. Patients with diabetic
9
Diabetic Nephropathy
Diabetic nephropathy is the most important cause of chronic
kidney disease and End stage renal failure which is a microvascular
complication of diabetes.
Macrovascular Complications of Diabetes Mellitus:
The macrovascular complications of diabetes mellitus are:
• Coronary heart disease
• Peripheral vascular disease
• Stroke 20
In patients having type 2 diabetes mellitus, there is a strong
1.5 to 3 fold rise in the ischemic heart disease mortality.21 Compared
with normal population, 75 to 90 percent of coronary artery disease
patients are prone to have diabetes and it can increase the effects of
other cardio vascular risk factors.22
The commonest cause for mortality in type 1 diabetes mellitus and
type 2 diabetes mellitus are diseases like myocardial infarction and stroke
which can lead to death.22
Haemodynamic and Metabolic Factors
The factors which are required for the development and
progression of complications which are neurovascular in origin in
10
The factors regulating hemodynamic function are Rennin
Angiotensin System (RAS) which could have major role in diabetes
associated atherosclerosis. The endothelial (ET) and urotensin system are
regulated by vasoactive hormone system which could play a major role in
complications which are of macrovascular in nature in diabetes mellitus.
New factors like complement system and tumour necrosis factor related
apoptosis inducing ligand (TRAIL) has a major role in macrovascular
complications.23
Other Complications of Diabetes Mellitus
Poorly controlled diabetes mellitus can result in diabetic
ketoacidosis which is one of the many complications of diabetes mellitus.
It is also characterised by disturbances in the cognition which is one of
the chief symptomatology in neurology. Extreme serum osmalarity and
glucose is seen in conditions like non – ketotic hyperosmolar coma. This
can cause cellular dehydration without ketoacidosis. When excessive
insulin is administered, it results in insulin shock with loss of
11
AIM AND OBJECTIVES
PRIMARY OBJECTIVE:
• The aim of the study is analyse the Heart Rate Variability in 60
offsprings of type 2 diabetes mellitus.
• To analyse HRV in 30 offsprings of type 2 diabetes mellitus,
who are not diabetics [control group].
• This HRV analysis is compared with 30 offsprings of type 2
diabetes mellitus, who are diabetics [study group]
SECONDARY OBJECTIVE :
• Comparison of HRV with other parameters like lipid profile, blood
glucose, glycosylated haemoglobin, B.M.I between study and
12
REVIEW OF LITERATURE
As a consequence of increased globalization and urbanization there
is a massive increase in the epidemic of T2DM. International Diabetes
Federation (IDF) 2013 has stated, 85% to 95% of all diabetics are T2DM
in high income nations and the percentage is further high in low and
middle income nations.25
According to a survey taken in 2004 by Wild et al. the number of
people affected by diabetes is 31.7 millions and the expected rise in 2030
is 79.4 millions.26
Shabana Tharkar et al. assessed the pattern of diabetic cases in
India. Their research was focused on how far the research on diabetes
was implemented in clinical practice in India. Their conclusion was that
there was a wide gap between translation of research findings and
recommendations and their implementation during practice at all levels of
health care in India. 27
Autonomic Nervous System
The most important part in homeostasis is played by autonomic
nervous system. It is only through this system that the unconscious neural
control mechanisms operating in the body is affected. This system has the
13
muscle of the GI tracts and glands throughout the body. The autonomic
nervous system can be controlled through centrally diffused modulating
systems like brain stem, limbic system and frontal lobes which regulate
the arousal and background behavioural responses to threat. The output of
the autonomic nervous system is divided into two divisions, the
sympathetic and parasympathetic system. 28
A great number of visceral organs are innervated by both
sympathetic and parasympathetic nerve fibres. The sympathetic and
parasympathetic nerve fibres always exert opposite effects in a particular
organ, this ongoing activity is referred to as sympathetic tone or
parasympathetic tone or tonic activity. The activity of one division can
dominate the activity of the other under any given circumstance. There
will be sympathetic dominance for a particular organ when the
sympathetic fibre’s amount of firing to that organ increases above the
toxic level, and when this is coupled with a simultaneous decrease in the
parasympathetic fibre’s frequency of action potential to the same organ.
The reverse circumstances can also hold good for the parasympathetic
dominance when there is massive wide spread discharge taking place
more frequently in the parasympathetic system than in the sympathetic
14
Both the divisions are reciprocally controlled by the autonomic
nervous system which acts as a regulator of visceral activities usually
outside the realm of consciousness and voluntary control in activities like
circulation, digestion, sweating and pupillary size. However it cannot be
entirely said that an individual does not have control over the activities of
autonomic nervous system (ANS).29
Hypothalamus and Autonomic Nervous System (ANS)
The hypothalamus can integrate the information sent from brain
and the body. It is only through this activity the individual adapts to the
environment and the species. Consequently other functions are regulated
by neuroendocrine and autonomic hypothalamic process along with
appropriate behaviour that is mediated by neuronal influences on the
other areas of brain. There are various hypothalamic systems that have
control over metabolism, circulation and the immune system.
As these systems are very important for survival, their function
could be highly dependent on one another’s performance and they often
have similar hypothalamic structures. The system's function which could
be influenced by various factors such as time of the day, stress, sensory,
autonomic feedback and by various hormones circulating in the
circulation. These systems can interact by the influence of
15
rhythm over the body by communicating through three different routes of
communication
• By the secretion of hormones
• By the parasympathetic effect
• By the sympathetic autonomic nerves control
Thus hypothalamus which is present in the brain stem plays an
integral role in coordinating autonomic, somatic, endocrine, emotional
response and other states of behaviour. Different stimuli could result in
changes in their responses of autonomic activity in the body, which can
be influenced by the prefrontal association cortex by its involvement of
emotional expression characteristic of an individual. Persistent chronic
alterations in a state of mental stress or transitory physiological
alterations under the sympathetic and parasympathetic limb activities can
create imbalance between the limbs resulting in pathophysiological
variants of various diseases.30
The activation of sympathetic system can result in flight or fight
response which could result in increase in heart rate, constriction of blood
vessels and increase in blood pressure. The slowing of heart rate due to
parasympathetic activity can stimulate vasodilation of blood vessels
16
Heart Rate Variability (HRV) and Respiratory Sinus Arrhythmia
(RSA)
The assessment of HRV has been widely practised in various
diverse group of disciplines. During inspiration the heart rate increases
and during expiration it decreases. Contribution of RSA to HRV can be
measured as the high frequency (HF) components of variation in
consecutive RR intervals or ECG31.The measurements of vagal nerve
trafficcant cannot be measured directly. Stephen Hales and Von Haller
first observed the rhythmic variation of heart rate.32 The application of
HRV is used in different fields in medicine and surgery.
The significance of vagal cardiac innervation which regulate the
heart rate variability was first recognised by Wheeler and Watkans. The
reduction or loss of beat to beat HRV in diabetics was observed and
recorded by them.33
Physiologic Aspects of HRV
Heart rate variability is due to variation in cardiac activity at rest
during the respiratory cycle (respiratory sinus arrhythmia). The other
factors like exercise, environmental factors and circadian rhythm could
also contribute towards it. The beat to beat variations occurring in entire
17
variability (HRV). The synonyms used for HRV are RR Interval
tachogram and RR variability.
Classification of Heart Rate Variability
They are classified as :
• Time domain measures
• Frequency domain measures
The time domain measures is used for assessment of overall
magnitude of HRV. This domain does not help in appreciating finer
aspects of variation in heart beats but this domain can be easily assessed.
The assessment of spectral power analysis helps in finding the
instantaneous heart rate variation. Frequency domain measures is used for
achieving a more precise assessment of autonomic function in both the
experimental and clinical settings. The five minute lead II ECG helps in
plotting RR tachogram to its frequency spectrum. It can be done using
fast fourier transformation or auto regressive modelling. The entire
frequency spectrum is 0 to 0.4 Hz .31
Classification of Power Spectrum Analysis
The power spectral analysis of heart rate variability can be
18
• High frequency band width measuring 0.15 to 0.4 Hz
• A low frequency band width measuring 0.04 to 0.15Hz
• A very low frequency band width measuring 0 to 0.04Hz34
HRV in other Studies
The fact that autonomic nervous system influences the heart rate
has been quoted in the European Heart Journal, task force of the
European society of Cardiology guidelines. The autonomic nervous
system controls the heart rate and rhythm although the cardiac auto
rhythmicity could be intrinsic to various pace maker tissues35.
Noma A, Trautwein W et al did research study on rabbits sinoatrial
node and found out that vagus nerve innervating it, release acetyl choline
which results in potassium efflux causing hyperpolarization. Acetyl
choline inhibits the hyperpolarization activated pacemaker current. 36
Chess GF, Tam RMK reported in their research study that
parasympathetic nerve innervating the SA node is dominant, the acetyl
choline released from the vagal nerve endings decrease the release of
norepinephrine from the sympathetic nerves. So a balance of
19
Levy MN had showed in his work that interactions between
parasympathetic and sympathetic systems proved that there could be
vagal tone during resting condition. 38
Akselrod et al have stated in their paper that the variation in the
RRinterval at resting condition indicates that there is finetuning in the
mechanism that controls variations in heartbeat.39
Schwartz PJ, et al had found out in their study on cats that
excitation always evoked a clear reduction in the discharge of cardial
vagal units and a clear increase in the discharge of cardiac sympathetic
fibres .40
Ahsan H Khandoker et al in their study on T2DM with
complications like, nephropathy, peripheral nephropathy and retinopathy
and found out the autonomic imbalance was more depending on type and
severity of complications due to diabetes. They also emphasized how the
treatment has to be improved and advanced based on the complications.41
Vadim .V. Klimonto V et al conducted a study on sixty seven
women with type 2 diabetes, out of which 46 patients had cardiovascular
autonomic neuropathy who underwent simultaneous continuous glucose
20
indices and found out fasting state is preferable for HRV estimation when
compared to postprandial state. 42
Ana Leonov Rivera et al conducted a study on 75 subjects who
were recently diagnosed to have diabetes and 75 long standing diabetic
patients. In this study they recorded the HRV and blood pressure in
different positions-supine, standing and controlled breathing test and
found out the reduction of HRV in diabetic patients, who had a increased
risk of mortality. 43
S.K.M. Azizul Islam et al in their study on “Association between
diabetic peripheral neuropathy and heart rate variability in subjects with
type 2 diabetes”, revealed, that parasympathetic activity was reduced with
increased diabetic peripheral neuropathy severity in male individual,
suggesting foot examination would be helpful in identifying patients at
risk of cardiac autonomic neuropathy. 44
Claudio de Angelis et al in their study “Modified Autonomic
Balance in offsprings of Diabetes detected by Spectral Analysis of Heart
Rate Variability” found an alteration in activity in healthy offsprings of
non-insulin dependant diabetes mellitus (NIDDM) patients with an
increased sympathetic tone and a decreased parasympathetic tone. This
finding was clinically preceding glucose intolerance and they stressed
21
measures of power such as spectral analysis of HRV is performed in
normal subjects.45
Stuckey MI and Petrella R.J in their study on “Heart Rate
Variability in Type 2 Diabetes Mellitus.” considered exercise as an
important component to T2D prevention and treatment strategies. The
most pronounced changes in HRV were realized following the exercise
intervention with the greatest frequency of supervised session and with
the greatest intensity and duration of exercise bouts. These findings
suggest that exercise following current American College of Sports
Medicine/ American Diabetes Association guidelines may be important in
the prevention and treatment of T2DM to improve autonomic function
and reduce the risk of complication and mortality.46
Stavroula Kalopita et al in their study on “Relationship between
autonomic nervous system function and continuous interstitial glucose
measurement in patients with type 2 diabetes” examined whether there
was relationship between autonomic nervous system function and
glycaemic variability (GV) in patients with type 2 diabetes mellitus. In
this study it was shown for the first time that GV calculated during a 24
hours continuous glucose monitoring system and ECG Holter monitoring
system indicating autonomic dysfunction was present in T2DM even in
22
Jaakko Tuomilehto et al in their study on subjects with impaired
glucose tolerance showed how to prevent T2DM by life style
modification. The research study was conducted among 522 middle aged
over weight subjects (men & women) revealing improvement of glucose
tolerance and reduction in the magnitude of cardiovascular risk factors
thereby preventing or postponing the onset of T2DM. 48
A Fiorentini et al in their study on “Circadian rhythm of autonomic
activity in nondiabetic offsprings of type 2 diabetic Patients” evaluated
heart rate variability (HRV) with 24 hours ECG Holter monitoring
apparatus and found out reduction of autonomic nervous system function
if the offsprings are insulin resistant.49
HRV and DIABETES MELLITUS
Autonomic impairment in diabetes mellitus shows clinical
manifestations long after the onset of the disease, but subclinical cardiac
autonomic neurapathy measures could be detected by HRV very early
much before the clinical manifestation of the disease. Reduced HRV can
be associated with inflammation of adipose tissue and carotid artery
atherosclerosis, in type 2 diabetes mellitus 50.
People having post parandial elevated blood glucose before the
23
produce further decline in parasympathetic tone, enhancing sympathetic
tone during progression of pre diabetic state to type 2 diabetes mellitus.51
HRV shows standard deviation of NN (SDNN) measures of both
sympathetic and parasympathetic modulation, and root mean square of
successive differences (RMSSD). It is strongly backed by research and is
generally considered the most accurate measure of autonomic nervous
system activity.
Stucky M.I et al in their findings showed that the patients with low
HRV have an increased prevalence of complications and risk of mortality
compared with those with normal autonomic function. These findings
provide support for the use of HRV as a risk indicator in T2DM.
46
Thomas Benichou et al conducted a systematic review and meta
analysis to evaluate the impact of T2D on HRV parameters. They
concluded that T2DM was associated with an overall decrease in the HRV
of T2DM patients. Both sympathetic and parasympathetic activity were
decreased which can be explained by the deleterious effects of altered
glucose metabolism on HRV leading to cardiac autonomic neuropathy.52
John Mukesh Raja Arumugam and Annapoorna Mary in their study
on “Heart Rate Variability a cardiac indicator in diabetic autonomic
24
research articles and concluded that the existing literature support that
HRV is an effective cardiac indicator to predict cardiac morbidity and
mortality among diabetes mellitus patients.53
HbA1c and Diabetes
HbA1c measures are commonly referred to as glycosylated
haemoglobin. The binding of hemoglobin with glucose in the blood is
called glycosylated haemoglobin. It measures the average glucose
concentration in the plasma. In diabetes mellitus, the amount of HbA1c is
high referring to a poor control of blood glucose levels.54
The increase in glycosylated haemoglobin level can be associated
with increased risk of developing cardiovascular complications of DM.
The HbA1c level monitoring in type 2 diabetic patients may show more
improvement in the outcome of disease. Normal blood glucose represents
a normal amount of HbA1c level in blood. When plasma glucose level
rises then the level of HbA1c will also increase.
54
HbA1c can measure the average blood glucose level in past three
months. Hence the % of HbA1c is mainly determined by the level of
plasma glucose and the lifespan of RBC.55 The measurement of
glycosylated haemoglobin level is high in not only diabetic patients but
25
which is measured by ion exchange chromatography. In anaemic patients
with autoimmune haemolytic anaemia, the measurement of glycosylated
haemoglobin cannot be detected.
The American Diabetic Association recommended glycosylated
haemoglobin test atleast twice in a year for those who achieve treatment
target and four times a year those who are not meeting the treatment
target.56 Other than regulating glycemic control, the value of glycosylated
haemoglobin shows improvement in the communication and
collaborative efforts between patients and clinicians.57
Mody is a non insulin dependent form of diabetes occurring in
young adults at an age of 25, it is an autosomal dominant inherited
disorder occurring due to gene mutation.58
Obesity, physical inactivity and sedentary life style are the
etiological agents for the development of type 2 diabetes mellitus. About
two thirds of type 2 diabetes mellitus individuals are overweight or obese,
if the BMI is greater than 23 kg/m2, if the BMI is greater than 40 kg/m2
then there is 40 to 90 times higher risk of developing diabetes mellitus.59
Truncal obesity can lead to visceral fat accumulation which can also
26
Obesity, genetic factors, and low birth weight are risk parameters
for the development of insulin resistance, when an individual becomes an
adult.62
The predominant function of insulin is to lower blood glucose
levels by favouring its movement into the cells. The other activities are
lipogenesis, protein anabolic action and regulation of ANS. Resistance
can develop to its action.61 ‘The hyperinsulinaemic, euglycaemic clamp’
method is a technique to measure insulin resistance. Sensitivity of insulin
is relatively low in type 2 diabetes mellitus.58
Insulin inhibits platelet aggregation and also cause vasodilation of
large arteries. So insulin resistance can predispose to atherothrombotic
vascular lesions which is a major cause of mortality in type 2 diabetes
27
MATERIALS & METHODOLOGY
Ethical Clearance
Ethical clearance was obtained from institutional Human Ethics
Committee PSG IMS & R, Coimbatore.
Study Design
This cross sectional study was conducted in the department of
physiology, PSG IMS & R, Coimbatore.
Sample Size
After taking informed consent, a sample size of 60 type 2 diabetes
mellitus was analysed for HRV analysis.
30 control group without diabetes mellitus (Offsprings of type 2
diabetes mellitus)
30 study group with diabetes mellitus (Offsprings of type 2
diabetes mellitus)
Study Population & Place of Study :
Study population within the age group of 30 to 70 years males and
females were recruited from Master Health Check-up PSG IMS&R,
28
Methodology
60 type 2 diabetes mellitus subjects were assessed according to the
data collection tool attached in the annexure. The data collection tool is a
protocol that has general information like name, age, sex, occupation ,
height, weight, treatment history, family history, personal history (alcohol
/ smoking, tobacco chewing), blood pressure, duration of diabetes and
diabetic complications .
To analyse HRV in 30 offsprings of type 2 diabetes mellitus who
are not diabetics. They serve as a control group. This HRV analysis is
compared with 30 offsprings of type 2 diabetes mellitus who are
diabetics and they serve as study group.
Inclusion Criteria
• Offsprings of type 2 diabetic patients without DM (control group)
• Offsprings of type 2 diabetes with diabetes mellitus (study group)
• Age group 30 – 70 years
Exclusion Criteria
• Hypertension
29
• Rheumatoid arthritis
• Any cardiac illness
• Bronchial asthma
The blood parameters like fasting blood glucose, postprandial
blood glucose, lipid profile status and HbA1c values were collected from
Master Health Check-up clinic of PSG IMS & R, Coimbatore.
The other physiological variables like sex, height and weight of the
individual, duration of diabetes, age of onset will also be noted. The body
mass index is then calculated.
Glycosylated Haemoglobin (HbA1c)
Long term blood glucose control can be measured and monitored
by an important method called HbA1c. The non-enzymatic glycation of
haemoglobin is due to prolonged elevated blood glucose level. This
gives a clear idea about the patients glycaemic control over the previous
2- 3 months. All individuals with diabetes mellitus should be tested for
HbA1c during their initial evaluation and as a part of their package along
with other investigations like lipid profile and blood glucose for Master
30
• Long term complications of diabetes mellitus can be detected by
HbA1c
• HbA1c values should mimic the short term values of blood glucose
level.
• Diabetes Mellitus is defined as values of HbA1c greater than 6.5 %
(Pulse 2010)
• HbA1c values less than 7.5 is referred to as good control.
• HbA1c values in between 7.5 – 9.5 % are referred to as poor
control.
• HbA1c values of greater than 9 % is referred to as very poor
control.
Patients with adequate glycaemic control were told to check HbA1c
value twice a year. Patients who were not having adequate glycaemic
control were told to check HbA1c values every three months.
In my study, comparison of HRV analysis with other parameters
like lipid profile, blood glucose, glycosylated haemoglobin, Body Mass
31
Body Mass Index (BMI)
Standing height was measured on a clinic standiometer. Body
weight was assessed using a calibrated weighing scale, with subjects
using light clothes and no shoes. BMI was calculated as weight in
kilograms divided by square of height in meters 64. They were further
classified as per Indian council of medical research classification.
Underweight <18.5 kg/m2, 18.6 to 24.9 kg/m2 is normal. 25 to 29.9 kg/m2
is considered overweight and above 30 kg/m2 is considered obese 65
The subject’s venous blood was collected by asking them to be in fasting
for 12 hours. The serum was separated by centrifuging the blood sample
at 3000 revolutions for 5 minutes. The enzymatic calorimetric analysis
was done for the lipid profile parameters like cholesterol, triglyceride,
LDL and HDL. The blood glucose levels were estimated by glucose
oxidase method.
HRV Procedure
The basic principle is that beat to beat variation in SA nodal
discharge as recorded by ECG is computed and analysed by the software
32
Requirements
• All equipment equipped as required for an ECG recording
• Software with the computer required for H-R analysis.
Methods
HRV can be quantified in time and frequency domain using the RR
intervals in the 5 min lead 2 ECG. The RR- Tachogram is plotted.
There are two types of HRV recordings : the short term 5 minutes
HRV recording and day and night long term HRV recording. Though
long term HRV recording is the ideal one, short term HRV recording is
usually performed for research and clinical investigations.
The procedure of short term recording as depicted in the Task Force
Report on HRV.
• The subject is asked to lie down comfortably in supine position in
the laboratory, and ECG electrodes are connected for lead 2 ECG
recording.
• Positive electrode was connected to left arm, negative electrode
was connected to right arm.
33
• All the subjects were recorded baseline ECG and exclusion of
abnormal baseline ECG was done .
• After 5 minutes of supine rest, ECG signals are acquired at a rate
of 1000 samples/ second during supine rest using data acquisition
system, such as BIOPAC MP 100 (BIOPAC INC, USA),
(Minimum 250 HZ sampling rate)
• The raw ECG signals and the RR Intervals are acquired on a
moving time base.
• Data from BIOPAC are transferred to a windows – based PC
loaded with software for HRV analysis, such as acknowledge
software version 3.8.2 Ectopics and artefacts are removed from the
recorded ECG.
• RR Tachogram is extracted from the edited 256 sec ECG Using the
R wave detector in the acknowledged soft ware and saved in ASC-
2 format, which is later used offline for short – term HRV analysis
(RR tachogram should have minimum 288 RR intervals)
• HRV analysis is performed by using the HRV analysis software
34
Following parameters will be analysed after recording HRV:
• Time domain method
• Frequency domain method
This method is based on the analysis of beat –to-beat variations or
NN intervals.
Selective Time Domain Measures of HRV Analysis:
The time domain measures includes the variable such as
• Mean RR Interval(NN)
• Mean HR Interval
• SDNN
• pNN50
• RMSSD
Selective Frequency Domain Measures of HRV Analysis:
The Frequency domain measures includes the variable such as
• Total Power
35
• HF Power ( High Frequency Power)
• LF Norm
• HF Norm
• LF/HF Ratio
Selective Time Domain Measures of HRV Analysis
The time domain measures including the variable such as
• Mean RR Interval(NN)
This could measure the average of all NN Intervals. Mean RR
interval is inversely proportional corresponding to mean heart rate
in a given physiological state which could show sympathovagal
imbalance.
• SDNN(unit= ms)
Standard deviation of all NN intervals could represent the measure
of total variability
When it represents for a low period of time, it could measure HRV
36
• RMSSD (unit= ms)
• The square root of the mean of the sum of the squares of the
differences between adjacent NN intervals.
This could show high frequency variation in heart rate and
indicates a vagal response.
• SDNN index(unit= ms)
Mean of standard deviation of all NN intervals for all 5 min
segments of the entire recording.
• PNN50 %(unit= ms)
NN50 count divided by the total number of all NN intervals.
Frequency Domain Methods:
• Heart rate variability is assessed by spectral analysis of an array of
RR intervals.
• The main advantage of spectral analysis of signals is the possibility
to study their frequency specific oscillations. Thus, not only the
amount of variability but also the oscillation frequency (number of
37
• Applications of different spectral methods were used for analysis
of the RR tachogram.
• Power Spectral Density (PSD) analysis gives insights on how
power variance distribute as the function of frequency.
Classification for Power Spectral Density
Methods employed for the calculation of Power Spectral Density
(PSD) are
• Parametric methods
• Non parametric methods
Parametric method is the common method employed for doing
spectral analysis, where there was diversion of the entire data which
would have overlapping sections and there was Fast Fourier
transformation of each section and the periodogram values were done by
taking an average.
The Non Parametric Method :
Advantages are:
• In most of the cases it is Fast Fourier transformation.
38
Parametric Methods Advantages :
• Spectral bands are smooth that can be independently distinguished
by pre selected frequency bands.
• The spectrum of post processing is easy with calculation done
automatically which is of low & high frequency components of
power, and identification is easy by the central frequency of each
component.
• The estimation of power spectral density (PSD) is accurate even
for a small number of samples on which signal acquired is
supposed to remain stationary.
• The main advantages of parametric method is the need for
verifying the suitability of the chosen model and its complexity.
Independent of the different methods which were employed, only an
estimate of the true power spectral density (PSD) of the signal could be
acquired by proper mathematical algorithms. In most of the cases, both
methods could give comparable results.
The variable components of spectral analysis of frequency domain
39
Frequency Domain Methods
• In this method, different bands of frequency are assigned then the
numbers of NN interval, which match the particular band are counted.
• HRV is used as tool to assess the imbalance between the sympathetic
and parasympathetic influence on heart rate.
Frequency Domain Parameters:
• Total power
• LF power (LF)
• HF power (HF)
• LF norm
• HF norm
• LF/HF ratio
Selective Frequency Domain Measures of HRV Analysis Calculations
• Total power :
The NN interval is varied over the temporal segment. It’s frequency
range is approximately 0.4 Hertz.
40
The range of power is low frequency range. The frequency range is
0.04 to 0.15 Hertz. This frequency band could represent both sympathetic
and parasympathetic tone.
• High Frequency power(HF):
The range of power is a high frequency range. It’s frequency range is
from 0.15 to 0.4 Hertz.
• LF norm ( Nu) :
The normalized units of low frequency power.
LF / ( Total power – very low frequency (VLF) x 100.
• HF Norm ( NU):
Normalized units of High frequency power
HF / (Total power- VLF) x 100.
• LF / HF power ratio :
LF/ HF ratio represents the ratio of LF to HF spectral powers.
LF /HF Ratio is helpful in assessing the coordinated
functioning among sympathetic and parasympathetic tone.
When the score is decreased it could represent the decrease in
41
Statistical Analysis
The statistical analysis was done using SPSS software (statistical
package for social science version – 23) by independent sample t test for
comparing the participants of the control group and study group.
The descriptive statistics frequency analysis, percentage analysis
were used for categorical variables and the mean and standard deviation
were used for continuous variables. To assess the relationship between
the variables like:
• Correlation of HRV with lipid profile between control and study
group.
• Correlation of HRV with Body Mass Index (BMI) will be found
out between the control and the study group.
• Correlation of HRV with glycosylated haemoglobin will be found
out between the control and the study group.
All these correlation analyses are carried out by Pearson correlation
analysis. In all the above statistical tools the probability value < 0.05 is
considered as significant level.
Classification of ‘P’ Values
P values is classified as:
P<0.05 was considered statistically significant.
42
RESULTS
HRV analysis was done in 30 offsprings of type 2 diabetes mellitus
who were not diabetics served as control group. This was compared with
30 offsprings of type 2 diabetes mellitus who were diabetics (study
group).
The test for the control and study group were done by recording
ECG in lead II supine position at rest for duration of 5 minutes which was
termed as short term HRV analysis.
From the ECG recorded the RR interval was noted and RR
Tachogram was plotted.
Comparison of HRV with other parameters like lipid profile, blood
glucose, glycosylated haemoglobin, BMI was found out between the
study and the control group.
Comparison of HRV analysis of Time Domain Parameters and Frequency
Domain Parameters was done between the control and the study groups.
Correlation studies were done between the HRV parameters and
biochemical values within each control group and study group.
For statistical analysis, Independent sample t- test was used. To
43
used and to find the significance in categorical data Chi- Square test was
used.
Group A
30 offsprings of type 2 diabetes mellitus who were not diabetics
(control group)
Group B
30 offsprings of type 2 diabetes mellitus who were diabetics (study
group)
Statistical Analysis
The data collected was analysed by HRV analysis using software
version 1-1 (Bio signals Analysis group, Finland). Results were tabulated
and analysed by using Independent sample t-test.
There exists significant difference in the mean value of the given
variable among the controls and the study group.
Classification of ‘P’ Values
P values is classified as
P value > 0.05 was denoted as statistically insignificant.
44
Results were tabulated and analysed using Independent sample t-test.
• These HRV analysis was analysed using Independent sample t-test
between the study and the control groups.
• Correlation of HRV was done with lipid profile, of study and control
groups.
• Correlation of HRV with body mass index was found out between of
study and control groups.
• Correlation of HRV with glycosylated haemoglobin was found out
between the study and control groups.
MAIN ANALYSIS
COMPARISION BETWEEN CONTROL GROUP AND STUDY
GROUP
Baseline characteristic of 30 offsprings of type 2 diabetes mellitus
who were not diabetics (control group) and 30 offsprings of type 2
diabetes mellitus who were diabetics (study group) were compared.
Results are expressed as Mean + Standard deviation (SD).
Mean age of 30 offsprings of type 2 diabetes mellitus who are
not diabetics (control group) and 30 offsprings of type 2 diabetes
45
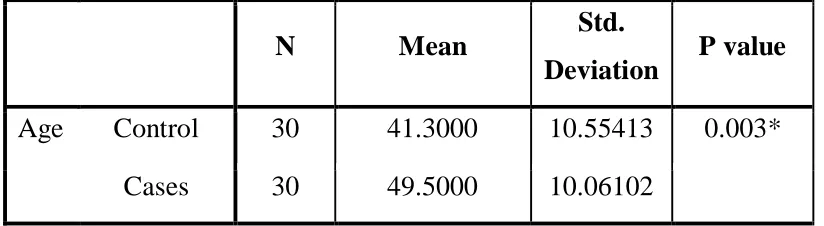
The age of the 30 controls had a mean and SD of 41.3 + and SD
10.55 years. The study group with diabetes had a mean and SD of 49.5 +
10.06 years and the difference was found to have a P value of 0.003
which was statistically significant. This shows that the age of both the
groups is matched in our study. Table 1.
Comparison of Gender in 30 offsprings of type 2 diabetes mellitus
who are not diabetics (control groups) and 30 offsprings of type 2
diabetes mellitus who are diabetics (study group) :
• The distribution of gender in the control group was as follows.
There were 8 (27%) Females and 22 (73%) males. In the study
group there were 5 (17%) females and 25 (83%) males. Table 2
COMPARISON OF HEART RATE VARIABILITY
PARAMETERS BETWEEN CONTROL GROUP AND STUDY
GROUP:
TIME DOMAIN MEASURES:
Mean R-R:
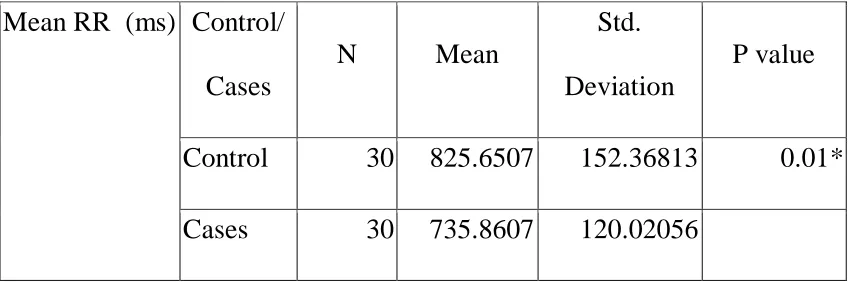
The mean + SD values of mean R-R(ms) in the control group was
825.65 +152.37 and in the study group was 735.86 + 120.02(ms). The
46
difference was found to be statistically significant with a p value of
0.01.Table 3 Chart 1.
Mean H-R:
The mean + SD values of mean H-R in beats per minute in the
control group was 74.51 +13.55 and in the study group was it 83.33 +
14.73 beats per min. The mean value of the heart rate was increased in the
study group and the difference was found to be statistically significant
with a p value of 0.02.Table 4 Chart 2.
SDNN
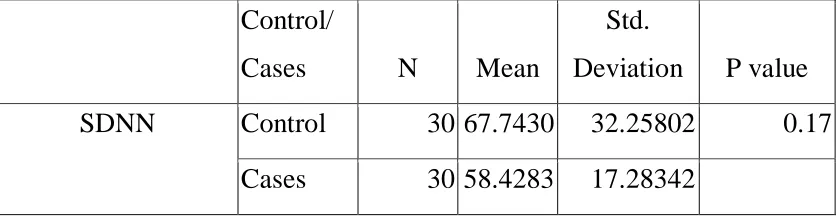
The mean +SD values of SDNN ms in the control groups was
67.74 + 32.26 and in the study group was 58.43+ 17.28. The mean value
of the SDNN was decreased in the study group and the difference was
found to be statistically insignificant with p value of 0.17. Table 5
Chart 3.
RMSSD
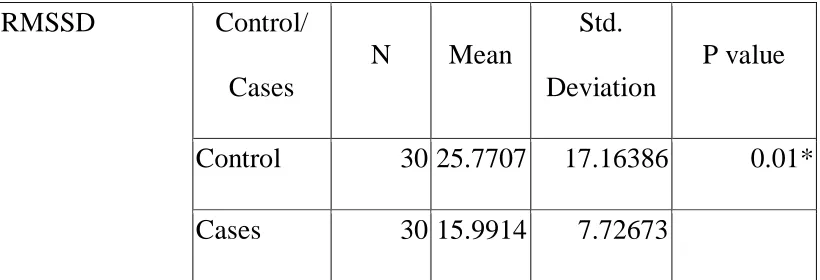
The mean + SD values of RMSSD (ms) in the control groups was
25.77+ 17.16 and in the study group was 15.99 + 7.73. There was
47
was found to be statistically significant with p value of 0.01 Table 6
Chart 4.
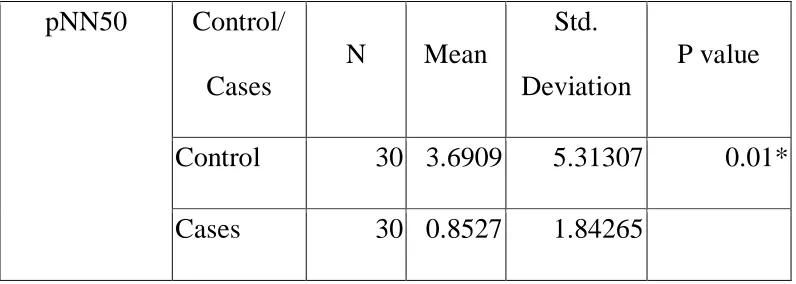
pNN50
The mean + SD values of pNN50 (ms) in the control groups was
3.69 + 5.31 and in the study group was 0.85 + 1.84.There was decrease
in the mean value of pNN50 in the study group. The difference was
found to be statistically significant with p value of 0.01.Table 7 Chart 5.
FREQUENCY DOMAIN MEASURES:
Comparison of frequency domain measures of heart rate variability
parameters in control and study group:
Three frequency domain measures have been compared between
control group and study group.
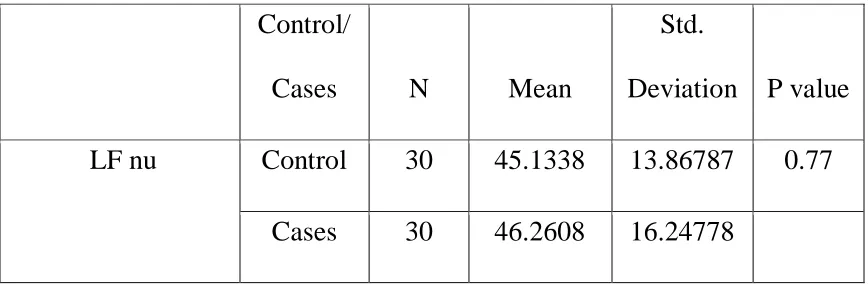
Low Frequency Power (LF nu)
Low frequency power LF is measured in normalized units (nu)
The mean + SD values of LF nu in the control group was 45.13+
13.87 and in the study group was 46.26 + 16.25. The mean value of LF
nu was increased in the study group and the difference was found to be
48
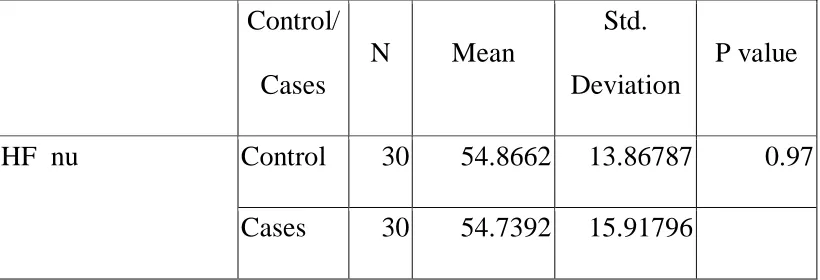
High Frequency Power (HF nu)
High frequency power HF is measured in normalized units (nu).
The mean + SD values of HF nu in the control groups was 54.87+ 13.87
and in the study group it was 54.74 + 15.92. The mean value of HF nu
was slightly decreased in the study group and the difference was found to
be statistically insignificant with the p value of 0.97. Table 9 Chart 7.
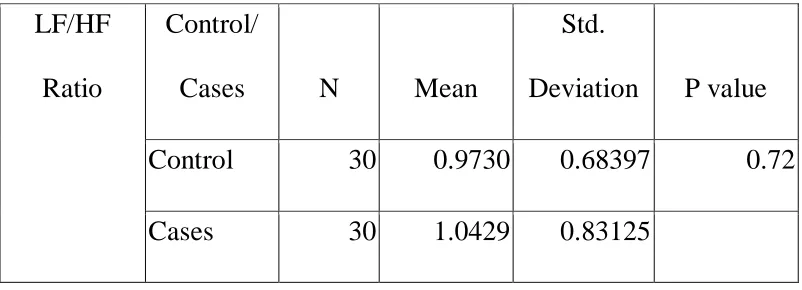
LF/HF ratio
The mean + SD values of LF/HF ratio in the control groups was
0.97 + 0.68 and the study group was 1.04 + 0 .83. The mean value of
LF/HF ratio in the study group it was increased when compared to the
control group and the difference was found to be statistically insignificant
with the p value of 0.72 Table 10 Chart 8.
COMPARISON OF BIOCHEMICAL PARAMETERS BETWEEN
CONTROL GROUP AND STUDY GROUP:
HbA1c Table
The mean + SD values of HbA1c in the control group was 5.55 +
0.34 and in the study group it was 8.63 + 2.70 measured in % and there
is a marked difference in the mean values of two groups which shows
49
study group denoting the diabetic status. HbA1c in the study group it was
increased when compared to the control group and the difference was
found to be statistically significant with the p value of 0.00. Table 11
Chart 9.
Cholesterol
The mean + SD values of cholesterol in the control group was
188.33 + 34.73 and in the study group it was 187.87 + 35.09 measured in
mg/dl. Cholesterol in the study group was decreased when compared to
the control group and the difference was found to be statistically
insignificant with the p value of 0.96. Table 12 Chart 10.
Triglycerides
The mean + SD values of triglycerides in the control group was
117.10 + 56.15 and in the study group it was 194.33 + 128.25 measured
in mg/dl. There was a marked increase in the mean values of study group
compared to the control group and the difference was found to be
statistically significant with the p value of 0.00. Table 13 Chart 11.
High Density Lipoprotein Cholesterol (HDL-C)
The mean + SD values of high density lipoprotein in the control
50
measured in mg/dl. High density lipoprotein in the study group was
decreased when compared to the control group and the difference was
found to be statistically significant with the p value of 0.01. Table 14
Chart 12.
Low Density Lipoprotein Cholesterol (LDL-C)
The mean + SD values of low density lipoprotein in the control
group was 140.43 + 33.67 and in the study group it was 138.10 + 35.44
measured in mg/dl. Low density lipoprotein in the study group was
decreased when compared to the control group and the difference was
found to be statistically insignificant with the p value of 0.8 Table 15
Chart 13.
Glucose Fasting
The mean + values of glucose fasting in the control group was
97.90 + 10.05 and in the study group was 178.37 +74.43 measured in
mg/dl. The fasting blood glucose is increased in the study group when
compared to the control group and the difference was found to be
51
Post Prandial Blood Sugar (PPBS)
The mean + values of post prandial blood sugarin the control
group was 125.40 + 19.00 and in the study group was 263.77 + 102.15
Post prandial blood sugar is increased in the study group when compared
to the control group and the difference was found to be statistically
significant with the p value of 0.00. Table 17 Chart 15.
Body Mass Index (BMI)
The mean + values of body mass indexin the control group was
26.093+4.6066 and in the study group was 25.200+3.3143 body mass
index is increased in the study group when compared to the control group
and the difference was found to be statistically significant with the p
value of 0.39. Table 18 Chart 16.
PEARSON'S CORRELATION (TIME DOMAIN MEASURES)
HbA1c and mean RR in control group and study group : TABLE - 19
There was a negative correlations between HBA1c and mean RR
in control group (r=-0.24,p=0.21) which was statistically insignificant.
There was a negative correlations between HBA1c and mean RR in
52
HbA1c and mean HR in control group and study group : TABLE - 19
There was a positive correlations between HbA1c and mean HR in
control group (r=0.22,p=0.25) which was statistically insignificant.
There was a positive correlations between HbA1c and mean HR in study
group (r=0.05, p=0.79) which was statistically insignificant.
HbA1c and SDNN in control group and study group : TABLE - 19
There was a negative correlations between HbA1c and SDNN in
control group (r=-0.16,p=0.39) which was statistically insignificant.
There was a negative correlations between HbA1c and SDNN in study
group (r=-0.13,p=0.48) which was statistically insignificant.
HbA1c and RMSSD in control group and study group : TABLE - 19
There was a negative correlations betweenHbA1c and RMSDD in
control group (r=-0.11,p=0.56) which was statistically insignificant.
There was a positive correlations between HbA1c and RMSSD in study
group (r=0.01,p=0.96) which was statistically insignificant.
HbA1c and pNN50 in control group and study group : TABLE - 19
There was a negative correlations between HbA1c and pNN50 in
53
There was a positive correlations between HbA1c and pNN50 in study
group (r=0.08,p=0.69) which was statistically insignificant.
Correlations Analysis of HRV Parameters (Frequency Domain
Measures) and HbA1c between the study group and the control
group.
HbA1c and LF nu control group and study group : TABLE - 20
There was a negative correlation between HbA1c and LF nu in
control group (r=-0.54,p=0.78) which was statistically insignificant.
There was a positive correlations between HbA1c and LF nu in study
group (r=0.32,p=0.09) which was statistically insignificant.
HbA1c and HF nu control group and study group : TABLE - 20
There was a positive correlations between HbA1c and HF nu in
control group (r=0.54,p=0.78) which was statistically insignificant.
There was a negative correlations between HbA1c and HF nu in study
group (r=-0.39,p=0.04) which was statistically significant.
HbA1c and LF/HF RATIO control group and study group :
TABLE - 20
There was a negative correlations between HbA1c and LF/HF
54
insignificant. There was a positive correlations between HbA1c and
LF/HFRATIO in study group (r=0.51,p=0.00) which was statistically
significant.
Correlations Analysis of HRV Parameters (Time Domain Measures)
and triglycerides between the study group and the control group.
Triglycerides and mean RR in control group and study group :
TABLE - 21
There was a negative correlations between triglycerides and mean
RR in control group (r=-0.21,p=0.27) which was statistically
insignificant. There was a positive correlations between triglycerides and
mean RR in study group (r=0.00,p=0.99) which was statistically
insignificant.
Triglycerides and mean HR in control group and study group :
TABLE - 21
There was a positive correlations between triglycerides and mean
HR in control group (r=0.22,p=0.24) which was statistically
insignificant. There was a negative correlations between triglycerides and
mean HR in study group (r=-0.07,p=0.71) which was statistically
55
Triglycerides and SDNN in control group and study group :
TABLE - 21
There was a negative correlations between triglycerides and
SDNN in control group (r=-0.09,p=0..64) which was statistically
insignificant. There was a positive correlations between triglycerides and
SDNN in study group (r=0.07,p=0.73) which was statistically
insignificant.
Triglycerides and RMSSD in control group and study group :
TABLE - 21
There was a negative correlations between triglycerides and
RMSDD in control group (r=-0.14,p=0.45) which was statistically
insignificant. There was a positive correlation between triglycerides and
RMSDD in study group (r=0.06,p=0.74) which was statistically
insignificant.
Triglycerides and pNN50 in control group and study group :
TABLE - 21
There was a negative correlations between triglycerides and
pNN50 in control group (r=-0.18,p=0.34) which was statistically
56
pNN50 in study group (r=0.04,p=0.84) which was statistically
insignificant.
Correlations Analysis of HRV Parameters (Frequency Domain
Measures) and triglycerides between the study group and the control
group.
Triglycerides and LF nu control group and study group :
TABLE - 22
There was a positive correlations between triglycerides and LF nu
in control group (r=0.04,p=0.85) which was statistically insignificant.
There was a positive correlations between triglycerides and LF nu in
study group (r=0.27,p=0.16) which was statistically insignificant.
Triglycerides and HF nu control group and study group :