Using the Star Properties Concept Inventory to Compare
Instruction with Lecture Tutorials to Traditional
Lectures
Michael C. LoPresto
Henry Ford Community College, Dearborn, Michigan 48128
Steven R. Murrell
Henry Ford Community College, Dearborn, Michigan 48128 Received: 01/29/09, Revised: 05/18/09, Published: 06/26/09
© 2009 The American Astronomical Society. All rights reserved.
Abstract
The Star Properties Concept Inventory共SPCI兲is among the first instruments made available to assess student gains in a major section or “unit” of a traditional introductory astronomy course, in this case the unit on stars. This is in contrast to instruments for an entire course, such as the Astronomy Diagnostic Test or the Lunar Phases Concept Inventory that is for a single subject. One of the intended uses of the SPCI is for comparison of the effectiveness of different instructional methods. The following is a report on the results of a study in which the SPCI was used as a pretest and post test to compare gains in active and collaborative student-centered instruction using lecture tutorials to those in traditional instructor-centered instruction.
1. INTRODUCTION
Henry Ford Community College共HFCC兲currently offers between four and six 30-student sections a semester of a very typical “ASTRO 101” type course called ASTR 131-Descriptive Astronomy. Approximately 4 weeks of instruction are spent on each of three major sections or “units,” the third of which is on the subject of light, the sun, and stars. It comes after a first unit on celestial motions and historical astronomy, largely designed to teach the scientific method共LoPresto 2004兲, and a second on the solar system. The instructional time left after “stars” is then devoted to galaxies, cosmology, and life in the universe.
2. THE “STARS” UNIT
By the fall semester of 2008, coverage of the stars had evolved to largely centering on lecture-tutorials from the manual “Lecture-Tutorials for Introductory Astronomy”共Adamset al.2007兲. The following 11 tutorials were used over the course of the seven biweekly, 80-min class periods devoted to coverage of light, the sun and stars:
共1兲 Electromagnetic共EM兲Spectrum of Light,
共2兲 Telescopes and Earth’s Atmosphere,
共3兲 Luminosity, Temperature, and Size,
共4兲 Blackbody Radiation,
共5兲 Types and Spectra,
共6兲 Apparent and Absolute Magnitudes of Stars,
共7兲 The Parsec,
共8兲 Parallax and Distance,
共9兲 Hertzsprung-Russel Diagram,
共10兲 Star Formation and Lifetimes, and
A L I V E LY E L E C T R O N I C C O M P E N D I U M O F R E S E A R C H , N E W S , R E S O U R C E S , A N D O P I N I O N
共11兲 Stellar Evolution.
As the name indicates, lecture tutorials are not designed to completely replace lectures. Rather, they are meant for students to spend 15–20 min exploring concepts through guided inquiry in an active and collaborative fashion after a short introduction to a given topic. A brief follow-up lecture to pull together the important points of the activity is also appropriate.
3. METHOD
In the fall 2008 semester, two sections of ASTR 131 were taught using the above-mentioned lecture tutorials and two sections were taught through traditional instructor-centered lectures. All four sections were given the Star Properties Concept Inventory-Version 3共SPCI兲as a pretest shortly before the stars unit began and as a post test a week after the exam on the subject. All sections were also taught using all 23 of the SPCI content questions as “clicker” review questions at the beginning of the next class meeting after the topics relevant to the specific items had been covered共seeNote 1兲.
4. RESULTS
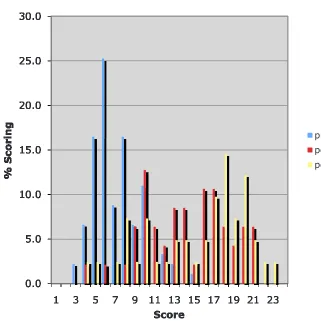
The average pretest score for the four sections,N= 89, was 6.2/23= 26.9% with a standard error of 1.1%. The average post test score for the two sections that were taught by lectures,N= 47 was 13.1/23= 57% standard error= 2.7%, a gain of about 30%. The normalized gain= actual gain/possible gain共Hake 1998兲,g= 0.41. The post test scores for the two sections taught with the tutorials,N= 41, scored 14.6/23= 63%, standard error= 3.4%, a gain of 36.4%, normalized gain,g= 0.5. Figure 1shows the number of students scoring from 0 to 23 on the pretest and in both groups on the post test.
30.0
Students Scoring 0-23
30.0
Students Scoring 0-23
30.0
Students Scoring 0-23
30.0
Students Scoring 0-23
30.0
Students Scoring 0-23
30.0
Students Scoring 0-23
25 0 30.0
Students Scoring 0-23
25 0 30.0
Students Scoring 0-23
25.0 30.0
Students Scoring 0-23
25.0 30.0
Students Scoring 0-23
25.0 30.0
Students Scoring 0-23
25.0 30.0
Students Scoring 0-23
25.0 30.0
Students Scoring 0-23
25.0 30.0
Students Scoring 0-23
20 0 25.0 30.0
Students Scoring 0-23
20 0 25.0 30.0
Students Scoring 0-23
20.0 25.0 30.0
Students Scoring 0-23
20.0 25.0 30.0
Students Scoring 0-23
20.0 25.0 30.0
g
Students Scoring 0-23
20.0 25.0 30.0
g
Students Scoring 0-23
20.0 25.0 30.0
ng
Students Scoring 0-23
pretest
20.0 25.0 30.0
ng
Students Scoring 0-23
pretest 20.0 25.0 30.0 o ring
Students Scoring 0-23
pretest 20.0 25.0 30.0 o ring
Students Scoring 0-23
pretest 15.0 20.0 25.0 30.0 coring
Students Scoring 0-23
pretest post-lec 15.0 20.0 25.0 30.0 coring
Students Scoring 0-23
pretest post-lec 15.0 20.0 25.0 30.0 Scoring
Students Scoring 0-23
pretest post-lec post-tut 15.0 20.0 25.0 30.0 Scoring
Students Scoring 0-23
pretest post-lec post-tut 15.0 20.0 25.0 30.0 % Scoring
Students Scoring 0-23
pretest post-lec post-tut 15.0 20.0 25.0 30.0 % Scoring
Students Scoring 0-23
pretest post-lec post-tut 15.0 20.0 25.0 30.0 % S coring
Students Scoring 0-23
pretest post-lec post-tut 15.0 20.0 25.0 30.0 % S coring
Students Scoring 0-23
pretest post-lec post-tut 15.0 20.0 25.0 30.0 % S coring
Students Scoring 0-23
pretest post-lec post-tut 10.0 15.0 20.0 25.0 30.0 % S coring
Students Scoring 0-23
pretest post-lec post-tut 10.0 15.0 20.0 25.0 30.0 % S coring
Students Scoring 0-23
pretest post-lec post-tut 10.0 15.0 20.0 25.0 30.0 % S coring
Students Scoring 0-23
pretest post-lec post-tut 10.0 15.0 20.0 25.0 30.0 % S coring
Students Scoring 0-23
pretest post-lec post-tut 10.0 15.0 20.0 25.0 30.0 % S coring
Students Scoring 0-23
pretest post-lec post-tut 10.0 15.0 20.0 25.0 30.0 % S coring
Students Scoring 0-23
pretest post-lec post-tut 10.0 15.0 20.0 25.0 30.0 % S coring
Students Scoring 0-23
pretest post-lec post-tut 10.0 15.0 20.0 25.0 30.0 % S coring
Students Scoring 0-23
pretest post-lec post-tut 5.0 10.0 15.0 20.0 25.0 30.0 % S coring
Students Scoring 0-23
pretest post-lec post-tut 5.0 10.0 15.0 20.0 25.0 30.0 % S coring
Students Scoring 0-23
pretest post-lec post-tut 5.0 10.0 15.0 20.0 25.0 30.0 % S coring
Students Scoring 0-23
pretest post-lec post-tut 5.0 10.0 15.0 20.0 25.0 30.0 % S coring
Students Scoring 0-23
pretest post-lec post-tut 5.0 10.0 15.0 20.0 25.0 30.0 % S coring
Students Scoring 0-23
pretest post-lec post-tut 5.0 10.0 15.0 20.0 25.0 30.0 % S coring
Students Scoring 0-23
pretest post-lec post-tut 5.0 10.0 15.0 20.0 25.0 30.0 % S coring
Students Scoring 0-23
pretest post-lec post-tut 5.0 10.0 15.0 20.0 25.0 30.0 % S coring
Students Scoring 0-23
pretest post-lec post-tut 0 0 5.0 10.0 15.0 20.0 25.0 30.0 % S coring
Students Scoring 0-23
pretest post-lec post-tut 0 0 5.0 10.0 15.0 20.0 25.0 30.0 % S coring
Students Scoring 0-23
pretest post-lec post-tut 0.0 5.0 10.0 15.0 20.0 25.0 30.0 % S coring
Students Scoring 0-23
pretest post-lec post-tut 0.0 5.0 10.0 15.0 20.0 25.0 30.0 % S coring
Students Scoring 0-23
pretest post-lec post-tut 0.0 5.0 10.0 15.0 20.0 25.0 30.0
1 3 5 7 9 11 13 15 17 19 21 23
%
Scoring
Students Scoring 0-23
pretest post-lec post-tut 0.0 5.0 10.0 15.0 20.0 25.0 30.0
1 3 5 7 9 11 13 15 17 19 21 23
%
Scoring
Students Scoring 0-23
pretest post-lec post-tut 0.0 5.0 10.0 15.0 20.0 25.0 30.0
1 3 5 7 9 11 13 15 17 19 21 23
%
S
coring
Score
Students Scoring 0-23
pretest post-lec post-tut 0.0 5.0 10.0 15.0 20.0 25.0 30.0
1 3 5 7 9 11 13 15 17 19 21 23
%
S
coring
Score
Students Scoring 0-23
pretest post-lec post-tut 0.0 5.0 10.0 15.0 20.0 25.0 30.0
1 3 5 7 9 11 13 15 17 19 21 23
%
S
coring
Score
Students Scoring 0-23
pretest post-lec post-tut 0.0 5.0 10.0 15.0 20.0 25.0 30.0
1 3 5 7 9 11 13 15 17 19 21 23
%
S
coring
Score
Students Scoring 0-23
pretest post-lec post-tut 0.0 5.0 10.0 15.0 20.0 25.0 30.0
1 3 5 7 9 11 13 15 17 19 21 23
%
S
coring
Score
Students Scoring 0-23
pretest post-lec post-tut 0.0 5.0 10.0 15.0 20.0 25.0 30.0
1 3 5 7 9 11 13 15 17 19 21 23
%
S
coring
Score
Students Scoring 0-23
pretest post-lec post-tut 0.0 5.0 10.0 15.0 20.0 25.0 30.0
1 3 5 7 9 11 13 15 17 19 21 23
%
S
coring
Score
Students Scoring 0-23
[image:2.612.123.444.391.712.2]pretest post-lec post-tut
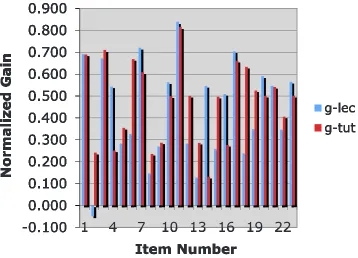
Inspection of Fig.2showing normalized gains,g, for individual items by both groups shows the lecture-tutorial group with higher normalized gains on 11 of the 23 items. The lecture group had higher gains on five
items. The two groups had similar gains on seven items. Three of the five items on which the lecture sections outperformed the tutorial group were about star birth, energy being produced in the core, and mass
determining the final fate of a star. These are subjects that are not covered in the lecture tutorials so both groups received lectures about them. Although both groups performed well on it, the lecture sections had higher gains on a simple question relating star color and temperature and a more involved one on size and brightness of different color stars. Both of these questions are on topics that were covered in lecture tutorials and also can be visualized with the H-R diagram so it is surprising that the lecture sections did better on them. However, the tutorial sections did better on three other questions on related topics, suggesting that they had benefited from actually working with H-R diagrams in several lecture tutorials. The lecture tutorials sections also outperformed the lecture sections on two questions about how the mass and lifetime of a star are related, including one that stresses that the relationship is not linear, which also was the subject of one of the
tutorials共seeNote 2兲.
5. THE USE OF CLICKERS
Prior to the above study, in the winter 2008 semester, the SPCI was given to three sections of ASTR-131 taught by two different instructors at HFCC. The sections were taught largely with the above-listed tutorials but the SPCI questions were not used as clicker questions. That semester, the average SPCI pretest score forN= 61 students was 5.7/23= 24.8% with a standard error of 1.4%. The average post test score forN= 69 students was 10.5/23= 45.7%, standard error 2.4%. The gain of about 21% 共normalized gain,g= 0.27兲was comparable to a 20%共31%–51%兲, gain 共g= 0.29兲in a study by the author of the SPCI共Bailey 2008兲using the same version of the instrument共3.0兲.
It was noted that during the fall 2008 study, the pretest scores were similar to winter 2008 but the post test scores and gains were much higher than in winter 2008, for both groups, both the sections taught with lecture tutorialsandthose taught by lecture only. This suggests that either using the SPCI items as clicker questions was too much “teaching to the test” or that this was an example of the well-documented effectiveness of using
Normalized Gains (g)
for each Item
Normalized Gains (g)
for each Item
Normalized Gains (g)
for each Item
Normalized Gains (g)
for each Item
0 900
Normalized Gains (g)
for each Item
0 900
Normalized Gains (g)
for each Item
0.900
Normalized Gains (g)
for each Item
0.900
Normalized Gains (g)
for each Item
0 800
0.900
Normalized Gains (g)
for each Item
0 800
0.900
Normalized Gains (g)
for each Item
0.800
0.900
Normalized Gains (g)
for each Item
0.800
0.900
Normalized Gains (g)
for each Item
0.800
0.900
Normalized Gains (g)
for each Item
0.800
0.900
Normalized Gains (g)
for each Item
0.700
0.800
0.900
n
Normalized Gains (g)
for each Item
0.700
0.800
0.900
n
Normalized Gains (g)
for each Item
0.700
0.800
0.900
in
Normalized Gains (g)
for each Item
0.700
0.800
0.900
in
Normalized Gains (g)
for each Item
0 600
0.700
0.800
0.900
a
in
Normalized Gains (g)
for each Item
0 600
0.700
0.800
0.900
a
in
Normalized Gains (g)
for each Item
0.600
0.700
0.800
0.900
G
ain
Normalized Gains (g)
for each Item
0.600
0.700
0.800
0.900
G
ain
Normalized Gains (g)
for each Item
0 500
0.600
0.700
0.800
0.900
d
Gain
Normalized Gains (g)
for each Item
0 500
0.600
0.700
0.800
0.900
d
Gain
Normalized Gains (g)
for each Item
0.500
0.600
0.700
0.800
0.900
ed
Gain
Normalized Gains (g)
for each Item
g lec
0.500
0.600
0.700
0.800
0.900
ed
Gain
Normalized Gains (g)
for each Item
g lec
0 400
0.500
0.600
0.700
0.800
0.900
z
ed
Gain
Normalized Gains (g)
for each Item
g-lec
0 400
0.500
0.600
0.700
0.800
0.900
z
ed
Gain
Normalized Gains (g)
for each Item
g-lec
0.400
0.500
0.600
0.700
0.800
0.900
li
zed
Gain
Normalized Gains (g)
for each Item
g-lec
g tut
0.400
0.500
0.600
0.700
0.800
0.900
li
zed
Gain
Normalized Gains (g)
for each Item
g-lec
g tut
0 300
0.400
0.500
0.600
0.700
0.800
0.900
al
ized
Gain
Normalized Gains (g)
for each Item
g-lec
g-tut
0 300
0.400
0.500
0.600
0.700
0.800
0.900
al
ized
Gain
Normalized Gains (g)
for each Item
g-lec
g-tut
0 300
0.400
0.500
0.600
0.700
0.800
0.900
al
ized
Gain
Normalized Gains (g)
for each Item
g-lec
g-tut
0.300
0.400
0.500
0.600
0.700
0.800
0.900
m
alized
Gain
Normalized Gains (g)
for each Item
g-lec
g-tut
0.300
0.400
0.500
0.600
0.700
0.800
0.900
m
alized
Gain
Normalized Gains (g)
for each Item
g-lec
g-tut
0.300
0.400
0.500
0.600
0.700
0.800
0.900
r
malized
Gain
Normalized Gains (g)
for each Item
g-lec
g-tut
0.300
0.400
0.500
0.600
0.700
0.800
0.900
r
malized
Gain
Normalized Gains (g)
for each Item
g-lec
g-tut
0.200
0.300
0.400
0.500
0.600
0.700
0.800
0.900
o
rmalized
Gain
Normalized Gains (g)
for each Item
g-lec
g-tut
0.200
0.300
0.400
0.500
0.600
0.700
0.800
0.900
o
rmalized
Gain
Normalized Gains (g)
for each Item
g-lec
g-tut
0.200
0.300
0.400
0.500
0.600
0.700
0.800
0.900
N
ormalized
Gain
Normalized Gains (g)
for each Item
g-lec
g-tut
0.200
0.300
0.400
0.500
0.600
0.700
0.800
0.900
N
ormalized
Gain
Normalized Gains (g)
for each Item
g-lec
g-tut
0 100
0.200
0.300
0.400
0.500
0.600
0.700
0.800
0.900
Normalized
Gain
Normalized Gains (g)
for each Item
g-lec
g-tut
0 100
0.200
0.300
0.400
0.500
0.600
0.700
0.800
0.900
Normalized
Gain
Normalized Gains (g)
for each Item
g-lec
g-tut
0.100
0.200
0.300
0.400
0.500
0.600
0.700
0.800
0.900
Normalized
Gain
Normalized Gains (g)
for each Item
g-lec
g-tut
0.100
0.200
0.300
0.400
0.500
0.600
0.700
0.800
0.900
Normalized
Gain
Normalized Gains (g)
for each Item
g-lec
g-tut
0 000
0.100
0.200
0.300
0.400
0.500
0.600
0.700
0.800
0.900
Normalized
Gain
Normalized Gains (g)
for each Item
g-lec
g-tut
0 000
0.100
0.200
0.300
0.400
0.500
0.600
0.700
0.800
0.900
Normalized
Gain
Normalized Gains (g)
for each Item
g-lec
g-tut
0.000
0.100
0.200
0.300
0.400
0.500
0.600
0.700
0.800
0.900
Normalized
Gain
Normalized Gains (g)
for each Item
g-lec
g-tut
0.000
0.100
0.200
0.300
0.400
0.500
0.600
0.700
0.800
0.900
Normalized
Gain
Normalized Gains (g)
for each Item
g-lec
g-tut
0 100
0.000
0.100
0.200
0.300
0.400
0.500
0.600
0.700
0.800
0.900
1
4
7 10 13 16 19 22
Normalized
Gain
Normalized Gains (g)
for each Item
g-lec
g-tut
0 100
0.000
0.100
0.200
0.300
0.400
0.500
0.600
0.700
0.800
0.900
1
4
7 10 13 16 19 22
Normalized
Gain
Normalized Gains (g)
for each Item
g-lec
g-tut
-0.100
0.000
0.100
0.200
0.300
0.400
0.500
0.600
0.700
0.800
0.900
1
4
7 10 13 16 19 22
Normalized
Gain
Normalized Gains (g)
for each Item
g-lec
g-tut
-0.100
0.000
0.100
0.200
0.300
0.400
0.500
0.600
0.700
0.800
0.900
1
4
7 10 13 16 19 22
Normalized
Gain
Normalized Gains (g)
for each Item
g-lec
g-tut
-0.100
0.000
0.100
0.200
0.300
0.400
0.500
0.600
0.700
0.800
0.900
1
4
7 10 13 16 19 22
Normalized
G
ain
It
N
b
Normalized Gains (g)
for each Item
g-lec
g-tut
-0.100
0.000
0.100
0.200
0.300
0.400
0.500
0.600
0.700
0.800
0.900
1
4
7 10 13 16 19 22
Normalized
G
ain
It
N
b
Normalized Gains (g)
for each Item
g-lec
g-tut
-0.100
0.000
0.100
0.200
0.300
0.400
0.500
0.600
0.700
0.800
0.900
1
4
7 10 13 16 19 22
Normalized
G
ain
Item Number
Normalized Gains (g)
for each Item
g-lec
g-tut
-0.100
0.000
0.100
0.200
0.300
0.400
0.500
0.600
0.700
0.800
0.900
1
4
7 10 13 16 19 22
Normalized
G
ain
Item Number
Normalized Gains (g)
for each Item
g-lec
g-tut
-0.100
0.000
0.100
0.200
0.300
0.400
0.500
0.600
0.700
0.800
0.900
1
4
7 10 13 16 19 22
Normalized
G
ain
Item Number
Normalized Gains (g)
for each Item
g-lec
g-tut
-0.100
0.000
0.100
0.200
0.300
0.400
0.500
0.600
0.700
0.800
0.900
1
4
7 10 13 16 19 22
Normalized
G
ain
Item Number
Normalized Gains (g)
for each Item
g-lec
g-tut
-0.100
0.000
0.100
0.200
0.300
0.400
0.500
0.600
0.700
0.800
0.900
1
4
7 10 13 16 19 22
Normalized
G
ain
Item Number
Normalized Gains (g)
for each Item
g-lec
g-tut
-0.100
0.000
0.100
0.200
0.300
0.400
0.500
0.600
0.700
0.800
0.900
1
4
7 10 13 16 19 22
Normalized
G
ain
Item Number
Normalized Gains (g)
for each Item
g-lec
g-tut
-0.100
0.000
0.100
0.200
0.300
0.400
0.500
0.600
0.700
0.800
0.900
1
4
7 10 13 16 19 22
Normalized
G
ain
Item Number
Normalized Gains (g)
for each Item
[image:3.612.127.485.93.351.2]g-lec
g-tut
clickers in the classroom共Duncan 2006兲. This question prompted a follow up to the study in winter 2009 in which two sections, taught in similar fashion to winter 2008, with lecture tutorials but without the SPCI items as clicker questions, went from 26%,N= 37, to 50%,N= 45,g= 0.32. This is similar to winter 2008, again, in which clickers werenotused and also very similar to the initial study by the instrument author共Bailey 2008兲.
The author of the SPCI共who had given us permission to use the items as clicker questions, see Note 1兲
was of the opinion that based on time having elapsed before the post test was administered using the SPCI items in this fashion probably did not amount teaching to the test共seeNote 3兲and advocates of teaching with lecture tutorials maintain that students taught with them will outperform students taught by lectures, even if the lectures are “teaching to the test”共seeNote 4兲. Finally, the fact remains that although both the lecture tutorial and lecture sections taught with clickers in fall 2008 outperformed the sections not taught with clickers, the sections also taught with lecture tutorials did outperform those taught by lectures only.
6. CONCLUSION
A study similar to this one done with the Astronomy Diagnostic Test共ADT兲over an entire course did not show much difference between gains in sections using lecture tutorials versus traditional lectures共Alexander 2004兲. However, as seen above, post test scores of the group that did the lecture tutorials in this study did experience higher gains. This is what was expected based on previous research showing the effectiveness of lecture tutorials共Pratheret al. 2004兲.
The results of this study have given rise to plans for a study using a similar procedure to assess the effectiveness of lecture tutorials currently being developed on solar system concepts. Several sections are taught the
concepts with lecture tutorials while others by lecture only and gains are assessed by an instrument being developed by the authors of this study. Early results show students taught by lecture tutorial outperforming those taught by lectures alone共seeNote 5兲.
Evaluating the effectiveness of learner-centered instruction and prompting research into development of similar concept inventories are both among the goals in the creation of the SPCI共Bailey 2008兲. This study has hopefully provided a useful first-step in both of these areas that can be built upon for more research on effective teaching methods with the common goal of further improving instruction of introductory astronomy.
Acknowledgments
The authors thank SPCI author Janelle Bailey for the instrument, introduction to it, permission to use it as described, and informal discussion. They also thank Mike LoPresto’s doctoral advisor Dr. Carl Pennypacker of Lawrence Berkley Laboratory for his guidance and the anonymousAER reviewer for comments that helped make this a much better paper. And finally, many thanks go to the over 200 introductory astronomy students at HFCC who participated in the study.
NOTES
Note 1:Permission for use of SPCI items in this manner was granted by the author Janelle Bailey.
Note 2:For protection of the instrument, items from the SPCI are not shown and are only referred to in a general fashion. The SPCI can be obtained from the author共Bailey 2008兲.
Note 3:Private communication with SPCI author Janelle Bailey.
Note 4:Private communication with Ed Prather.
Note 5:This study was designed to test methodology of a doctoral project in astronomy. A similar study comparing instruction methods of solar system concepts is being undertaken by Mike LoPresto through the James Cook University Centre for Astronomy.
References
Alexander, W. 2004, “Assessment of Teaching Approaches in an Introductory Astronomy College Classroom,”
Astronomy Education Review,3, 178–186.
Bailey, J. M. 2008, “Development of a Concept Inventory to Assess Students’ Understanding and Reasoning Difficulties about the Properties and Formation of Stars,”Astronomy Education Review,6, 133–139.
Duncan, D. 2006, “Clickers: A New Teaching Aid with Exceptional Promise,”Astronomy Education Review,
5, 70–88.
Hake, R. 1998, “Interactive-engagement versus traditional methods: A six-thousand-student survey of mechanics test data for introductory physics courses,”American Journal of Physics,66, 64–74.
LoPresto, M. 2004, “Teaching the Scientific Method in Introductory Astronomy,”Astronomy Education
Review,2, 138–145.
Prather, E. E., Slater, T. F., Bailey, J., Jones, L. V., and Dostal, J. A. 2004, “Research on a Lecture-Tutorial Approach to Teaching Introductory Astronomy for Non-Science Majors,” Astronomy Education Review, 3, 122–136.
ÆR