International Journal of Innovative Technology and Exploring Engineering (IJITEE) ISSN: 2278-3075,Volume-8 Issue-12, October 2019
Abstract: The current study analyses the runoff response using Soil and Water Assessment Tool (SWAT) during rainfall incidents over the sub-basin of Deo River, Panch Mahal, Gujarat, India. The SWAT model is developed for the Deo river sub-basin having catchment area of 194.36 km2, with 7 sub-basins comprising of 94
Hydrological Response Units (HRUs). Two rain gauge stations present in the study area (viz., Deo dam and Shivrajpur) werechosen to evaluate the efficiency of the SWAT model. To conduct SWAT model Calibration and Validation, the Soil and Water Assessment Tool-Calibration Uncertainty Program (SWAT-CUP) with Sequential Uncertainty Fitting (SUFI-2) algorithm has been used. The model was run for the period from 2000 to 2017 considering 2 years (2000-2001) warm up period with a calibration period of 2002 to 2012 and a validation period of 2013 to 2017. The sensitivity of the basin parameters was evaluated and found Curve Number as the most sensitive parameter, hence, it can be considered to improve the model's runoff simulation efficiency. The study found that the model performed good with a Coefficient of Determination (R2) and Nash–Sutcliffe Efficiency (NSE) as 0.89 and 0.87 during calibration and 0.88 and 0.81 during validation respectively giving data at daily scale. The findings of this study revealed that SWAT model is helpful for runoff prediction and flood forecasting for extreme rainfall occurrences in Deo river basin.
Keywords: Hydrological Modelling, SWAT, SWAT-CUP, SUFI-2
I.INTRODUCTION
Hydrological models represent the hydrologic cycle conceptually. These models are developed by understanding the physics of hydrological process and use physical equations to describe these procedures. There are mainly three types of hydrological models; Black Box Models, Deterministic Models and Conceptual Models. Soil and Water Assessment Tool (SWAT) is a Deterministic model which uses non-linear partial differential equations and requires a large amount of data and computational time. There are two-level system; one is sub-basin identification and other is HRU distribution using land use classes and soil types.
Revised Manuscript Received on October 05, 2019. * Correspondence Author
Mansi Parikh, P.G. Student, Water Resources Engineering and Management Institute, Faculty of Technology and Engineering, The Maharaja Sayajirao University of Baroda, Vadodara, India. E-mail: [email protected]
One of the major benefits of deterministic models is that they show the inner perspective of a method that allows abetter interpretation of the system of hydrology. The objectives of this study are as follows: (i) To set up the SWAT model for the Deo river sub-basin for the year 2000 to 2012 and to validate the model for the years 2013 to 2017; (ii) Use of Soil and Water Assessment Tool-Calibration Uncertainty Program (SWAT-CUP) with Sequential Uncertainty Fitting 2 (SUFI-2) algorithm for Calibration and Validation of the model; and (iii) To evaluate the sensitive parameters using Global Sensitivity Analysis.
II.STUDY AREA
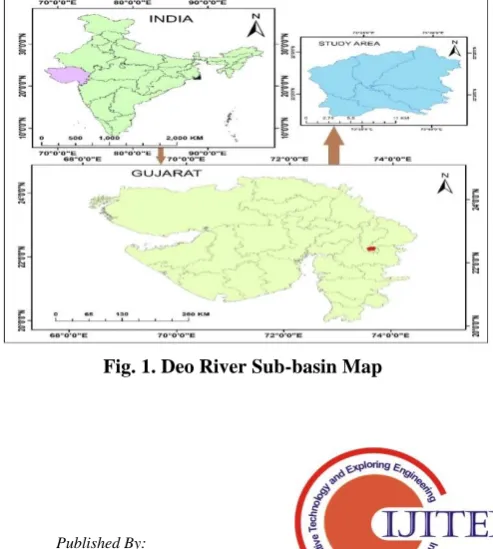
[image:1.595.305.552.538.813.2]Deo river is selected for the present study which flows in Dahod, Panch Mahals and Vadodara districts of Gujarat. Deo river is the right bank tributary of the Dhadhar river. Its other name is Dev river in the name of god. At 26 km distance Deo dam is located on Deo river having catchment area of 194.36 sq. km., which is selected as study area. The basin lies between 22° 22΄ N to 22° 31΄ N latitude and 73° 30΄ E to 73° 42΄ E longitude. The average annual precipitation is 1072 mm (42.21 inches) in the basin. The maximum average temperature felt here is of 39℃ in the month of May and the minimum average temperature of 13℃ for the month of February. The average annual wind speed recorded at the Deo dam weather station is 6.53 m/s .
Fig. 1. Deo River Sub-basin Map
Hydrological Modelling of Deo River
Sub-Basin using SWAT Model and
Performance Evaluation using SWAT-CUP
SWAT-CUP
III.MATERIALS AND METHODS A.Description of SWAT Model
SWAT model is based on physical process and is semi-distributed. SWAT spatially distributes the model in sub-units called sub-watersheds which are named as Hydrological Response Units (HRUs). Using the master water balance approach, SWAT model computes runoff volumes and peak flows expressed as:
1
( )
n
t o day surf a seep gw
i
SW SW R Q E W Q
(1)Where, SWt = Final soil water content (mm), SWo = Initial
soil water content (mm), t = Time in days, Rday = Amount of
precipitation on day i (mm), Qsurf = Amount of surface runoff
on day i (mm), Ea = Amount of evapotranspiration on day i
(mm), Wseep = Amount of percolation and bypass exiting the
soil profile bottom on day i (mm) and Qgw = return flow on
day i (mm).
B. Description of Sequential Uncertainty Fitting (SUFI)-2
In SUFI-2, the uncertainty is expressed as the difference between actual and simulated factors. The SUFI-2 is the combination of uncertainty analysis along with calibration to obtain parameter uncertainties that ensure prediction uncertainties grouping the majority of the measured data, while developing minimum possible prediction uncertainty band. Uncertainty of the input parameter in SUFI-2 is shown as homogeneous, i.e. uniform distribution, whereas uncertainty of the model output is measured as 95% parameter prediction uncertainty (i.e., 95PPU). 95 Percentage Prediction Uncertainty is considered to calculate P-factor. R-factor measures the strength of calibration or uncertainty analysis, R-factor is average thickness of 95 Percentage Prediction Uncertainty band divided by measured data deviation.
C. Input Data for SWAT Model
The Input data required for SWAT such as, Digital Elevation Model (DEM), LU/LC, Soil data, Hydro-meteorological data were either prepared or procured from different sources.
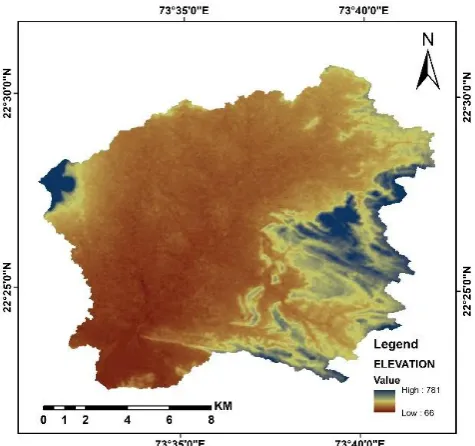
[image:2.595.308.546.50.273.2]DEM is the basic unit for the catchment delineation process in SWAT and used to determine the drainage network of the landscape and parameters affecting the basin. For the present study, CARTOSAT-1 DEM (30 m x 30 m resolution) was downloaded from ISRO’s bhuvan.nrsc.gov.in website. The DEM shows highest elevation as 761 m and lowest as 66 m of study area. The study area's northern and southern parts are having low elevation range while the greater altitude is observed in the eastern and western parts. DEM was used to obtain slope, direction of flow and accumulation, network of streams and outlet points.
[image:2.595.311.544.383.631.2]Fig. 2. Digital Elevation Model of Deo River Sub-basin Landsat-8 (Land Satellite 8) image is used to prepare Land use map which was downloaded from earthexplorer.usgs.gov. The study area is classified into 7 classes having attributes spatial resolution of 30 meter in WGS_1984_UTM_Zone_43N projection. They are follows: (1) Deciduous forest area, (2) Agriculture area, (3) Pastures , (4) Range bushes, (5) Urban area, (6) Barren area and (7) Water bodies.
International Journal of Innovative Technology and Exploring Engineering (IJITEE) ISSN: 2278-3075,Volume-8 Issue-12, October 2019
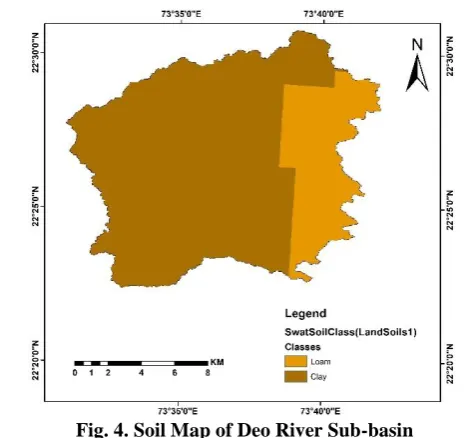
Fig. 4. Soil Map of Deo River Sub-basin
Daily minimum temperature (℃) and maximum temperature (℃) data were collected from State Water Data Centre (Gandhinagar). Rainfall data of Deo dam and Shivrajpur rain-gauge stations were collected for the years 2000-2017. Deo dam weather station was chosen for temperature data and model period was set to be 2000 to 2017 due to unavailability of previous years datasets. Daily inflow data from 2002-2017 was collected from the office of Deo dam.
D. Model Set-up
[image:3.595.307.545.97.559.2]The main steps involved in GIS interface of ArcSWAT are Watershed delineation, HRU analysis, Write Input Tables (weather data) and SWAT run. Flow chart of SWAT model is shown in Fig. 5.
Fig. 5. Methodology of SWAT Model
Watershed is delineated with DEM as main input and for HRU analysis Land use map and soil map are required. HRU (Hydrologic Response Unit) is a distinctive mixture of land use, soil and slope characteristics. 94 HRUs were generated giving thresholds of 5% for land use, 5% for soil and 10% for slope. Then rainfall (mm) and maximum and minimum temperature (℃) were given as input for SWAT Run. At last SWAT run is performed entering the starting and ending date
Delineated watershed having 7 sub-basins is shown in Fig. 6. Watershed was divided in five slope class ranges with 55% of watershed area falling in slope range of 0-10% as shown in Fig. 7.
Fig. 6. Map Showing Sub-basins of Study Area
Fig. 7. Slope Map of Deo River Sub-basin
E. Model Calibration and Validation
It is important to carry out Calibration in the development of any hydrological model. That shows precise and realistic physical procedures taking place within the basin. Management parameters, ground water parameters, soil parameters and main channel parameters are more influential to the runoff system have been used. This study considered a calibration period of eleven years, from 2000-2012, including two years of warm-up, i.e. 2000 and 2001. To execute the calibration technique, ten parameters were used.
[image:3.595.48.289.449.648.2]SWAT-CUP
to analyze sensitivity giving lower and upper bound ranges of the parameters and using Replace (R_) and Absolute (V_) methods to get the parameter ranges more smaller .
Validation of the model was performed at the same observation stations used for Calibration. All the input parameter ranges used for calibration in this method stayed unchanged. A validation period of five years, i.e. from 2013-2017, was taken for the current research.
F. Model Performance Evaluation Indices
Model performance is evaluated by various indices, which are as follows: (1) Coefficient of Determination (R2) and (2) Nash–Sutcliffe Efficiency (NSE) to evaluate the model performance for the data acquired at two rain gage stations. Computing P and R factors can be used to analyze a better evaluation of the model during calibration and validation.
Coefficient of Determination (R2) ranges from 0.0 to 1.0, where greater value indicates a better agreement. R2 is calculated by equation as follows:
2
2 1
2 2
1 1
[
(
')(
')]
(
')
(
')
n
i i
i
n n
i i
i i
X
X
Y
Y
R
X
X
Y
Y
(3)Where, n is the number of measured data, Xi and Yi are the
measured and predicted data at time i, X' and Y' are the mean of measured and predicted data.
Nash–Sutcliffe efficiency is the second method used. This objective function best illustrates the model performance. Its value lies between -∞ to 1, where NSE= 1 shows that the observed values are same as the simulated values. Negative values show that the mean measured value is greater than the simulated values. The NSE indicates the degree of fitness by drawing 1:1 for observation versus simulation data. The effectiveness of NSE can be determined according to the equation:
2
1
2 1
(
)
1
(
')
n
i i
i n
i i
X
Y
NSE
X
X
(4)Where, n is the number of measured data, Xi and Yi are the
measured and predicted data at time i, X' is the mean of measured data.
IV.RESULTS AND DISCUSSION A. Evaluation of SWAT Check Results
Water Balance Components of Deo River Sub-Basin Generated by SWAT
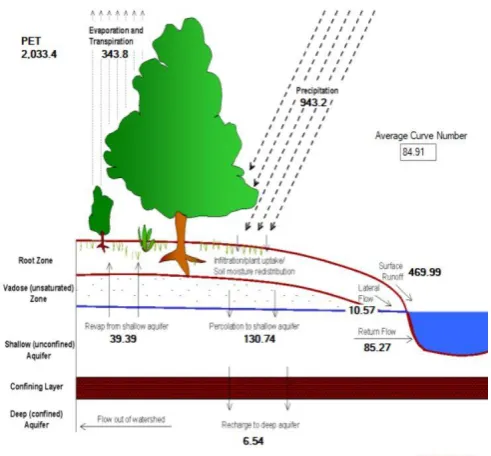
[image:4.595.305.551.58.286.2]From the Fig. 8., it can be said that from total precipitation, 49% is obtained as surface runoff, 13% as percolation, 36% as evapotranspiration and 1% as deep recharge and lateral flow. So, 49% of precipitation flows as surface runoff. Curve number value obtained is 84.91 which is near to 100 so it indicates that runoff will be more.
Fig. 8. Water Balance Components of Deo River Sub-basin Generated by SWAT Check Simulated Runoff by Different Land Use Classes
[image:4.595.310.557.409.524.2]It can be observed from Fig. 9. that maximum runoff is contributed by barren land (22%) then followed by urban land cover (18%). More runoff is observed from agricultural (17%) and pasture land (15%) than forests (14%) and bushes (14%).
Fig. 9. Simulated Runoff by Different Land Use Classes Comparison of Average Monthly Observed and Simulated Runoff of Calibration Period
International Journal of Innovative Technology and Exploring Engineering (IJITEE) ISSN: 2278-3075,Volume-8 Issue-12, October 2019
Fig. 10. Comparison of Average Monthly Observed and Simulated Runoff
B. Calibration And Validation Results
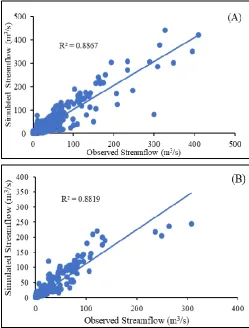
[image:5.595.306.541.201.533.2] [image:5.595.311.550.211.322.2]For Calibration R2, NSE, PBIAS and RSR values obtained from SWAT-CUP are 0.89, 0.87, -3.8 and 0.37 respectively. For Validation R2, NSE, PBIAS and RSR values obtained are 0.88, 0.81, -30.6 and 0.43 respectively.
Table I. Calibration and Validation Results
R2 NSE PBIAS RSR
Calibration
(2000-2012) 0.89 0.87 -3.8 0.37 Validation
[image:5.595.45.281.271.358.2](2013-2017) 0.88 0.81 -30.6 0.43 Scatter graph of Daily Observed and Simulated Stream Flow During Calibration (2000-2012) and Validation (2013-2017) are shown in Fig. 11.
Fig. 11. Scatter Graph of Daily Observed and Simulated Stream Flow During (A) Calibration (2000-2012) and (B)
Comparison of Observed and Simulated Streamflow During Calibration and Validation
As shown in Fig. 11. and 12., the observed and simulated stream flow are very near except few days. The model anticipated the flow of the stream with very nice precision throughout the assessment. However, later, the model overestimated the streamflow, due to sudden increase in the value of stream flow, during July, August in the years 2004, 2005, 2013 and 2017. This is because during these periods a very high amount of precipitation had occurred. Most of the time the model estimates nearly the observed stream flow.
Fig. 11. Comparison of Observed and Simulated Streamflow During Calibration (2000-2012)
Fig. 12. Comparison of Observed and Simulated Streamflow During Validation (2013-2017) C. Sensitivity Analysis
The most sensitive parameters affecting the amount of runoff for the study area are shown in Table 2. These ranks were obtained according to the objective function: the P-Value of parameters for calibration between the observed and simulated values. Parameter having least p-value has the highest sensitivity. The management practices, soils and groundwater parameters in the study area have a major influence on the streamflow by.
The management properties of the basin are always a key factor in estimating runoff. Here also management parameter like Initial SCS Surface Runoff Curve Number II is found to be the most or first sensitive showing that land use, planting, harvesting, irrigation applications, tillage operation and soil permeability of the basin influences the runoff flow.
[image:5.595.46.296.399.728.2]SWAT-CUP
[image:6.595.308.555.54.341.2] [image:6.595.43.295.106.460.2]susceptible, a parameter describing the reaction of groundwater flow to modifications in fluid refueling. This assessment of sensitivity shows that the flow of this region is also controlled by the ground water flow.
Table II. Sensitivity Analysis Result of Parameters Parameter Name Parameter Name in
SWAT-CUP
P-Value Sensit -ivity Rank Initial SCS Runoff
Curve Number II
R_CN2.mgt 0.00 1
Available Water Capacity Factor
R_SOL_AWC().sol 0.02 2 Base Flow Alpha
Factor
V_ALPHA_BF.gw 0.14 3
Groundwater "revap" Coefficient
V_GW_REVAP.gw 0.17 4
Soil Evaporation Compensation
Factor
V_ESCO.hru 0.18 5
Saturated Hydraulic Conductivity
R_SOL_K().sol 0.32 6
Threshold Depth Of Water In The Shallow Aquifer Required For Return Flow To
Occur
V_GWQMN.gw 0.79 7
Groundwater Delay Time
V_GW_DELAY.gw 0.82 8
Deep Aquifer Percolation Factor
V_RCHRG_DP.gw 0.84 9
Threshold Depth Of Water In The Shallow Aquifer For "Revap" To
Occur
V_REVAPMN.gw 0.99 10
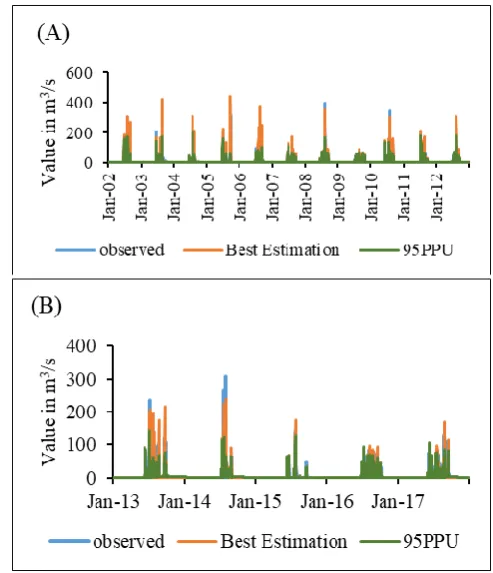
D. Uncertainty Analysis
P and R factors are used to determine the degree of uncertainty in the calibrated model. Range of P-factor and R-factor is 0 to 1 and 0 to ∞ respectively. P-factor of 1 and R-factor of 0 show that simulation data tightly match the measured data. To determine the efficacy of the calibrated model, to what extent these factors deviate from these suggested statistics are used. Local precipitation variations, sudden changes in climatic conditions, the dam design and reservoirs influencing the hydrology of the study area participates in the uncertainty.
In this study, by altering the boundaries of parameters through trial and error method, the upper limit and lower limit of the parameters were set to minimize uncertainty. The calibration P-factor and R-factor were discovered to be 0.46 and 0.00 respectively. The validation P-factor and R-factor were discovered to be 0.43 and 0.00 respectively. Since the P-factor lies between 0-1 and the R-factor is 0, calibration and validation can be regarded satisfactory for this research.
Fig. 8. Illustration of Full SWAT-CUP Output Showing (A) Calibration and (B) Validation, the Observed, the Simulated and the 95% Prediction Uncertainty (95PPU)
V.CONCLUSION
Average annual precipitation of 16 years (2002-2017) was found to be 929 mm. Maximum precipitation is obtained as surface runoff i.e. 49% followed by evapotranspiration (36%), percolation (13%) and deep recharge and lateral flow as 1% which is also proved by the obtained Average Curve Number as 84.91 indicating a good amount of runoff can be obtained at outlet point. Nash Sutcliff efficiency (NSE), R2 value, PBIAS and RSR values obtained for calibration are 0.87, 0.89, -3.8% and 0.37 respectively and for validation as 0.81, 0.88, -30.6% and 0.43 respectively, showing a good model performance. Sensitivity analysis was also performed using LHS-OAT (Latin Hypercube Sampling and One-at-a-time) technique and out of 10 calibrated parameters 3 parameters of higher sensitivity ranks are Initial SCS runoff curve number II, Available water capacity of the soil layer and Base flow alpha factor. Examination of these sensitive parameters disclosed that both surface water and groundwater flow features influences the streamflow in this region.
[image:6.595.43.293.107.465.2]International Journal of Innovative Technology and Exploring Engineering (IJITEE) ISSN: 2278-3075,Volume-8 Issue-12, October 2019
REFERENCES
1. Aadhar S., Swain S. and Rath D. R. (2019), “Application and performance assessment of SWAT hydrological model over Kharun river basin, Chhattisgarh, India”, American Society of Civil Engineers, World Environmental and Water Resources Congress 2019, 272-280. 2. Abbaspour K. C. (2019), " SWAT-CUP: SWAT Calibration and
Uncertainty Programs - A User manual".
3. Alipour M. and Hosseini M. (2018), “Simulation of surface runoff in Karaj dam basin, Iran”, Springer, Applied Water Science 2018 Vol. 8(147).
4. Arnold J. G., Moriasi, D. N., Gassman P. W., Abbaspour K. C., White M. J., R. and Srinivasan C. et al., “SWAT: model use, calibration, and validation”, American Society of Agricultural and Biological Engineers, Transactions of the ASABE, Volume 55(4): 1491-1508. 5. Boupha K. and Sourinphomy K. (2015), “Rainfall-runoff simulation
using Remote Sensing and GIS Tool (SWAT Model) (A Case Study: Xebanghieng Basin in Lao PDR)”, Journal of Natural Sciences Research, Vol.5, No.1, 2015.
6. Mehan S., Neupane R. P. and Kumar S. (2017), “Coupling of SUFI-2 and SWAT for improving the simulation of streamflow in an agricultural watershed of South Dakota”, Hydrology Current Research Journal, Volume 8, Issue 3.
7. Narsimlu B., Gosain A. K. and Chahar B. R. (2013), “Model calibration and uncertainty analysis for runoff in the Upper Sind river basin, India using Sequential Uncertainty Fitting 2”, American Society of Civil Engineers, World Environmental and Water Resources Congress, 3257-3266.
8. Santra P. and Das B. S. (2013) “Modeling runoff from an agricultural watershed of western catchment of Chilikalake through ArcSWAT”, Journal of Hydro- environment Research, Volume 7(4), 261-269. 9. Shivhare V., Goel M. K. and Singh C. K. (2014), “Simulation of
surface runoff for upper tapi sub catchment area (Burhanpur Watershed) using SWAT, The International Archives of Photogrammetry, Remote Sensing and Spatial Information Sciences, Volume 40(8).
10. Singh V., Bankar N., Salunkhe S. S., Bera A. K. and Sharma J. R. (2013), “Hydrological stream flow modelling on Tungabhadra catchment: parameterization and uncertainty analysis using SWAT CUP”, Current Science(Bangalore), Volume 104 Number 9, 1187-1199.
11. Tejaswini V. and Sathian K.K. (2018), “Calibration and Validation of SWAT Model for Kunthipuzha basin using SUFI-2 algorithm”, International Journal of Current Microbiology and Applied Sciences, Volume 7, Number 1, 2162-2172.
12. Yaduvanshi A., Sharma R. K., Kar S. C. and Sinha A. K. (2018), “Rainfall–runoff simulations of extreme monsoon rainfall events in a tropical river basin of India”, Springer journal, Natural Hazards 90:843–861.
AUTHORSPROFILE
Mansi Parikh,P.G. Student, Water Resources Engineering and Management Institute, Faculty of Technology and Engineering, The Maharaja Sayajirao University of Baroda, Vadodara, Gujarat, India.
Dr. Falguni Parekh is Ph.D. in Civil Engineering from The M.S. University of Baroda, Vadodara, Gujarat, India. She is serving as Associate Professor in Water Resources Engineering and Management Institute, Faculty of Technology and Engineering and recognized Ph.D guide of The M. S. University of Baroda. She has 19 years of research experience and teaching experience. Her areas of research include Reservoir Operation, Soft computing techniques, Micro Irrigation , Benchmarking of Irrigation Projects, Climate Change and its Impact on Water Resources, Rain Water Harvesting, and Low cost Micro Irrigation Systems. Dr. Parekh is Life Member of various professional bodies like Indian Society of Hydraulics, Indian Water Resources Society, Association of Hydrologists of India and Association of Agrometeorologists and Indian Society of Geomatics. She is chairman of Board of studies of