International Journal of Innovative Technology and Exploring Engineering (IJITEE) ISSN: 2278-3075,Volume-8 Issue-11, September 2019
Abstract: In the generic sense, Gene Selection methods are implemented upon a huge gene bank to decisively corner and expose certain genes that are indicative of say, diseases with their own set of classifications. The lightening surge about the DNA microarray dataset and its huge influence in the scientific realm has led different fields with the likes of Ecology, Bioinformatics, Computer Science, etc., making giant strides in their respective researches. DNA microarray research field threw open a desirable scope for path-breaking methods to be employed for gene selection, aimed at classifying those informative genes. Gene expression data classification is realized and aspired at the wake of a huge data size, boasting a usually miscellaneous yet a dissuasive composition that serves a challenge for data miners. The ideas and research work expressed below is a cohesive approach where a hybrid method linking every filter method (Information Gain / Pearson Correlation Coefficient / Relief-F) with that of wrapper (Genetic Algorithm / Forward Selection Backward Elimination / Practical Swam Optimization), through all permutation and combination, the accuracy of gene data (after being put through Support Vector Machine (SVM) model classifier) is optimized to the maximum and authenticated, yielding the optimum results in accordance with the requirements. Comparison between all filter, wrapper and hybrid methods are done by applying it on three microarray cancerous dataset.
Index Terms: DNA microarray, Gene selection, High dimensionality, Gene expression, SVM,
I.INTRODUCTION
Technology availability, concerning the concept of DNA microarray dataset for expressive gene classification has persuaded the researchers on a discovery spree, driving innovations in methods that help optimize the accurate results of selected genes informative of any disease. Such methods with their in-built gauging mechanisms to measure expression level, could enable a relative method to effect precision on that level to which a classified gene could express the needful about the presence of any form of illness. This would save time and cost of remedies involved in cure. Diseases like cancer, if diagnosed late could lead to life threatening consequences, increasing the probability of the inevitable end. Such advanced methods for informative genes could help in decreasing that time span by which an impending disaster to a concerned family could be averted,
Revised Manuscript Received on September 05, 2019.
Suchishree Panda, Department of Computer Science and Engineering, Siksha ‘O’ Anusandhan Deemed to be University Bhubaneswar, Odisha, India.
Kaberi Das, Department of Computer Science and Engineering, Siksha ‘O’ Anusandhan Deemed to be University, Bhubaneswar, Odisha, India.
Debahuti Mishra, Department of Computer Science and Engineering, Siksha ‘O’ Anusandhan Deemed to be University, Bhubaneswar, Odisha, India.
Ashwini Kumar Pradhan, Department of Computer Science and Engineering, Siksha ‘O’ Anusandhan Deemed to be University, Bhubaneswar, Odisha, India.
and mitigate the circumstances which otherwise would have ended undesirably had the process been carried out with conventional and obsolete methods in any medical lab [1].Microarray dataset concept incorporated in the overall technology to enhance expressive genes classifying performance has made the task much easier which was otherwise seemingly impossible to trace the relevant and informative genes from a huge number through traditional methods. Those selected genes are instrumental in developing cure for several diseases that are once identified [2]. Thus gene selection methods are aimed at optimizing the overall process of disease identification and remedy before it’s too late. Technically these methods specify the desired informative and expressive genes, differentiating them from the unwanted ones, from the entire gamut of dataset of genes, smoothening the difficult task of genes calculation [3, 4]. There are four different types of gene selection methods explained below. They are filter method, wrapper method, embedded method and hybrid method. Filter approach is a simple one that analyses discretely each and every gene to achieve best results. Complexity in case of a filter method is low and some redundancies could be found even in the pool of selected genes, owing to lack of inter-dependency between them. It is a classifier independent method. The genes with best analytical value are selected through this method. Wrapper method is a modified approach that enhances the performance of gene selection through classifier. So complexity of searchscope is very high in this case [5]. Embedded method is an approach that uses the advantages of a sample data set preferred to diagnose, then select the most desirable gene with the highest accuracy of conveying information. One of the characteristics is that its computational complexity is really high. These standalone methods defined objectively above are yielding even better results with a much more refined accuracy only when integrated together into a hybrid process. As per the analysis in the last decade, the overall impact of a hybrid method has always been more effective and efficient than any of the above mentioned methods when carried out separately for the same selection purpose. As per this work, the hybrid process is a combination of filter and wrapper method. In this process, filter approach is employed to signify and expound the correlation level between the genes and by what magnitude. It sorts accordingly the selected genes based on how much information they are able to lend, in a sequential order after that array of dataset qualifies beyond a certain threshold value, keeping the classification target in mind [6, 7, 8, 9, and 10].
A Combined Filter Wrapper Classification Method
for Gene Selection from Gene Expression Datasets
Then wrapper method is employed to identify the most discrete gene or a set of genes from the optimal subset of genes selected through filter approach [11]. As far as the technique goes on this paper, three stage gene selection mechanism are compared that are filter, wrapper and hybrid. At first, three predefined filter methods namely Information Gain (IG), Pearson Correlation Coefficient (PCC), Relief-F are used to select and sort a subset of genes from a larger set that express information to a magnitude which is immediately above a certain value that serves as a qualifying mark, when quantified. Then the SVM classifier is used to measure the accuracy independently. Secondly, the wrapper approach, three types namely Genetic Algorithm (GA), Practical Swarm Optimization (PSO) and Fordward Selection Backward Elimination (FSBE) are employed to select a subset of genes again having gone through SVM classifier to determine accuracy by default. In the hybrid process, each filter method is combined with all wrapper methods constituting all combinations. All these combinations say IG-GA, IG-PSO, IG-FSBE, PCC-GA, PCC-PSO, PCC-FSBE, Relief-F-GA, Relief-F-PSO and Relief-F-FSBE are used to form an exclusive subset of genes which when put further through SVM classifier yet again, yields the most optimum level of accuracy in conveying information about anything. Lastly, comparison of all the methods that explained before are done and result is discussed later in experiment section.
II. METHODSANDMATERIALS
A.Relief-F
This particular type of algorithm is not restricted to data type [12]. Owing to its efficiency and portability it is a multi-tasking method, it can handle and resolve multi-class problems. Relief algorithm [13] as proposed and propounded by Kira and Rendell in the year 1992, is comparatively a more reliable filter-type gene selection method. The running time of Relief algorithm is directly proportional to the sampling times say m and the number of original genes n. Hence an increase with an increase which decisively boosts the efficiency. Owing to its efficiency and simplicity it is a widely used algorithm for gene selection. However, it has its share of disadvantages in a situation where it fails to serve its own purpose when data goes missing. Also this method is confined to only 2 categories of data. Taking these drawbacks into account, Kononenko enabled necessary changes and modifications in the then existing algorithm and came up with a revised version of Relief algorithm, to be called as Relief-F algorithm in the year 1994. This revised method could handle data classification beyond a mere 2 categories, unlike the previous version. This new algorithm included an added method that had the exclusivity about dealing with data missing scenario. If the attribute trend of data missing is continuous then it would be replaced by mean value of the gene of training set; if the attribute trend of missed data is discrete then it could be replaced with the highest frequency value of the training set. On dealing with multi-class problem, Relief-F makes a random selection of sample R from the training set. Then, it finds out the approximation or the justifiable estimates of K with regards to near hits and
misses about the same class and each different class respectively. The weight of each gene gets upgraded and updated. As the action above is repeated m number of times, the desired number of genes with their weights could be attained [14].
B. Information Gain
Information gain is another filter method which could be used for gene selection [19], sometimes could be handier and effective than Pearson’s Correlation Coefficient method. Information with a negative coefficient about entropy, found in a distinct and disparate scattering of say gene X is expressed as:
H(X) = (1) Where xi are the distinct gene values, whereas p(x) denotes
probability. Continuous genes or probably expressive genes are discretized or an integration technique is employed instead of summation through inclusion of Kernel function, to determine the approximation of the density of gene X, with the following expression:
H (Y, X) = − ∑i ∑j p (y j, xi) (y j, xi) (2) From the expression above, p(y, x) is for denoting joint probability. Mutual information is one of the important basis for gene importance. MI is calculated as MI (Y, X) = H(Y) + H(X) – H (Y, X) and is equated with the Kullback-Leibler divergence concept. The expression is as mentioned below:
M I (Y, X) = (3) The dimension of significance increments just when the shared data (MI) between the objective and the quality dispersions is bigger. Data Gain is a comparative necessity where IG (Y, X) = H(Y) H(Y/X) is the determined distinction between data put away in the circulation of class H(Y), and data after the quality esteem dispersion has been thought about. For example the contingent data H(Y/X).
C. Pearson’s Correlation Coefficient
Correlation based gene selection approach finds the important genes from the high dimensional data fastly and eliminate the unsuitable and needless gene [21]. Finally, limited genes are nominated and it is given to the classifier for guessing the class label.
This method is (named after Karl Pearson) could be used to define and comprehend the strength about the linear relation concerning two data samples. PCC is mathematically or statistically calculated as the covariance of two variables divided by the product of standard deviation of each data sample. Normalizing the covariance between the two variables yields an interpretable score.
International Journal of Innovative Technology and Exploring Engineering (IJITEE) ISSN: 2278-3075,Volume-8 Issue-11, September 2019
A positive correlation ensures variables moving in one direction whereas, a negative correlation renders this movement dynamic inverted, that is, the variables moving in opposite directions. Or if a variable containing value increases, against it, or at its wake, the value of the other variable decreases.
The Correlation Coefficient expression is given below:
Cov(X, Y) = (4)
N = Sample size
Dependency for N cases in a dataset could be calculated between the variables X and Y, on utilizing the means of X and Y, denoted as X’ and Y’
ℽ (X, Y) = (5)
If CC between two variables are higher than say 0.6 or 0.7, then one of them could be removed from the datasets, thus getting rid of the miscellaneous as well as the redundant data from the entire set and bringing more exclusivity to the accuracy levels at the subset of expressive genes conveying sensitive information.
D.Genetic Algorithm (GA)
Roused by the procedure of normal choice and the work dependent on heuristic methodology, the possibility of GA as one of the quality determination component was imagined in the year 1975 by John Holland. The natural genetic schematics in the GA, helps it in addressing the optimization issue. The operational prudence of GA has two basic categories with the likes of crossover and mutation. The GA is comprised of two tuning factors. They are (a) Pc crossover probability and (b) Pm mutation probability. Once the tuning parameters with its corresponding values are adjusted, the convergence for a solution is further optimized and enhanced. Owing to its tremendous adaptability, GA method is highly regarded as a robust form of gene selection method to finding any optimal solution as per the requirements. It is an evolutionary computation method with well-known search mechanisms [20]. GA is a desirable wrapper approach based gene selection method, as far as sorting out the relevant genes from a high dimensional dataset is concerned. However, some of the existing wrapper approach GA processes have yielded solutions below par owing to an increase in the level of computing burden. Going through GA parameters, the operators of crossovers and mutation are connected via binary parameter values. Through means of binary enabled GA, an idea of virtual letter sets was presented in the year 1991 by Wright [22]. SVM classifier served as a fitness method, caused a significant reduction in terms of genes. It refines and smoothens the computational process required for establishing the subset of expressive and informative genes.
For this research, this method could be utilized in establishing the subset for important genes from expressive genes data required to convey traits about cancer.
The datasets used in this GA method helps itself getting segregated into as many as ten different such smaller sets, where one would be picked for testingagainst the remaining
ones as the training lots, based on which the expressive gene classification could be done.
E. Practical swarm optimization
In the year of 1995 Kennedy and Eberhart [15] explored a method also called as a metaheuristic approach for gene selection named as PSO. This type of algorithm is the state of the art modern gene selection technique developed and evolved with the passage of time and space, citing the obsolete aspects of the existing methods. This algorithm is inspired from the bird foraging behavioral patterns. PSO’s principle objective is to obtain optimum results, possible through a mandate achieved in the collaboration and sharing of knowledge among the individuals in a group. This optimization technique is instantiated through a group of random particles. In a d-dimensional target search space, particle i is spatially indexed in the particle swarm expressed as Xi = (Xi1, Xi2… Xid) and flies with a velocity Vi = (Vi1,
Vi2…Vid) in the search space. The problem of objective optimization could be solved through particle spatial location. The fitness value once calculated is helpful in determining the fitness of the particle. Particle velocity adjusts the particle in its spatial position, then Particle Swarm Optimization succeeds in yielding optimal solution through iteration [16]. Particle i’s index alongside velocity in space j is following: T is iteration while w is coefficient for inertia, and rand
() is a function denoting random numbers falling in between 0 and 1, and.... is the local optimal index through which particle i pass via search space.
To fulfil the requirements of distinct and recognizable issues, Kennedy and Eberhart [17] came up with a binary-code enabled algorithm called as PSO Algorithm, with velocity of particle assigned index of particle with a 1 probability factor, necessitated to convert function of speed with the likes of 0s and 1s.
The function of fitness is integral to PSO algorithm, determining advantages and disadvantages of gene subset, employing the algorithm required for understanding and learning classification concept [18]. Datasets with high dimension, has in it the utility of the above mentioned classifying algorithm in the form of fitness function, results in time and memory overhead really high. Rate of inconsistency obviously indicates with precision a certain level of consistency pitted against the exact opposite, highlights the benefits and drawbacks of gene subset. Rate of inconsistency’s impact is ordinarily organic, and with minimum level of complication going by computing abilities, as far as the removal of irrelevant and redundant genes are concerned. Thus this research work chose inconsistent rate aspect as a function handy to PSO algorithm.
(7) P denotes the summation of all samples, and all possible combinations of expressive genes are defined to be a pattern for an instance of a sample. The sum total of inconsistency is denoted by the variable Nin subjected to all patterns in a gene subset, where Nin is total sample as in the pattern minus the sum total of recurring labels.
F. Forward selection backward elimination
For all intents and purposes any blend of hunt methodology and displaying calculation can be utilized as a wrapper. Highlight subset age for multivariate channel relies upon the hunt system. While there are many inquiry systems, there are four regular beginning stages for highlight subset age (i) Forward selection, (ii) Backward elimination, (iii) Bidirectional Selection and (iv) Heuristic element subset determination.
Mix of both forward determination and in reverse end is known as bidirectional pursuit. The stepwise forward determination and in reverse end technique can be consolidated so that at each progression, the methodology chooses the best characteristic and expel the most noticeably awful from the rest of the properties.
Forward decision routinely starts with an unfilled rundown of abilities and a short time later considers adding somewhere around one features to the set backward transfer typically starts with the whole features set and thinks about removing no less than one features from the set. Bidirectional request starts from the opposite sides, from an unfilled set and from the whole set at the same time contemplating greater and more diminutive component subset.
III. EVALUATIONANDRESULTS
A. Data sets
The datasets which we have utilized for this examination work are Bone Tumor Data, Lung disease data and dangerous melanoma-skin malignant growth data.
Bone Tumor Data: This dataset comprises of microarray gene expression data set profiles of 101examples which are gathered from bone-disease patients. Each example contains 1296 genes. We have isolated the information in two sections preparing set and test set. Among 101 examples, 61 training set and remaining 40 are the test set. The crude quality information gathered from International Collaboration on Cancer Reporting (ICCR).
Lung cancer: This dataset comprises of microarray gene expression data set profiles of 94 samples which are gathered from bone-disease patients. Each example contains 1296 genes. We have separated the information in two sections training set and test set. Among 94 samples, training set contains 57 and the test set contains remaining 37. This dataset has gathered from International Collaboration on Cancer Reporting (ICCR).
Malignant melanoma: This dataset comprises of microarray gene expression data set profiles of 79 samples which are gathered from bone-malignancy patients. Each example contains 1296 genes. We have isolated the information in two sections training set and test set. Among 79 training set contains 48 and the test set contains remaining 31 samples.
This dataset has gathered from International Collaboration on Cancer Reporting (ICCR).
Data set name
Total samples/ attributes
training set
test set
No. of
genes in each samples
Lung cancer
94 57 37 1296
skin cancer
79 48 31 1296
Bone cancer
101 61 40 1296
B. Result Discussions
Experimental results are shown in below tables and graphs. Table 1 shows the average accuracy of diverse classifiers on the lung cancer dataset by proposed filter algorithms. In order to evaluate the accuracy of different methods discussed before, in DNA microarray data processing, it is used in three gene data sets of Bone Tumor Data, Lung cancer Data and malignant melanoma- skin cancer Data. The dataset is briefly described before. The classic classifier used in this paper is SVM. This work compares accuracy of classification of the three datasets by fifteen gene selection algorithms. Form the fifteen gene selection methods there are three filter selection method (information gain, relief-f, Pearson coefficient correlation), three wrapper selection method (GA, PSO, FSBE and nine hybrid methods (IG-GA, IG-PSO,IG-FSBE, PCC-GA, PCC-PSO, PCC-FSBE, Relief-F-GA, Relief-F-PSO and Relief-F-FSBE).
i. Results with Filter gene selection methods: Table 1. Accuracy for Lung cancer dataset
Filter Method Accuracy Execution Time
Relief-f 94% 3.8323
Infogain 88% 3.9991
CFS 72% 0.7659
Table 1 proves that for Lung cancer dataset maximum accuracy 94% is achieved by Relief-F and minimum accuracy is 72% is achieved CFS using SVM classifier. But in the execution time point of view CFS gives accuracy with less amount of time.
Table 2. Accuracy for malignant melanoma dataset Filter Method Accuracy Execution Time
Relief-f 83% 0.9785
Infogain 80% 3.0844
CFS 61% 0.6815
International Journal of Innovative Technology and Exploring Engineering (IJITEE) ISSN: 2278-3075,Volume-8 Issue-11, September 2019
Again CFS gives result with less execution time. For both Lung cancer data and malignant melanoma Relief-F gives highest accuracy and CFS gives lowest accuracy, but while execution time is considered CFS is best because it provides result with less execution time as compared to Relief-F and Info gain.
Table 3. Accuracy for Bone tumor dataset Wrapper Method Accuracy Execution Time
Relief-f 72% 1.1833
Infogain 85% 2.8330
CFS 60% 0.7760
According to Table3 while Relief-F, Infogain and CFS is applied for Bone tumor data there is some changes i.e. here Infogain provides maximum accuracy with SVM classifier and CFS gives minimum accuracy. And execution time for CFS is minimum compare to other.
Form Table 1, Table 2, Table 3 we got the result that for each data set, the accuracy and execution time for CFS algorithm is the minimum.
ii. Results with Wrapper gene selection methods:
For wrapper gene selection method we use GA, PSO and FSBE in this work. Table 4 shows accuracy and time complexity for all three wrapper gene selection method applied on Lung cancer.
[image:5.595.33.284.409.473.2]
Table 4. Accuracy for Lung Cancer dataset
For Lung cancer PSO gives maximum accuracy 75% and FSBE gives minimum accuracy 55% with SVM classifier. Table 5 and Table 6 shows the results for wrapper gene selection approach with malignant melanoma skin cancer data set and bone cancer data set respectively.
Table 5. Accuracy for malignant melanoma dataset
Wrapper Accuracy Execution Time
PSO 62% 4.1800
GA 29% 2.8314
FSBE 31.25 % 1.9857
For Malignant melanoma cancer PSO gives maximum accuracy 62% and GA gives minimum accuracy 29% with SVM classifier shows in Table 5.
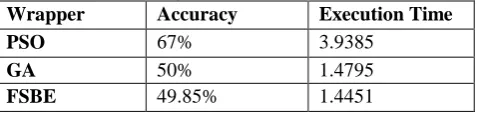
Table 6. Accuracy for Bone Cancer dataset
Wrapper Accuracy Execution Time
PSO 67% 3.9385
GA 50% 1.4795
FSBE 49.85% 1.4451
For Bone cancer PSO gives maximum accuracy 67% and FSBE gives minimum accuracy 49.85% with SVM classifier shows in Table 6.
iii.Results with Hybrid models for gene selection:
Main intention of this work is to compare different types of proposed hybrid models applied on three microarray data sets. Accuracy of all the hybrid models with different data sets are shown in the below tables. Table 7, Table 8 and Table 9 shows the results for PSO, GA and BDS hybridized with different filter methods applied on Lung cancer, Bone cancer and Malignant melanoma skin cancer data set. It shows accuracy and time complexity each hybrid model with all data set described.
Table 7. Results for 3 data sets with Infogain filter
Infogain + PSO Infogain + GA Infogain + FSBE
Datas et Accura cy Time compl exity Accura cy Time comple xity Accura cy Time comple xity Lung cance r
94.59% 4.894
7
97.30% 3.1744 93.30% 4.2614
Skin Canc er) 78.38% 8.032 5
72.97% 5.2062 87.54% 4.5744
Bone cance r
90% 8.036
5
75% 4.0552 68% 4.1246
Table 7 shows accuracy and time complexity of Infogain + PSO, Infogain + GA and Infogain + FSBE with three microarray cancerous data set. Infogain with genetic algorithm performs best result with the accuracy of 97.30% for Lung cancer as compared to others. For malignant melanoma skin cancer data set Infogain gives good result with FSBE with 87.54%. But for Bone tumor data set Infogain + PSO performs well with the accuracy of 90%.
Table 8. Results for 3 data sets with Relief-F
Relief- F+ PSO Relief-F + GA Relief-F + FSBE
Datas et Accura cy Time compl exity Accura cy Time Comp l exity Accura cy Time Compl exity Lung cance r
100% 4.8089 91.89 % 1.572 0
99.99% 1.60
Skin cance r
72.97% 5.4053 81.08%
8.620 6
91.89% 2.1025
Bone cance r
97.50 % 8.6482 85% 2.074
0
75% 3.0910
Results for Relief- F+ PSO, Relief-F + GA and Relief-F + FSBE are shown in the Table 8. Accuracy and time complexity of hybrid methods with different data sets are shown in this table. For Lung cancer data set Relief-F+PSO gives the best result with 100% accuracy, and for Skin cancer data set Relief-F and FSBE gives the best result of 91.89% again for Bone cancer data set Relief-F and PSO gives best result of 97.50%.
Wrapper Accuracy Execution Time
PSO 75% 7.5442
GA 56% 5.1748
FSBE 55% 4.2189
[image:5.595.49.288.704.761.2]Table 9. Results for 3 data sets with CFS
CFS + PSO CFS + GA CFS + FSBE
Dataset Accur a cy
Time compl exity
Accura cy
Time compl exity
Accura cy
Time compl exity Lung
cancer
89.99 %
4.46 94.59% 1.0991 91.23% 1.3891
Skin cancer
54.05 %
14.020 6
64.86% 8.1540 86.58% 1.2881
Bone tumor
82.50 %
5.8222 65% 1.5829 67% 2.0316
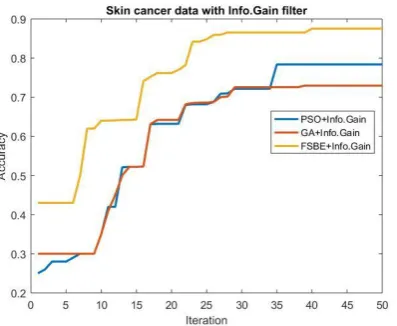
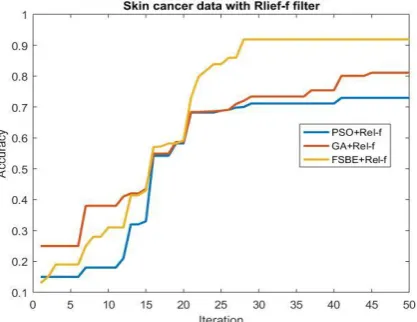
[image:6.595.314.523.282.460.2]In this work, SVM classifier is used to verify the classification accuracy of the all algorithms. Figure 1, Figure 2 and Figure 3 demonstrates the graphical representation for the classification accuracy of the hybridized model of Infogain filter and three wrapper (PSO, GA, FSBE) methods applied on three data sets i.e. Lung cancer, Skin cancer and Bone cancer respectively. Figure 4, Figure 5, Figure 6 respectively shows the classification accuracy of CFS filter hybridized with three wrapper methods applied on the Lung cancer, Skin cancer and Bone cancer data sets. Classification result of the hybrid models which are the combination of Relief-F with three wrapper methods applied on Lung cancer, Skin cancer and Bone cancer are shown in Figure 7, Figure 8 and Figure 9 respectively.
Figure 1: Lung cancer data with Infogain filter Hybridized with three wrapper method.
[image:6.595.60.263.378.549.2]Figure 2: Skin cancer data with Infogain filter Hybridized with three wrapper method.
[image:6.595.58.265.455.749.2]Figure 3: Bone cancer data with Infogain Filter Hybridized with three wrapper method.
Figure 4: Lung cancer data with CFS Filter Hybridized with
three wrapper method.
[image:6.595.315.515.532.700.2] [image:6.595.61.260.594.757.2]International Journal of Innovative Technology and Exploring Engineering (IJITEE) ISSN: 2278-3075,Volume-8 Issue-11, September 2019
Figure 6: Bone cancer data with CFS Filter Hybridized with three wrapper method.
[image:7.595.327.544.54.233.2]Figure 7: Lung cancer data with Relief-F Filter Hybridized with three wrapper method.
[image:7.595.61.275.279.439.2]Figure 8: Skin cancer data with Relief-F Filter Hybridized with three wrapper method.
Figure 9: Bone cancer data with Relief-F filter Hybridized with three wrapper method.
IV.CONCLUSION
We have used three filters and three wrapper methods for gene selection and gene reduction. We have hybridized all filters with all wrappers and after combination we get nine hybrid methods. To classify the selected genes we have used SVM classifier. We have shown accuracy of all methods individually with three different data sets i.e. Lung cancer, Skin cancer and Bone cancer. To measure the accuracy of the newly invented hybrids methods we have used lung cancer, malignant melanoma, and bone cancer data set. For lung cancer and bone cancer data set relief-F + PSO gives best accuracy. But for malignant melanoma relief-F + FSBE gives best result.
REFERENCES
1. Babu, M., & Sarkar, K. (2016, September). A comparative study of gene selection methods for cancer classification using microarray data. In 2016 Second International Conference on Research in Computational Intelligence and Communication Networks (ICRCICN) (pp. 204-211). IEEE.
2. Yang, F., Cheng, W., Dou, R., & Zhou, N. (2011, March). An improved feature selection approach based on ReliefF and Mutual Information. In International Conference on Information Science and Technology (pp. 246-250). IEEE. .
3. Srivastava, B., Srivastava, R., & Jangid, M. (2014, December). Filter vs. wrapper approach for optimum gene selection of high dimensional gene expression dataset: an analysis with cancer datasets. In 2014 International Conference on High Performance Computing and Applications (ICHPCA) (pp. 1-6). IEEE. .
4. Liao, B., Jiang, Y., Liang, W., Zhu, W., Cai, L., & Cao, Z. (2014). Gene selection using locality sensitive laplacian score. IEEE/ACM Transactions on Computational Biology and Bioinformatics (TCBB), 11(6), 1146-1156. .
5. Dang, T. H., Pham, T. D., Tran, H. L., & Le Van, Q. (2016, October). Using dimension reduction with feature selection to enhance accuracy of tumor classification. In 2016 International Conference on Biomedical Engineering (BME-HUST) (pp. 14-17). IEEE. .
[image:7.595.62.271.493.654.2]under her supervisi on at Siksha ‘O’ 7. Gao, L., Ye, M., Lu, X., & Huang, D. (2017). Hybrid method based
on information gain and support vector machine for gene selection in cancer classification. Genomics, proteomics & bioinformatics, 15(6), 389-395. .
8. Pavithra, D., & Lakshmanan, B. (2017, June). Feature selection and classification in gene expression cancer data. In 2017 International Conference on Computational Intelligence in Data Science (ICCIDS) (pp. 1-6). IEEE. .
9. Singh, P., Shukla, A., & Vardhan, M. (2017, November). Hybrid approach for gene selection and classification using filter and genetic algorithm. In 2017 International Conference on Inventive Computing and Informatics (ICICI) (pp. 832-837). IEEE. .
10. Shahbeig, S., Rahideh, A., Helfroush, M. S., & Kazemi, K. (2018). Gene expression feature selection for prostate cancer diagnosis using a two-phase heuristic–deterministic search strategy. IET Systems Biology, 12(4), 162-169. .
11. Kononenko, I. (1994, April). Estimating attributes: analysis and extensions of RELIEF. In European conference on machine learning (pp. 171-182). Springer, Berlin, Heidelberg.
12. Kira, K., & Rendell, L. A. (1992, July). The feature selection problem: Traditional methods and a new algorithm. In Aaai(Vol. 2, pp. 129-134). .
13. Yang, F., Cheng, W., Dou, R., & Zhou, N. (2011, March). An improved feature selection approach based on ReliefF and Mutual Information. In International Conference on Information Science and Technology (pp. 246-250). IEEE.
14. Kennedy, R. (1995, November). J. and Eberhart, Particle swarm optimization. In Proceedings of IEEE International Conference on Neural Networks IV, pages (Vol. 1000, p. 33).
15. Eberhart, R., & Kennedy, J. (1995, October). A new optimizer using particle swarm theory. In MHS'95. Proceedings of the Sixth International Symposium on Micro Machine and Human Science (pp. 39-43). Ieee.
16. Tang, J. (2010). Principle and application of PSO algorithm. Computer Technology and Development, 20(2), 213-216. 17. Kennedy, J., & Eberhart, R. C. (1997, October). A discrete binary
version of the particle swarm algorithm. In 1997 IEEE International conference on systems, man, and cybernetics. Computational cybernetics and simulation (Vol. 5, pp. 4104-4108). IEEE.
18. Liu, M., Xu, L., Yi, J., & Huang, J. (2018, February). A feature gene selection method based on ReliefF and PSO. In 2018 10th International Conference on Measuring Technology and Mechatronics Automation (ICMTMA) (pp. 298-301). IEEE.
19. Lei, S. (2012, March). A feature selection method based on information gain and genetic algorithm. In 2012 International Conference on Computer Science and Electronics Engineering (Vol. 2, pp. 355-358). IEEE. D. E. Goldberg, “Genetic Algorithms in Search, Optimization, and Machine learning,” Addion wesley, p. p.102, 1989.
20. Ghamisi, P., & Benediktsson, J. A. (2014). Feature selection based on hybridization of genetic algorithm and particle swarm optimization. IEEE Geoscience and remote sensing letters, 12(2), 309-313.
21. Hall, M. A. (1999). Correlation-based feature selection for machine learning.
22. Wright, A. H. (1991). Genetic algorithms for real parameter optimization. In Foundations of genetic algorithms (Vol. 1, pp. 205-218). Elsevier.
AUTHORSPROFILE
Suchishree Panda received her B-Tech degree in Computer Science and Engineering from Gandhi Institute of Engg and Technology, Gunupur, India, in 2012; the M.Tech degree in Computer Science and Engineering from Siksha ‘O’ Anusandhan University, Bhubaneswar, Odisha, India, in 2019. Her research interests include data mining. She contributed 1 research review paper in National journal.
Dr. Kaberi Das is currently working as an Associate Professor in the Department of Computer science and Engineering at Institute of Technical Education and Research (ITER) under Siksha ‘O’ Anusandhan University, Bhubaneswar, Odisha. She has approximately 16 years of experience in teaching, research in various Engineering colleges of
Bhubaneswar and Cuttack. She received her MCA degree from Utkal University, Bhubaneswar, India, in 2002, the M.Tech degree in Computer Science and Engineering from KIIT Deemed to be University, Bhubaneswar, Odisha, India, in 2006 and the Ph.D. degree in Computer Science and Engineering from Siksha O Anusandhan Deemed to be University, Bhubaneswar, India, in 2016.She has more or less 27 publications in International and National Journals, Conferences of repute. She has supervised 20 M.Tech thesis and three Ph.D. scholars are continuing the degree Anusandhan University. Her areas of research includes Gene Expression Data Analysis specifically for cancer specific data, Gene Selection and Classification, data mining and machine learning.
Prof. (Dr.) Debahuti Mishra received her BE degree in Computer Science and Engineering from Utkal University, Bhubaneswar, India, in 1994; the M.Tech degree in Computer Science and Engineering from KIIT Deemed to be University, Bhubaneswar, Odisha, India, in 2006; and the Ph.D. degree in Computer Science and Engineering from Siksha O Anusandhan Deemed to be
University, Bhubaneswar, India, in 2011. She is currently working as Professor and Head of the Department of Computer Science and Engineering, Faculty of Engineering and Technology (ITER) Siksha ‘O’ Anusandhan Deemed to be University, Bhubaneswar, India. Her research interests include data mining, data acquisition, bioinformatics, software engineering, soft computing and machine learning. She contributed five books and more than 155 research papers in many National and International journals and conferences and also nine Ph.D. scholars are awarded with Ph.D. degree under her supervision.
Ashwini Kumar Pradhan received his BE degree in Computer Science and Engineering from (ITER) Siksha ‘O’ Anusandhan Deemed to be University, Bhubaneswar, India in 2012; the M.Tech degree in Computer Science and Engineering from CET ( College
of Engineering and Technology, Bhubaneswar,) in