This is a repository copy of
Active Contour Detection of Linear Patterns in Spectrogram
Images
.
White Rose Research Online URL for this paper:
http://eprints.whiterose.ac.uk/67978/
Version: Published Version
Proceedings Paper:
Lampert, Thomas and O'Keefe, Simon orcid.org/0000-0001-5957-2474 (2008) Active
Contour Detection of Linear Patterns in Spectrogram Images. In: 19TH INTERNATIONAL
CONFERENCE ON PATTERN RECOGNITION, VOLS 1-6. 19th International Conference
on Pattern Recognition (ICPR 2008), 08-11 Dec 2008 IEEE , Tampa , pp. 3350-3353.
https://doi.org/10.1109/ICPR.2008.4761214
[email protected] https://eprints.whiterose.ac.uk/ Reuse
Items deposited in White Rose Research Online are protected by copyright, with all rights reserved unless indicated otherwise. They may be downloaded and/or printed for private study, or other acts as permitted by national copyright laws. The publisher or other rights holders may allow further reproduction and re-use of the full text version. This is indicated by the licence information on the White Rose Research Online record for the item.
Takedown
If you consider content in White Rose Research Online to be in breach of UK law, please notify us by
Active Contour Detection of Linear Patterns in Spectrogram Images
Thomas A. Lampert
The University of York, UK
[email protected]
Simon E. M. O’Keefe
The University of York, UK
[email protected]
Abstract
This paper proposes an extension to the active con-tour algorithm for the detection of linear patterns within remote sensing and vibration data. The proposed technique uses an alternative energy force, overcom-ing the limitations of the original algorithm, which re-lies upon simple energy formulations to extract intensity and gradient information from an image. We overcome these by forming a noise model, which is used to detect a feature’s presence, and by integrating information from several locations within an image to strengthen the de-tection process.
1. Introduction
The active contour model proposed by Kass et al. [7] allows for non-parametric feature detection within an image. The active contour is constrained by internal en-ergy forces, which ensure that the active contour’s shape follows certain criteria; these are typically defined as curvature and connectivity. It is guided by an external energy force which attracts the active contour towards features by following local changes in energy gradient. As these gradients are calculated on a local basis the ac-tive contour needs to be initialised close to the desired feature to ensure a correct convergence. To overcome this Cohen [3] proposes a force which expands a closed active contour until it reaches the boundary from any initial position within it, called the balloon force. Al-ternatively points of the boundary may be selected prior to the contour’s evolution [4]. The active contour con-verges on a minimum of the weighted combination of its internal and external energy constraints which, subject to the internal constraints, translates to a local gradient maximum in the image. The active contour thus detects features which are distinguishable by gradient. This technique has proved valuable in the area of medical imaging, specifically; cortex [5] and calcaneus bound-ary detection [8] and brain segmentation [9].
The original algorithm has a single contour, is depen-dent on gradient features and is sensitive to the initial location. Here we present an active contour model for the detection of features in remote sensing and vibration data. For this application we derive a novel external en-ergy constraint which allows the model to detect very weak structures not defined by gradient and introduce an additional energy term which overcomes the initiali-sation problem.
This paper is laid out as follows: in Section 2 the original active contour algorithm is outlined and our novel contributions are defined. In Section 3 experi-mental results are presented and discussed. Finally, in Section 4, our conclusions are drawn.
2. Method
2.1. The Active Contour Algorithm
The original active contour model, as proposed by Kass et al. [7], is as follows. A set of snake points,
v(s) = (x(s), y(s)),s = 0,1, . . . , n−1, forms a
deformable contour wherex(s)andy(s)are the contour
point’s position in the image such thatx(s)∈[0, xmax]
andy(s)∈[0, ymax]. The contour has the energy
E(v) = 1
0
α
δv(s)
δs
2
+β
δ2v(s)
δs2
2
+P(v(s)))ds
(1)
where the termsαandβcontrol the continuity and
cur-vature of the contour (respectively) and the termP
cor-responds to the external energy derived from the image.
The external energy force,P, attracts the contours to
edges in the image. In the original algorithm these are taken to be the image intensity or gradient (2).
P(v(s)) =−|∇I(v(s))|2 (2)
2.2. Active Contour for Pattern Detection
For the detection of features in the proposed domain there are two issues limiting the active contour’s
(a) (b)
Figure 1. (a) A low SNR image. (b) Canny edge detection.
cation: its sensitivity to initialisation and the assump-tion that features are defined by gradient.
2.2.1. Initialisation. To overcome the initialisation problem, a similar force to Cohen’s balloon force is used. We define an external force which ‘walks’ the contour in a horizontal direction across the x-axis. The force is given by
W(v(s)) =−x(s)c (3)
where cis a constant which is balanced to overcome
noise introduced by the external energy while not forc-ing the contour to miss true detections. The contour will encounter vertical features during its walk.
2.2.2. External Energy Force. In this application, gradient and image intensity information are not suf-ficient to define features. As illustrated in Fig. 1, in very noisy images which contain weak features, using the Canny [2] filter produces spurious edge detections and fails to detect features. It can also be seen in a his-togram of intensity values for a 3dB SNR image, Fig. 2, that the noise and signal classes overlap consider-ably. We form an energy term which is based upon pixel
intensity values contained within a window W(x, y)
(and therefore incorporating spatial information). The window vector is then projected onto basis vectors de-rived through Principal Component Analysis (PCA) to remove noise and to reduce the dimensionality (avoid-ing the ‘curse of dimensionality’ [1]) of the data. We create a noise model by fitting a Gaussian distribution to examples of noise which is used to form a measure of windows’ content. This measure is formulated to take a maximum value when the window contains a pattern section and a minimum value otherwise.
The feature vectorxis defined as a linear
arrange-ment of pixel values from a windowW(x, y) centred
on pixel(x, y)of the imageI.nis the height andmthe
width of the window. A training setXofnmcolumns
is formed which includes an equal number of examples
0 0.5 1 1.5 2 2.5
x 1012
0 10 20 30 40 50 60 70
Intensity
Frequecy (pixels)
[image:3.612.90.305.65.136.2]Noise Signal
Figure 2. Histogram of pixel intensity val-ues for the signal and noise classes in a 3dB SNR image.
from windows containing a feature and those
contain-ing only noise. The principal component vectorsuk,
are found by maximising the quantityλkas follows
λk= 1
n
n
i=1
(uTk(xi−x¯))2
wherex¯is the mean vector ofX, subject to the
orthog-onality constraint
uT
lUk=δlk
A subset,U, is selected as the firstdprincipal
compo-nents and the training data projected onto them to form
ˆ X.
U = [u1, . . . ,ud] (4) ˆ
X=UTX
By storingU, window vectors derived as the active
con-tour evolves can be projected into the same PCA space.
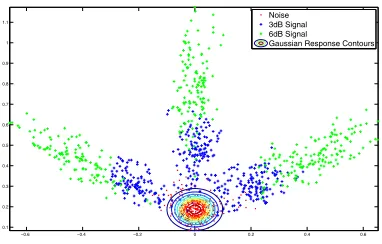
A plot of a data setXˆ containing noise and signal
ex-amples with a SNR of 3, 6 and 9dB projected onto the first 2 principal components can be seen in Fig. 3. It shows that this method results in clear separation of the noise and signal classes and a representation in which the noise can be easily modelled using a Gaussian distri-bution. Also, an increase in SNR translates to increased distance from the noise class. The three pronged fan structure that is observed results from windowing.
The parameters for a multivariate Gaussian
distribu-tion, µ and Σ, are selected to fit the noise examples
present inXˆ.
G(v(s)) = 1 (2π)d2|Σ|12
exp[−12(Q)
T
Σ−1(Q)]
(5)
Q=UTW(v(s))−µ
whereUT are the principal components derived in (4),
W(v(s))is the vector of pixel values from a window
centred on contour pointv(s)andµandΣare the mean
and standard deviation of the PCA projected noise
[image:3.612.323.534.66.131.2]−0.6 −0.4 −0.2 0 0.2 0.4 0.6 0.1
0.2 0.3 0.4 0.5 0.6 0.7 0.8 0.9 1 1.1
[image:4.612.351.510.64.162.2]Noise 3dB Signal 6dB Signal Gaussian Response Contours
Figure 3. Windowed feature vectors pro-jected onto 2 principal components (win-dow size: 21 x 3 pixels).
will be defined asXˆn⊂Xˆ, thereforeµandΣcan be
calculated using the maximum likelihood estimators [6]
µ= 1
n
n
i=1
ˆ
xni (6)
Σ= 1
n
n
i=1
(ˆxni −µ)(ˆx n
i −µ)T (7)
where∀xˆn ∈ Xˆn is a vector containing noise. The
contours of a 2D Gaussian distribution fitted to the noise class are shown in Fig. 3.
We use a single Gaussian distribution to model the noise and anything at the distribution’s extreme is clas-sified as signal. This is useful as the characteristics of the feature can vary greatly but the noise is consistent.
NowPin eq. (1) can be rewritten to use the
Gaus-sian’s response to a novel window as an external energy force.
p(v(s)) =
1 ifG(v(s))≥t
G(v(s)) ifG(v(s))< t
The purpose of the thresholdtis to smooth the
back-ground noise in the active contour’s search space; thus simplifying the detection problem.
Incorporatinga prioriinformation regarding a
pat-tern setPs(composed of relative positions of a pattern),
[image:4.612.102.293.65.187.2]can improve detection rates and form a pattern-based active contour search. As track patterns can be related through some underlying relationship, window sam-ples, and their Gaussian response, can be taken from locations relative to the contour point’s position in the
Figure 4. Ground truth image templates for a straight pattern section (top) and a sloped pattern section (bottom).
x-axis (for vertical lines) as defined in a pattern setPs.
P(v(s)) = W(v(s)) + γ
N+ 1(p(v(s))
+ N
n=1
p(f qnx(s), y(s))) (8)
Where W(v(s))is the walk force (3), p(v(s))is the
external energy calculated at the true contour position,
p(f qnx(s), y(s))is the external energy calculated at the
nth relative position∀f qn∈P sandNis the
cardinal-ity of the pattern setPs. Averaging over a pattern set
results in the flattening of noise spikes and the reduction of responses from all but the first feature in the pattern set; reducing the risk of multiple detections of a pattern. We are looking for vertical, curvilinear features, so the first and last points of the contour are fixed to the
top and bottom of the image such thatv(0) = [x(s), υ]
andv(n−1) = [x(s), ymax−υ]. Movement of contour
points will be restricted to the x-axis to ensure that an even search takes place in this direction. Using the pro-posed energy term and model the contour can now be thought of as a ’mesh’ which stretches across the im-age, similar to a flexible correlation template.
3. Experimental Results
The experiments outlined in this section use
images containing the same linear pattern set
(Ps = {2, 3, 4, 5}) with SNRs ranging from 0
to 10dB. Ground truth templates for the images are shown in Fig. 4.
3.1. Parameter Selection
image the external energy weight,γ, is set toγ = 1.
The internal energy parametersαandβare set toα=
0.1andβ= 0.2to allow the contour sufficient freedom
to model variations within the pattern.
A training set containing 1000 examples of noise and 1000 examples of 0dB mean SNR signal and noise was formed from 21 x 3 pixel windows. In this way the principal components represent the direction of maxi-mum variance for windows containing 0dB tracks and therefore SNRs greater than 0dB will be better sepa-rated from the noise. It was found through eigenvalue analysis that 2 principal components capture the
ma-jority of the data’s variance. The parameters tand c
are set tot = 0.00008and c = 0.41; values
deter-mined through experimentation. A model for determin-ing these parameters will be published in future work.
3.2. Results
The proposed algorithm correctly detects>92% of
straight line patterns in images containing a mean SNR of 1.5dB or above, see Fig. 5 (top). It can also be seen that below a mean SNR of 1.5dB the detection process gradually degrades until at a mean SNR of 0dB none of the pattern is detected. This clearly indicates that the class distributions, as used by the external energy term, become less distinguished at lower SNRs. Sloped
patterns are detected at a rate of >90% up until the
mean SNR is reduced to 3dB, at which point the per-formance reduces in a roughly linear fashion to 0% at 0.5dB. It can be expected that sloped patterns are not de-tected as reliably as straight patterns because, currently, the external energy is specifically trained using vertical, straight, patterns.
It can be observed that the presented algorithm pro-vides very good localisation results; at all SNRs, when a pattern is detected it is, on average, within 1 pixel of the true location, see Fig. 5 (bottom). It should also be mentioned that given that the noise is correctly mod-elled during the training process no false positives are detected.
4. Conclusion
We have presented an active contour framework, in-cluding a novel external energy term, with application to remote sensing and vibration data. The contributions
of our model are: its use ofa priori information
re-garding pattern structure to enhance detection, the novel external energy term and its ability to detect structure which can vary greatly. As the results indicate, combin-ing these contributions allows for structure detection at low SNRs.
0 1 2 3 4 5 6 7 8 9 10 0
0.1 0.2 0.3 0.4 0.5 0.6 0.7 0.8 0.9 1
Mean SNR (dB)
Proportion
Straight Pattern Sloped Pattern
0 1 2 3 4 5 6 7 8 9 10 0
0.1 0.2 0.3 0.4 0.5 0.6 0.7 0.8 0.9 1
Mean SNR (dB)
Mean Distance
[image:5.612.325.536.66.205.2]Straight Pattern Sloped Pattern
Figure 5. Proportion of patterns detected with less than 5 pixels difference at vary-ing levels of mean SNR (top). Mean dis-tance from the true location of the de-tected patterns (bottom).
Acknowledgements
This research has been supported by QinetiQ Ltd. with special thanks to Jim Nicholson for guiding the objectives and providing the synthetic data.
References
[1] C. M. Bishop.Neural Networks for Pattern Recognition. Oxford University Press Inc., 1995.
[2] J. F. Canny. A computational approach to edge detec-tion. IEEE Trans. on Pattern Anal. and Mach. Intell., 8(6):679–698, November 1986.
[3] L. D. Cohen. On active contour models and balloons.
Computer Vision, Graphics, and Image Processing. Im-age Understanding, 53(2):211–218, 1991.
[4] L. D. Cohen and R. Kimmel. Global minimum for ac-tive contour models: A minimal path approach.Int. J. of Computer Vision, 24(1):57–78, 1997.
[5] C. Davatzikos and J. Prince. An active contour model for mapping the cortex. IEEE Trans. on Medical Imaging, 14(1):65–80, 1995.
[6] R. O. Duda, P. E. Hart, and D. G. Stork.Pattern Classifi-cation. Wiley-Interscience Publication, 2000.
[7] M. Kass, A. Witkin, and D. Terzopoulos. Snakes: Active contour models. Int. J. of Computer Vision, 1(4):321– 331, 1988.
[8] F. Lefebvre, G. Berger, and P. Laugier. Automatic de-tection of the boundary of the calcaneus from ultrasound parametric images using an active contour model: Clini-cal assessment.Medical Imaging, 17(1):45–52, February 1998.