OF THE LABOUR MARKET
NEW FORMS AND NEW AREAS
OF EMPLOYMENT GROWTH
FINAL REPORT FOR THE NETHERLANDS
COMMISSION
OF THE EUROPE
COMMUNITIES
Luxembourg: Office for Official Publications of the European Communities, 1987 ISBN 92-825-7549-7
Catalogue number: CB-49-87-535-EN-C
© ECSC-EEC-EAEC, Brussels · Luxembourg, 1987
Reproduction is authorized, except for commercial purposes, provided the source is acknowledged.
Programme for Research and Actions on the Development of the Labour Market
NEU FORNS AND NEW AREAS OF ENPLOYNENT GROWTH
Final report for The Netherlands
By Tammo OEGEMA Chris Van der VEGT
SEO
Foundation for Economic
Research of the University of Amsterdam
Copyright ECSC-EEC-EAEC, Brussels - Luxembourg, 1987
2 RECENT DEVELOPMENTS IN WORK PATTERNS 3 2.1 Setting the general framework 3
2.2 The supply of labour 4
2.3 Jobs 6 2.4 Sectoral forecasts 9
2.5 Occupations 14
3 JOB CONTENT 19 3.1 Job content and education 19
3.2 Technological innovation and job content 25
3.3 Job improvement programs 32
4 INSTITUTIONAL ARRANGEMENTS 35 4.1 Collective bargaining 35 4.2 Reduction of working time 38
4.3 Part-time work 41 4.4 Flexible contracts 44 4.5 Informal and black work 50 4.6 Labour market segmentation 52
5 NEW AREAS OF EMPLOYMENT GROWTH 57 5.1 The employment matrix 57
5.2 Occupations 61 5.3 The service sector 64
6 CONCLUSIONS 73
7 ANNEX 77
8 REFERENCES 115
2/2 Growth of the labour force, 1973-1985 4 2/3 Labour force participation rates by age ?id sex, 5
Jan. 1st; percentages
2/4 Jobs of employees by economic activity, March 31st 7 2/5 Full-time and part-time jobs by economic activity, 8
March 31st, (average) percentage changes and the number of jobs in 1984
2/6 Employment in labour years 13 2/7 Changes in employed persons by major groups of occupations 15
2/8 Changes in the employment matrix, 1983-1985, working persons 16
2/9 Employment by occupation according to VOSTA, 1983-2000 18
3/1 Persons employed according to educational level 19 3/2 Distribution of employees by job content level 21
and educational level in 1977, percentages
3/3 Over- and underutilization of education, percentage of 22 employees
3/4 Consequences of an 1% increase of supply for employment 24 and unemployment per education level
3/5 Differences in unemployment rates caused by crowding out 25 3/6 Total employees, employees working in automatized firms 26
in the private sector, 1983, thousands of persons
3/7 Qualitative changes in the structure of employment in the 29 process industry due to technological developments
3/8 Opinion of working population aged 18 years and over about 33 their working conditions
3/9 Effects of job improvement programmes according to 34 employers, 1981
4/1 Number of labour-days lost by strikes, 1980-1985 36 4/2 Form of reduction of working time, percentage of firms 38
per sector with RWT
4/3 Influence of reduction of working time on employment, 39 November 1982 until March 1985
4/4 Working hours per year and per week, reduction of working 40 time other than hours per week, holidays, for full-time
workers, December 1984 and December 1985
4/5 Agreed hours of work, March 31st, 1977-1984 42 4/6 Part-time jobs as a percentage of total jobs, 43
March 31st, 1977-1984
4/7 Working persons according to temporary and permanent jobs, 45 1983-1985
4/11 A c t i v i t i e s of black work to occupational group 51 4/12 Largest groups of occupations for women, 1979-1983 54
4/13 Segregation indexes 1971-1983 55
5/1 Employment by function and sector, share of function in 58 total employment per sector i n 1985
5/2 Changes in the employment matrix, 1977-1985 59 5/3 Decomposition of changes in the employment matrix, 1977-1985 60
5/4 Occupational changes, 1979-1983 63 5/5 Indication of influences of forces differentiated to branche 67
5/6 Share of services as a percentage of nominal spending 68 by households
5/7 The development of a number of non o f f i c i a l kinds of labour, 69 1975-1981
5/8 Average propensity to save on a number of spendings 71
1981 and 1984
7/1 Occupational winners 1971-1979 79 7/2 Occupational winners 1979-1983 80 7/3 Macro economic Key figures, CPB 81 7/4 Working persons according to ISCO and highest attained level 82
of education 1979
7/5 i d . 1981 82 7/6 i d . 1983 83 7/7 i d . 1985 83 7/8 Working persons 1977-1985 to function 84
7/9 Working persons 1975-1985 to highest attained level of 84 education
FIGURE 2/1 Working persons according to sex (1983=100) 9 FIGURE 4/1 The Macro-economic Labour Income Ratio, Index for 41
EC-4* and the Netherlands
This report represents the results of the Dutch study carried out by SEO, Foundation for Economic Research of the University of Amsterdam. The study has been funded by the Commission of the European Communities (Directorate General V). The aim of the project is to take a close look at what is going on at the employment front: recent developments and future trends concerning new forms as well as new areas of employment growth.
The project was co-ordinated by Professor Robert Lindley of the Institute for Employment Research, University of Warwick. The report has been written by Tammo Oegema and Chris van der Vegt. We gratefully acknowledge the fellow participants: Rob Wilson (U.K.), Bruno Contini (Italy), Anne Houtman
While the overall employment performance is not impressive during the last years, some new jobs and co '••■"acts emerge nevertheless.
The first years of the present decade showed a decline in the number of jobs in the Netherlands. The turning point was 1985, and forecasts for the period 1986 to 1990 show an average increase of 2% per year.
There are various signs of growing labour market flexibility. Part-time work increased from 15% in 1977 to 26% in 1986 and will be about 32% in 1990. Temporary contracts are substituted for permanent contracts. Workers from employment agencies, min-max contracts, on call contracts and home work are all examples of more flexible labour market relations.
Female employment showed an almost uninterrupted growth. The participation rate of women increased from 37% in 1977 to 44% in 1986. The female share in part-time work is much larger than the male one.
Occupations of clerical and service workers and professional workers increase in number while manual labour, mainly found in manufacturing and construction decreases. Managers, salesmen and cleaners become more important in all economic sectors. The largest growth takes place and will probably take place in occupations of professional and specialist workers.
The educational level of the employed exceeds job requirements. Higher educated workers are crowding out lower educated workers, so unemployment
is highest among the lower educated.
The impact of technological change on the job content depends on the way the production process is organised. Integration of tasks and teamwork combined with a decrease of hierarchical levels will probably provide better results than staying within the traditional division of labour.
(Labour Force Survey)
CBS : Centraal Bureau voor de Statistiek
(Central Bureau of Statistics) The Hague
COB : Commissie Ontwikkelingsproblematiek van Bedrijven (Commission for Development problems of Firms), a subcommission of the SER
CPB : Centraal Plan Bureau
(Central Planning Bureau), The Hague
ESB : Economische Statistische Berichten (Economic Statistic Bulletin)
Weekly Bulletin from the NEI, Rotterdam
ITS : Instituut voor Toegepaste Sociologie
(Institute for Applied Sociology), Nijmegen
IVA : Instituut voor arbeidsvraagstukken
(Institute for Labour Problems), Tilburg
NEI : Nederlands Economisch Instituut (Dutch Economie Institute), Rotterdam
NPAO: Nationaal Programma Arbeidsmarkt Onderzoek (National Programm on Labourmarket Research)
OSA : Organisatie voor Strategisch Marktonderzoek
(Organization for Strategie Labourmarket Research
SCP : Sociaal Cultureel Planbureau
(Socio Cultural Planning Bureau), The Hague
SEM : Sociaal Economische Maandstatistiek, CBS
(Monthly Bulletin of Socio-Economi c Statistics)
SEO : Stichting voor Economisch Onderzoek der Universiteit van Amsterdam
(Foundation for Economie Research of the University of Amsterdam
SER : Sociaal Economische Raad (Social Economie Councel)
in forms and areas of employment growth. The general idea is that for several reasons the main characteristics of many jobs are no longer identified by classifying them in terms of sectors or occupations. All kinds of changes in technology, organization of labour and production, and preferences take place, affecting (and affected by) the industrial and occupational structure of employment. Ideally this report would contain a detailed description of all important aspects of each (potential) new job. This would ultimately lead to the main forces at work. However the report is a mixture of this ideal approach and the traditional approach to employ-ment growth. It puts together a wide range of material (statistics, results of empirical research, reports dealing with qualitative aspects of jobs) about general as well as specific developments. The conceptual framework is in line with the other country reports. Exceptions have been made for subjects which are thought of as typical Dutch or of specific interest. Chapter two deals with general background information, recent trends in work patterns and forecasts. Discussion of sectoral and occupational growth
takes place on several levels. After several years of a decreasing number of jobs, 1985 appeared to be the turning point. It is a remarkable sign of industrial revival that in that year even jobs in manufacturing did grow. Part-time jobs did increase relatively fast reaching about 25% of all jobs in the middle of 1986. This goes along with a growing female participation on the labour market. Compared with other countries supply of women lags behind but the speed of catching up is remarkable. Although employment of women grew almost uninterrupted, their jobs are still concentrated in the
traditional female occupations.
adaptiveness, for the whole firm as well as for the individual worker. The development of institutional arrangements is to be found in Chapter
four. The focal point in recent developments is the growing labour flexibility. Some kinds of flexible contracts call for legislation to preserve more security for the workers. Special attention has been paid to black work, which might be viewed as an extreme form of flexible labour relations. Although rather sophisticated efforts have been made to get some impression of the amount of black work, unquestioned statements are difficult to make. Minimum estimates amount to 12% of those aged 16 and over involved in black work; i.e. 100.000 labour years or about 2% of "official" labour volume. There are no obvious signs of increasing black work in the recent past. The last section deals with labour market
segmentation. Some emphasis has been laid on the segmentation according to sex. Although female labour participation increased, women in general do not succeed in penetrating traditional male occupations.
The last descriptive chapter, five, discusses the new areas of employment growth. After a brief survey of the changes in the employment matrix a closer look has been taken at the occupational winners of the recent past. These are medical workers, teachers, other scientists, administrative and managerial workers, salesmen and cleaners. The long-term process of replacement of blue collar by white collar workers is still going on. Nevertheless demand for particular blue collar occupations like machinery fitters and assemblers, electronical fitters and equipment operators will increase. The growth of white collar functions will shift somewhat from scientific and professional to clerical occupations. The last section tries to provide an anatomy of the service sector. The Dutch economy is already a "service economy". It is useful to make a distinction between producer oriented services and consumer oriented services. For both groups a preparatory study is available. Just like this report, these studies are halfway between conventional and non-conventional approaches. The "self service economy" hypothesis is not rejected in the report on consumer services. In the study on the producer oriented services the effects on employment at branch level are clarified.
2.1 Setting the general framework
The Dutch labour market is dominated by the large number of unemployed, about 760.000 or some 16% of the dependent labour force in 1985. This unfortunate situation compared to other EC or OECD countries is caused by the diverging development of supply and demand on the labour market. Unemployment has been low in the post-war decades. In the fifties and sixties strong economic growth created as many jobs as were needed to absorb the growing supply. In the seventies economic growth stagnated and employment remained stable. The growing supply was compensated by growing participation in education and by an increasing flow from the labour market into inactivity. While unemployment was higher than before, it did not fully reflect the structural problems on the labour market.
At the start of the present decade economic growth alsmost completely disappeared. Neither the growth of jobs nor a further extension 'of participation in education could absorb the still growing supply of labour, so unemployment increased explosively.
Table 2/1 Production, employment and unemployment rate
production* employment** unemployment***
-percentage change from previous year- -percentage
rate-1981 -0.7 -1.5 10.4 1982 -1.5 -2.5 14.0 1983 +1.3 -1.9 17.0 1984 +2.5 -0.4 17.4 1985 +1.5 +1.1 16.2
* GDP at constant market prices * * Total employment in labour-years
* * * Unemployed persons divided by the dependent labour-force xl00%; change of d e f i n i t i o n in 1983.
[image:17.595.77.530.495.704.2](unemployed over 57,5 years are no longer registered at the Labour Exchange from 1985 onwards), and partly also by discouragement of supply.
2.2 The supply of labour
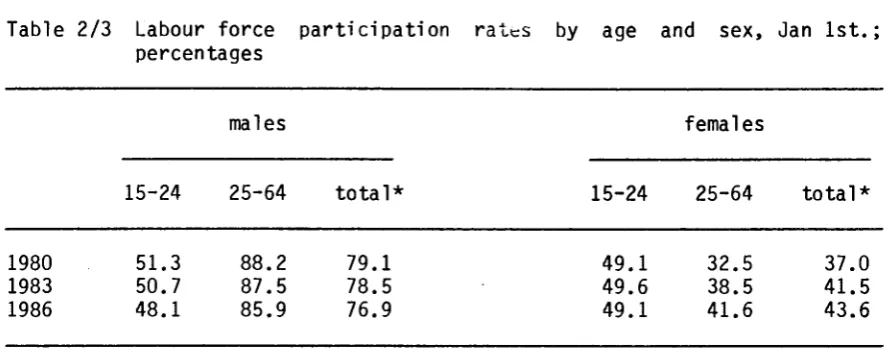
During the period 1973-1985 the Dutch labour force increased by more than one million persons. The growth has been strongest during the second half of this period. The net effects are shown in Table 2/2.
Table 2/2 Growth of the labour force, 1973-1985
changes level
1973-1979
80 285 365
20 130 150
1979-1985 1973-1985
persons χ 1000
210 290 455 740 665 1030
labour years χ 1000
170 190 235 365 405 550
1985
3925 2090 6015
3785 1485 5270 men
women all
men women all
Source: CPB, Central Economic Plan 1986, table III.3
Table 2/3 Labour force participation rates by age and sex, Jan 1st.; percentages
males females
15-24 25-64 total* 15-24 25-64 total*
1980 1983 1986
51.3 50.7 48.1
88.2 87.5 85.9
79.1 78.5 76.9
49.1 49.6 49.1
32.5 38.5 41.6
37.0 41.5 43.6
* total labour force divided by the population of working age (15-64), Source: computations SEO from various sources
Female participation on the labour market increased among women of age 25-64, especially among married women. The main trend behind this phenomenon is the changing attitude towards the role of women in society. Other factors are less children (and thus more time available to spend outside the home), an on average higher education level and an increased supply of part-time jobs by employers. There are also cyclical factors at work. On the one hand the supplementary effect: women try to get a job because real household income declined; this applies to the first years of the depression. On the other hand the discouragement effect: women are not trying to get a job due to high unemployment and unfavourable changes in tax legislation.
[image:19.595.73.517.165.340.2]the operation of demographic factors. In 1982 the growth of labour supply due to demographic factors was expected to disappear in the early nineties, but more recent estimates postpone this to 2000, and with the sudden rise in births of the last two years it will take even longer before supply stabilizes. However, the supply of married women will probably decrease, since having young children is the most important factor keeping them from the labour market.
2.3 Jobs
As a result of the poor growth performance of the Dutch economy, employment as measured in labour-years decreased during the years 1980-1985 (see Table 2/1). Because contractual working time in hours per year diminished by about 5% in this period, employment measured in working-hours declined even more. On the other hand we concluded in the last paragraph that the supply of part-time labour increased considerably. This implies that employment measured in persons working may show a more favourable development.
In this paragraph we consider jobs which come close to persons (employees) working, although one person may have two part-time jobs.
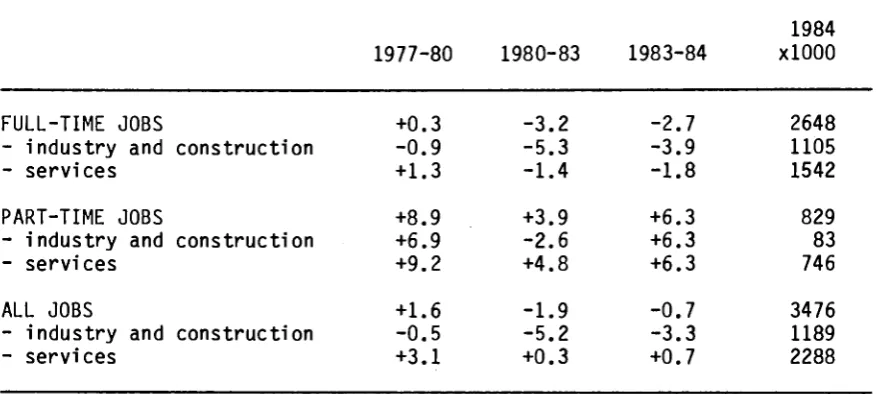
in industry and construction did increase in 1985 , the gap with the services-sector remained. This gap i s mainly due to d i f f e r e n t output growth and a d i f f e r e n t rate of growth of labour productivity. The larger share of part-time work in the services also has some e f f e c t .
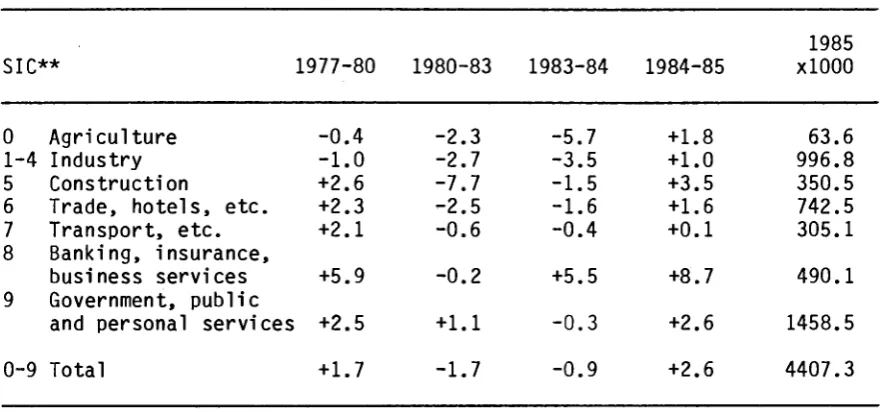
Table 2/4 Jobs of employees* by economic a c t i v i t y , March 31st
(Average) percentage changes and the number of jobs i n 1985
SIC**
0 Agriculture 1-4 Industry
5 Construction 6 Trade, hotels, etc. 7 Transport, etc. 8 Banking, insurance,
business services 9 Government, public
1977-80
-0.4 -1.0 +2.6 +2.3 +2.1
+5.9
1980-83
-2.3 -2.7 -7.7 -2.5 -0.6
-0.2
1983-84
-5.7 -3.5 -1.5 -1.6 -0.4
+5.5
1984-85
+1.8 +1.0 +3.5 +1.6 +0.1
+8.7
1985 xlOOO
63.6 996.8 350.5 742.5 305.1
490.1
u u v c i Milieu υ , μ υ υ ι l u
and personal services +2.5 +1.1 -0.3 +2.6 1458.5 0-9 Total +1.7 -1.7 -0.9 +2.6 4407.3
* Before 1983 without jobs of employees of less than 15 hours a week * * Standard Industrial C l a s s i f i c a t i o n , see Annex IV
Source: CBS, Statistiek Werkzame Personen (Computations SEO)
More pronounced than the difference between industry and services i s however the difference in growth of f u l l - t i m e and part-time labour, as one can see from the figures in Table 2/5. Part-time labour in industry and construction i s s t i l l unimportant (7% of a l l jobs) but not so in services
[image:21.595.70.513.275.481.2]Table 2/5 Full-time and part-time jobs* by economic a c t i v i t y , March 31st. (Average)percentage changes and the number of jobs in 1984
1984
1977-80 1980-83 1983-84 xlOOO
FULL-TIME JOBS - industry and - services PART-TIME JOBS - industry and - services ALL JOBS
- industry and - services
construction
construction
construction
+0.3 -0.9 +1.3
+8.9 +6.9 +9.2 +1.6 -0.5 +3.1
-3.2 -5.3 -1.4
+3.9 -2.6 +4.8 -1.9 -5.2 +0.3
-2.7 -3.9 -1.8 +6.3 +6.3 +6.3 -0.7 -3.3 +0.7
2648 1105 1542
829
83
746
3476 1189 2288
* Jobs of employees excl. agriculture, public sector, social security and education and excl. employees placed on social workshops.
Source: computations SEO from CBS, Statistiek Structuur Arbeidsplaatsen.
[image:22.595.90.529.193.390.2]'05
'00
95
90
85
80
--"""
' ___. "
1 1 1
/ / / /
I I I I
f'
I ι ■ I / _//
73 74 75 76 77 78 79 80 81 82 83 84 85
Source: CBS
2.4 Sectoral forecasts
The past few years are particularly interesting not only because employment growth recovered. More important are the changing attitudes towards labour, the role of the government and the recovery from the 'Dutch disease'. Important elements of this disease were: rapid rise in natural gas revenues, strong expansion of the public sector and pressure on profits as higher wages raised costs, while an appreciating currency eroded competitiveness and constrained the prices of goods; the economy was increasingly unresponsive to market forces. During the recession following the second oil crisis investment fell sharply, the share of manufacturing in GDP declined further and the government deficit widened fast.
[image:23.595.62.446.106.410.2]government chose to limit its role to improving conditions for the market sector. Another important point is the intention of non intervention in wage negotiations. This is in line with the much prophetized 'new industrial élan': the steady decline of the share of manufacturing in GDP had to be stopped. A new confidence emerged in the capabilities of the Dutch manufacturing to compete with other countries. By now the capacity utilization rate is back at its normal level and the perspective for the Dutch economy is better than before: inflation is negative, profits are increasing, competitiveness is satisfactory and the development in wages will be moderate, with the possible exception of jobs with a shortage of supply. Government deficit will decrease steadily, without much loss in aggregate demand. But all these facts hide what is really missing in the Dutch situation and that is strong investments accompanied by a belief in one's capabilities to start new undertakings. It is certainly true that in the 1970s the investment climate was bad and policy makers have neglected the impact of this on the long term: a loss in dynamics to adapt to changing circumstances.
In two sectors the prospects are highly uncertain, agriculture and energy. For agriculture this is caused partly by external factors like EC agricultural policy and partly by internal factors like the enormous use of fertilizer causing environmental problems. The highly uncertain character of the energy sector depends obviously on C, L.C policy.
In regard to employment prospects, the most important fact is that after almost two decades of decreasing employment in manufacturing there is a turning point: in some sectors, like the electrotechnical and chemical industry, employment will increase considerably according to the Central Planning Bureau.
The other big increase of employment is generated by the tertiairy services, especially trade, transport and communication and services like catering, repairs and business services. Although only the first form of employment growth can be called a relatively new area, there are also new elements in the second sector.
It seems no coincidence that employment growth in manufacturing will take place in those sectors with at least one big (multinational) company: the electrotechnical industry (Philips), the airplane industry (Fokker), oil and chemical products (Shell, Esso, Akzo and DSM).
In the chemical industry there is a general upgrading of the production mix in order to cope with the OPEC competition on the basic oil products segment. The market prospects for chemical end products benefit from the bio technical breakthrough, especially in the pharmaceutical industry. In the metal sector the electrotechnical industry is doing very well, as well as the instruments and optical industry. Also the expectations for the airplane industry are hopeful 1. Although the future of the basic metal industry is not very prosperous, because of tendencies towards protection and problems in the EC framework, the Dutch basic metal industry will benefit from any increase in demand: production units have been modernized and quality and flexibility improved substantially.
equipment has been installed incorporating the best available technology.
It can be concluded that within the manufacturing sectors the sectors
having good employment prospects are those either spending much on R & D,
followed by the conversion in new products and means of production (which is in the Dutch case almost the same as the presence of a multinational company), or having succesfully restructured the production lines, in order to get rid of obsolete or redundant production capacity, or both.
All tertiary services taken together account for almost 45% of employment in the private sector in the Netherlands. For nearly all subsectors belonging to the tertiary services employment is expected to rise. The largest contribution to employment growth in absolute terms comes from trade (+ 45.000 labour years) and 'other tertiary services' (Table 2/6), especially the business services (+ 43.000). Measured in persons this growth will even be stronger: in the trade sector the person-labour-years ratio will increase from 1.14 in 1980 to 1.25 in 1990, in the 'other tertiary services' it will increase from 1.20 to 1.38.
In the tertiary services the innovations based on micro-electronics will be most important: automation of desk work, stocks, electronic payment and logistic improvement in transport and storage. The integration of computer and telecommunication will continue and networks will be developed.
Predictions for the quality and quantity of work are hard to make. On the one hand there is a tendency towards a more tight organization in which the major discussions are taken by a small group of 'overall specialists' and the main work is getting relatively dull: putting information into a computer and getting other information from it limits social contacts and career prospects. On the other hand a tendency arises to use flexibility not only as a way to improve 'products' but as a slogan for the organization of labour too.
much larger. The Central Planning Bureau expects a somewhat lower rate of increase in the share of part-time labour than occurred in recent years. Nevertheless this share will be 32% in 1990 against 26% in 1986. Employment in persons will increase by about 300.000. The growth rate of employment is supposed to be 1 percentage-point higher if measured in persons instead of labour-years (manufacturing 0,5 percentage-point).
As 'registered' supply of labour will increase between 1986 and 1990 with circa 250.000 persons, unemployment will remain high.
Table 2/6 Employment in labour years
1982 1963/ 1973 1973/ 1983 1983 1984 1985 1986 1986/ 1990
1000
labour
years mutation per year in % 1. agriculture, forestry, fishing
food-processing industry 2. meat processing, dairy products 3. other products
4. beverage and tobacco-processing 5. t e x t i l e s , clothing, leather
6. wood, f u r n i t u r e , building materials
271 43 102 22 51 75
7. paper, paperware, p r i n t i n g , publishing 105
8. chemical, rubber and plastics 109
9. basic metal industry 34 10. metal products, optical goods 195
11. electrotechnical industry 104 12. manufacture, assembly transport equipm. 71
13. petroleum industry 11 2-13. industry 922 14. petroleum, gas production 8
15. public u t i l i t y 47 2-15. manufacuring (construction excl.) 977
16. construction, i n s t a l l a t i o n 358 17. exploitation real estate 12
18. trade 718
19. sea and air transport 36 20. other transport storage, communication 279
21. banking, insurance 176 22. other tertiary services 487 23. health and veterinary services 318 24. other quartary services 253 17-24. services
1-24. total firms
2279 3885 -3 1 -1,5 -1,5 -6 -1 0,5 1,5 3 0,5 1 0 1 -0,5 -14 1,5 -1 1 0 1,5 -5 1 4 2 0,5 -2,5 -2 -2.5 -9 -4 -1 -1 -1,5 -2.5 -2 -2,5 0 -2,5 -2 0,5 -2.5 -3,5 0 -0,5 -1 0,5 1.5 1 3 2 0,5 -0.5 0,5 -4,5 -3 -4,5 -8 -9,5 -3 -2 -3 -5,5 -5 -5,5 0 -4.5 12,5 0 -4,5 -8,5 0 ,5 .5 -1 -2.5 -0.5 0 -1 0 -4,5 -3 -1 0 -3 -2,5 -2 -4.5 0 -2 0 -2 -0.5 0 0 -3 0 -1 0,5 0.5 0,5 -0,5 -0.5 0 1,5 3 2 0,5 1 1 1 1 1 -0,5 0 1 0 0 0 2 2 0 1,5 4 -1,5 0 1.5 11 0 1.5 0 8.5 2 3 1,5 0 1,5 2 1 1,5 1,5 -0,5 -0,5 0,5 0 0,5 -1 0,5 1,5 0 1,5 1 2 0 1 2,5 0,5 -0,5 2 1.5 0,5 0,5 -0,5 2 1 1
[image:27.595.81.511.293.692.2]2.5 Occupations
Having dealt with the employment situation per economic sector, we shall now take a look at the development of occupations. We start with the so called major groups of the ISCO classification, loosely identified as:
- specialists (scientists, architects, medical workers, teachers, artists, accountants, journalists, artists, sportsmen, etc.);
- managers (government administators and managers mainly in manufacturing); - clerical workers (government executive officials, stenographers, typists,
bookkeepers, computing machine operators, transport conductors, mail distribution clerks, etc.);
- sales workers (managers in wholesale and retail trade, technical sales-men, manufacturers' agents, insurance, real estate and business services salesmen, shop assistants, etc.);
- service workers (waiters, barbers, cleaners, protective service workers etc.)
- agricultural workers (fishermen, ariculturai workers, forestry workers, farmers, etc);
- production workers (all kind of manual labour; blue collar workers)
In each production process there are functions like buying and selling, management and administration (overhead) and direct productive functions like farming, cleaning, plumbing, etc. At times the production process requires specialist knowledge, like scientific knowledge. Unfortunately however the classification according to the "major groups" is a mixture of a functional and a sectoral classification.
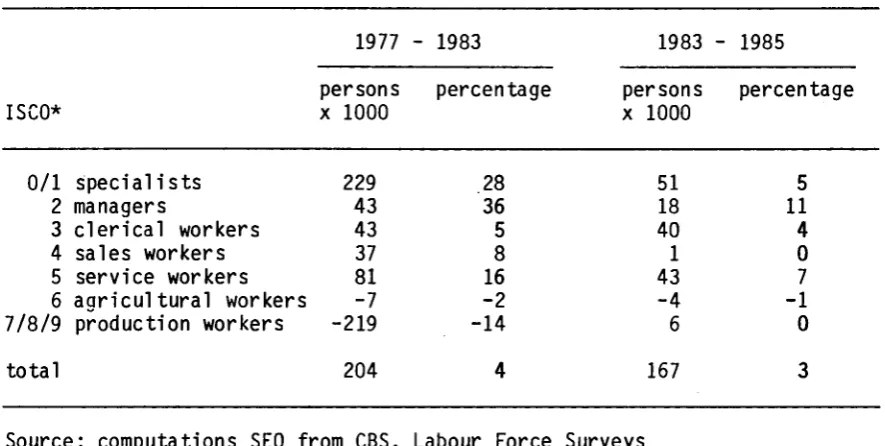
The increase in working persons is largest among specialists and service workers, followed by clerical workers and managers (Table 2/7). This order does not change in the last two years (1983-1985). The ordering by percentage change shows the largest relative gains for managers, specialists and service workers. During the most recent years specialists and service workers change place.
the gain in specialists during this period. From 1983 to 1985 the number of production workers remained more or less constant. Their relative position, however, did not improve. Their growth rate lags 1 à 2% per year behind the average.
Table 2/7 Changes in employed persons by major groups of occupations
ISCO*
0/1 specialists 2 managers
3 clerical workers 4 sales workers 5 service workers 6 aariculturai workers 7/8/9 production workers
total
1977
-persons χ 1000
229 43 43 37 81 -7
-219
204
- 1983
percentage
28 36
5
8
16 -2 -14
4
1983
-persons χ 1000
51 18 40
1
43 -4
6
167
■ 1985
percentage
5
11
4
0
7
-1
0
3
Source: computations SEO from CBS, Labour Force Surveys *: for the ISCO-code see Annex IV
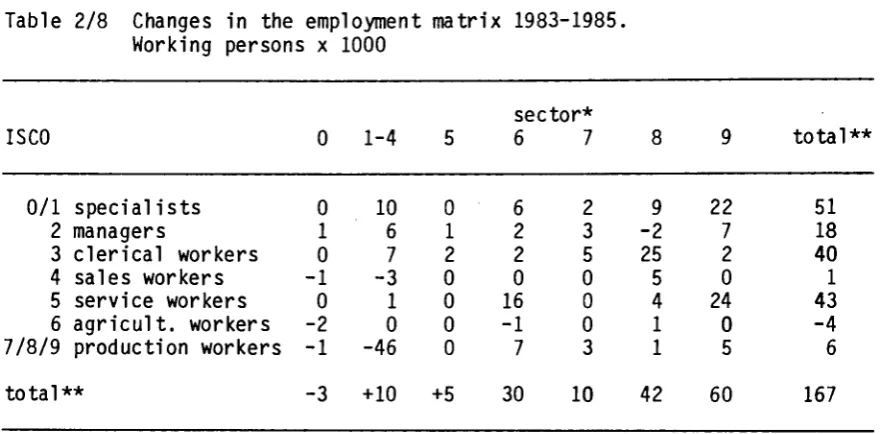
The employment matrix of occupations by sector (Table 5/1, Chapter 5) reveals whether these developments occur in each sector of economic activity or only in sectors with a concentration of particular occupations. In the employment matrix of Table 2/8 the change in employment by major group of occupations and economic activity during 1983-1985 is given.
[image:29.595.71.514.213.436.2]employment in the service sector is growing. The most important "occupational e f f e c t s " , i . e . growth due to increasing occupational shares within sectors, are located in manufacturing (sectors 1-4) for specialists and in most sectors for managers. The increase of specialists in manufacturing during 1983-1985 i s remarkable.
Table 2/8 Changes in the employment matrix 1983-1985. Working persons χ 1000
ISCO
0/1 specialists 2 managers
3 clerical workers 4 sales workers 5 service workers 6 agricult. workers 7/8/9 production workers total**
0
0
1
0
-1
0
-2
-1
-3
1-4
10
6
7
-3
1
0
-46
+10
5
0
1
2
0
0
0
0
+5
sec
6
6
2
2
0
16
-1
7
30
tor*7
2
3
5
0
0
0
3
10
8
9
-2
25
5
4
1
1
42
9
22
7
2
0
24
0
5
60
total**51
18
40
1
43
-4
6
167
Source: CBS, Labour Force Surveys * : see Table 2/4
* * : included occupation or sector of a c t i v i t y unknown
Forecasts of employment by occupation should rely on industrial and occupational e f f e c t s . In the most simple macro-economic model labour productivity growth is substracted from production growth. From this the employment growth follows. Next this growth i s proportional distributed over the several economic sectors, and using a sector by occupation matrix,
the sectoral growth is translated in occupational growth. This approach neglects both the industrial and the occupational e f f e c t , and is rather old fashioned.
The common current approach is at least to allow for differences in sectoral growth, as forecast by sector specialists or a sectoral model. Again, using a sector by occupation matrix, predictions can be made.
[image:30.595.83.524.207.424.2]consistent time series for the share of occupations in each sector, second these shares change r e l a t i v e l y fast and t h i r d , the c l a s s i f i c a t i o n may not be appropriate to the most important developments. In our case, the sector
'other services' of SECMON is not suitable for studying developments in the services sector, while growth of blue collar workers takes place in a residual group, as we shall see in Chapter 5.
In the Netherlands two approaches to estimate the occupational e f f e c t have been used. The ANTOS report (see s t a t i s t i c a l annex) f i t s a trend per cell of the sector-occupation matrix. Unfortunately only four observations for each cell are available, so the results are not very r e l i a b l e . Besides, the study is based on census data and labour force surveys up to 1979, so i t is by now out of date.
Using a c l a s s i f i c a t i o n by 30 occupations, r e l a t i v e l y large increases in employment w i l l probably occur for "other s c i e n t i s t s " ( 5 ) , bookkeepers, cashiers and related workers (8) and other c l e r i c a l and related workers (9). The estimated increase of some blue collar jobs is also substantial: machinery f i t t e r s , machine assemblers and precision-instrument makers (23), e l e c t r i c a l f i t t e r s and related electronics workers (24) and material handling and related equipment operators (28).
Table 2/9 Employment by occupation according to VOSTA, χ 1000 persons 1979 and 1983-2000
Occupation labour volume
1979* 1983 1988 2000 mutation
% changes per year '83/2000 79/83 83/88 88/2000
1 Physical scientists, architects, engineers and related technicians
2 Medical, dental, veterinary and rel. workers
3 Teachers
4 Sculpters, painters, photographers and related creative a r t i s t s , composers and performing a r t i s t s
5 Other scientists
6 Administarive and managerial workers 7 Stenographers, typists and card- and punching
machine operators
8 Bookkepers, cashiers and related workers 9 Other clerical and related workers 10 Technical salesmen, commercial travellers
and manufacturers' agents
11 Salesmen, shop assistants and related workers 12 Other sales workers
13 Cooks, waiters, bartenders and related workers 14 Maids and related housekeeping service workers
not elsewhere classified
15 Building caretakers, charworkers, cleaners 16 Hairdressers, barbers, beauticians and rel.workers 17 Other service workers
18 Agricultural, forestry workers, fishermen etc. 19 Production supervisors and general foremen 20 Food and beverage processers
21 Tailors, dressmakers, sewers, upholsters and related workers
22 Blacksmiths, toolmakers and machine tool operators 23 Machinery fitters, machine assemblers and
precision instrument makers (except electrical) 24 Electrical fitters and related electrical and
electronics workers
25 Plumbers, welders, sheet metal and structural metal preparers and erectors
26 Painters
27 Bricklayers, carpenters and other
28 Material handling and related equipment ooerators, dockers and freight handlers
29 Transport equipment operators
30 Other production and related workers, transport equipment operators and labourers
1 - 3 0 total
178,9 168,3 165,3 157.1 194.5 230,5 240,3 283,5 239,7 262,1 269,9 329,1
43,1 44,7 54,5 91,2 246.1 276,5 307,6 408,2 119,0 126,6 133,6 147,3
138,7 130,0 131,6 138,6 277.2 272,1 300,4 391,2 495.6 513,0 540,0 607,1
49,7 45,5 43,6 34,8 225,0 214,0 223,7 231,2 229.3 217,7 237,9 279,7 95,6 100,8 102,9 112,9
171,6 99,8 29.1 131.9 293,6 97,2 67,4 149,7 97,8 25,7 106,8 263,8 61,9 57,7 151,8 106,8 24,7 102,3 257,3 50,9 58,4 167,2 139,8 23,9 98,5 232,3 29,7 52,1
38,1 29,1 24,9 13,0 52,7 43,1 43,2 38,4
173.1 175,4 192,6 231,1
107,8 116,8 134,7 172,5
138,0 115,3 115,0 116,6 51.5 41,6 40,6 42,1 235,6 181,9 177,4 186.6
162.6 169,5 188,8 221,0
165.2 147,0 139,5 109,0
281.7 225,8 200,4 138,4
4829 4611 4761 5224
Source: 1979: ANTOS
1983-2000 : VOSTA, SEO, not yet published
only persons considering the occupation as their main a c t i v i t y , occupation unknown l e f t out
* : 1979 i s not f u l l y comparable with the other years, due to s l i g h t l y different questions asked.
[image:32.595.52.543.161.587.2]3 JOB CONTENT
3.1 Job content and education
A job has many characteristics. Generally the content is determined by the tasks that are to be carried out under normal conditions. This can be easy work, requiring no specific skills or knowledge, or highly complicated work for which much theoretical knowledge is needed. Other common dimensions of a job are the responsibilities involved. Usually, the wages paid reflect to some extent these factors as well as others like social status and the situation on the labour market. The last two factors are subject to cultural and economic change.
The level of education of people having jobs might tell us something about the required skill or theoretical knowledge. This level has increased
Table 3/1 Persons employed according to educational level. Share in total employment* (percentages) and absolute change in thousands of persons ISCED** 1st level 2nd level, 2nd level, 2nd level, 2nd level, 3rd level, 3rd level,
1st stage, general 1st stage, vocational 2nd stage, general 2nd stage, vocational 1st stage
2nd stage other (student, unknown)
total, percentage total, persons xlOOO
1979 22
7
243
28 104
3
100 4893 1981 198
204
31 114
3
100 5016 1983 168
204
34 124
3
100 4919 1985 147
204
34 135
3
100 5056 1979-1985 xlOOO -364 + 4 -119 + 55 +338 +175 + 68 + 6 +163Source: computations SEO from CBS, Labour Force Surveys
* employers and employees, excl. military personnel
during a long period of time and s t i l l does so. According to table 3/1 there is a rapid s h i f t in the demand for labour from unskilled to highly skilled persons. The share in employment of people with only primary education (1st level) f e l l from 22% in 1979 to 14% in 1985. The share of employed persons with senior vocational (2nd l e v e l , 2nd stage), vocational college and university training (3rd l e v e l , I s t a n d 2nd stage), taken together, increased from 42 to 52%.
I f we look at the supply of labour the changes are however less pronounced. Many of the unskilled and low s k i l l e d became unemployed. The share of these categories in total unemployment remained constant from 1979 to 1985, but at a high l e v e l : 772 (1st level 40% and 2nd l e v e l , 1st stage 37% according
to CPB, 1986). The number of unemployed increased from about 280.000 to 760.000 (partly due to a change of d e f i n i t i o n ) . The decrease in persons employed according to table 3/1 corresponds partly with an increase in
unemployed persons. In other words i t i s doubtful i f the job content changed that much towards more s k i l l and theoretical knowledge as might appear from the figures in table 3 / 1 . Possibly also the same job is done by
the better educated person because of the existing excess supply of labour (see below).
Conen e t . a l . (1983) have made a thorough study of the relation between changes in job content and level of education. For about 1800 occupations the job content has been measured as a weighted sum of qualifications required (subdivided in general and vocational), r e s p o n s i b i l i t i e s involved and shop-floor consultation required. The quality content of a job is indicated on a scale from one (lowest quality) to seven. Two subperiods are distinguished, 1960-1971 and 1971-1977, to account for data problems: comparability i s hampered by a major overhaul of the Dutch educational system at the secondary l e v e l .
period 1971-1977 exhibits a moderate continuation of this polarization tendency.
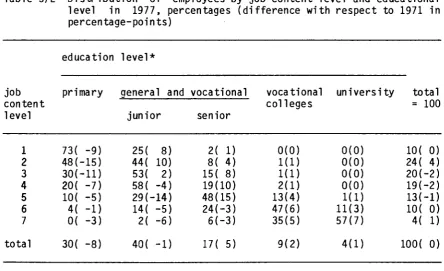
While the period 1971-1977 might seem somewhat dated i t is s t i l l worthwile to go into more detail as done in table 3/2. The change in educational level i s more or less comparable with the one in the period 1979-1985.
The d i s t r i b u t i o n of employees by job content level and level of education shows a strong correlation between both variables. Jobs with a low quality content are mainly occupied by persons with primary or junior general or vocational education, and jobs with a high quality content mainly by people from vocational colleges and u n i v e r s i t i e s .
Table 3/2 D i s t r i b u t i o n of employees by job content level and educational level in 1977, percentages (difference with respect to 1971 in percentage-points)
job
content level1
2
3
4
5
6
7
total education primary 73( -9) 48(-15) 30(-ll) 20( -7) 10( -5) 4( -1) 0( -3) 30( -8) level* aeneral and junior 25( 8) 44( 10) 53( 2) 58( -4) 29(-14) 14( -5) 2( -6) 40( -1) vocational senior 2( 1) 8( 4) 15( 8) 19(10) 48(15) 24(-3) 6(-3) 17( 5) vocational colleges 0(0) 1(1) 1(1) 2(1) 13(4) 47(6) 35(5) 9(2) university 0(0) 0(0) 0(0) 0(0) 1(1) 11(3) 57(7) 4(1) total = 100 10( 0) 24( 4) 20(-2) 19(-2) 13Í-1) 10( 0) 4( 1) 100( 0)Source: Conen e t . a l . (1983), p. 420
* Not wholly comparable with the c l a s s i f i c a t i o n in table 3/1
[image:35.595.60.505.359.630.2]variables. The overall job content level does not increase. I t follows that the qualitative structure of employment between 1971 and 1977 did not keep up with the rise in educational l e v e l . Within the structure of job content levels crowding out takes place: at each functional level the share of lower educated workers decreases and the share of higher educated workers increases. At every functional level the share of people with the lowest education level diminishes. In 1977 the share of those people i n unemployment i s already r e l a t i v e l y large, so i t seems that crowding out does not only occur within job content levels but also in total employment.
This crowding out phenomenon can have several causes. One p o s s i b i l i t y is that at each functional level the content of the job became more complicated. A second explanation l i e s in the supply of labour: the r e l a t i v e abundance of high qualified employees. Employers are able to obtain better labour than is s t r i c t l y nesessary. According to table 3/3 the l a t t e r explanation seems plausible. During the period 1971-1977, with unemployment increasing, the percentage of people "working below their educational l e v e l " also increased. At the same time the percentage of people "working above their educational l e v e l " was reduced. The frequency of proper «matching between educational level and job content remained v i r t u a l l y unchanged.
Table 3/3 Over- and underutilization of education, percentage of employees*
level of job content I960** 1971** 1971*** 1977***
below level of education matching level of education above level of education
* proper match between levels based on the instruction of the ARBI-code, e x p l i c i t l y refering to types of schooling
* * labour force by education and job level based on Conen & Huygen (1980),
see bibliography
* * * extrapolation of SEO based on Conen, Huijgen and Riesewijk (1983)
7.0
57.5
35.6
13.6
59.3
27.1
15.4
55.2
29.5
With unemployment rising from 2% in 1971 to more than 6% in 1977, the situation on the labourmarket seems to be reversed: from a shortage to some excess supply of higher educational levels.
Unfortunately the exercise of table 3/3 is not available for a more recent period. However SEO developed a model of flows and stocks on the labour market (VOSTA) which was used to explain regional differences in crowding out by regional differences in unemployment rates with data of the labour
force surveys of 1979 and 1981.
The conclusion is that crowding out depends indeed on the relative abundance of employees with high education levels. Moreover, other possible effects do not show up: differences in unemployment rates between education levels can almost completely be explained by crowding out.
Scheme of the crowding out process
Total Employment
Uleuel J
^J—
E leu. 3 Employment leuel ι - 2
31
Uleuel 2E leu. 2
•W Employment leu. I
E : Employment U : Unemployment
The model has been estimated only for the educational levels one to four because the highest educated have a large interregional mobility. Table 3/4 gives the hypothetical consequences of an increase of labour supply of one percent in each level of education for the employment situation at each level of education.
Table 3/4 Consequences of an 1% increase of supply for employment and unemployment per educational l e v e l *
1% increase of supply in level of education
1 2 3 4
1 t/m 4
employment ( 4 0,00 0,00 0,00 0,92 0,92 3 0,00 0,00 0,62 -0,06 0,56
in % po
2 0,00 0,28 -0,36 -0,07 -0,14 ints) 1 0,00 -0,43 -0,65 -0,21 -1,31
unemployment ( i n %
4 0,00 0,00 0,00 0,08 0,08 3 0,00 0,00 0,38 0,06 0,44 2 0,00 0,72 0,36 0,07 1,14 points) 1 1,00 0,43 0,65 0,21 2,31
Source: Teulings and Koopmanschap (1986)
* For the educational levels see Table 3/2 (excl. university)
Crowding out i s a one-sided process. Increased supply at the lowest educational level results in a growth of unemployment with the same number. An increase of supply on medium level does not have any consequences for the highest educational l e v e l . Part of the additional supply causes an increase of employment at that level at the cost of employment of the lowest l e v e l . The extra supply is partly unloaded on lower l e v e l s , and the highest education levels have the largest p o s s i b i l i t i e s to do so.
The l a s t row in the tabel affirms t h i s : i f the supply increases with 1% a t a]J_ educational levels, unemployment of the highest level hardly increases, but the lowest level has to take an increase of unemployment of 2.3%.
[image:38.595.90.532.174.419.2]Table 3/5 Differences in unemployment rates caused by crowding out
educational unemployment rate unemployment rate with 3% level 1981 lower supply on every level
1 9.0 2.1 2 6.5 3.0 3 3.5 1.1 4 2.8 2.4 1 to 4 5.5 2.5
Source: Teulings and Koopmanschap (1986)
This table clearly indicates that unemployment of people with low educational levels is not caused by a shortage of low-skilled jobs but by crowding out.
3.2 Technological innovation and job content
Almost all technological innovations of the last few years have in common the use of computers. The way computers are used differ a lot. Nowadays we can put almost every character of the alphabet after the characters CA
(Computer Aided), like M (Manufacturing), D (Design), S (Storage) and Ρ (Planning), among other. Table 3/6 provides some information on the automation in the Netherlands. It is expected that these figures will show a steady increase in the near future, the last column somewhat more than
the others. Micro- and mi ni-computers can nowadays handle information as well as a large computer of, say, five years ago. Complete networks of such
small computers and/or terminals will become more important and more persons will be involved in the automation process. The big computer will be left for the real 'number cracking'.
[image:39.595.64.515.145.271.2]third part will undergo some influence and on the remaining part there will be no influence at all.
Table 3/6 Total employees, employees working in automi zed firms* in the private sector, 1983, thousands of persons
of which of which direct
working in automation others sector employed automatized firms personnel involved**
persons persons % of 1 pers. % of 2 pers. % of 2
Mining,
Manufacturing 995 Construction 381 Trade, hotels, etc. 885
Business services 739 Other firms*** 3007
Total*** 5007
674 98 466 608 388
2235
68 26 53 82 13 45
14,5
2,3
13,8 31,6
4,1
66,3
2
2
3
5
1
3
30,1
2,8
22,9 67,0 18,5 137,3
4
3
5
10
5
6
Sources: first column : CBS, Labour Force Survey 1983 other columns: CBS, Automation Statistics
* Firms having a computer of at least f 10.000,-- and/or having auto-mation personnel
** Sometimes using the computer
*** First and other columns not fully comparable
The installation of a computer, or computer network is only the beginning, in many cases the start of a lot of trouble. Learning how to deal with the computer is one thing, but the computer is to be told what should be done and that is far more difficult. Not only the specific tasks have to be brought into the computer, but the structure of information and organization too. By then it might become clear that the traditional division of labour is not suited for dealing with the new possibilities. This in turn might call for another conception of human labour.
the traditional division of labour, human labour is often viewed as a limiting factor which has either to be eliminated or controlled. This means that the ultimate goal is a maximum of automation connected with strict division of labour. The consequences for the job content are:
1. Diminishing variety of tasks. By automatizing as many tasks as possible the work of the operator is reduced to guarding the process. 'Passive' labour time increases, interventions are scarce. The remaining tasks are strictly distributed over different persons;
2. Decreasing autonomy: the operator guards the process that has been put into the computer by others. No independent authority in case of minor disturbances;
3. No cooperation in extreme cases: the lonely operator in the control room.
These consequences downgrade the job. Although heavy work disappears other forms of 'heavy' labour emerge:
a. Underutilization as a new form of monotonous work: waiting and waiting for incidents without knowledge of the consequences for the production process;
b. Overutilization during incidents. An extreme example is the accident in the nuclear power plant of Three Mile Island. Confronted with two hundred alarm signals, and a series of situations for which they were not trained, the operators, unintentionally, worsened the situation. The avoidance of costly disturbances still requires highly trained personnel, but since they use their skills less often, a loss of capacities seems to be inevitable.
Another example is the printing/publishing industry. In the recent past many initiatives have been taken to adapt the qualifications of employees to new technologies in this sector. In fact, this sector was the first one with a technology agreement (1975). Nevertheless there was no important breakthrough in the division of labour.
The main form of automation in this sector is the application of screens in the text preparation. The importance of the texthandling process and the link of a lot of terminals with a central computer, also by telephone, shifts the input process to the copywriters. Automation in the printing/publishing sector means a sharp division between high and low skilled jobs: polarization. For both groups pressure increases. For the lower skilled there is a lack of autonomy and of control on the amount of work done.
The alternative view on automation emphasizes the quality of work.
Attempts are being made not to maximize but to optimize the use of computers, linked with a concept of labour characterized by integration, variation, teamwork and room for manoeuvre. Operating, laboratory and reparation functions are combined, rotation takes place over the different parts of the production process, and the number of hierarchical levels decreases. The gains in terms of productivity and flexibility improvement are partly used for reduction of personnel but it is equally important to use it for training, re-schooling and consultation. Ideally, this view on the meaning of labour should be incorporated when planning the production process, simultaneous with the design of control rooms, screens, software, instruments, layout and communication. The work is being carried out in working groups, sharing responsibility for a certain part of the production process. The tasks are differentiated to content, skills and knowledge requirements. Cooperation is not only possible but a technical necessity.
('Taylor-like') model, others are on their way to integrate tasks and conduct experiments with teamwork production. In order to have enough qualified personnel some firms extend internal courses, others hire new personnel. There seems to be a lot more freedom than was often thought. In respect of the structure of qualification opposite tendencies appear. On the one hand new equipment requires higher qualifications of operators and, even more important, the character of knowledge changes. Knowledge of specific products becomes less important and technical knowledge becomes more important. In the past the introduction of mechanical production caused quite similar developments. Knowledge of the structure of production
Table 3/7 Qualitative changes* in the structure of employment in the process industry due to technological developments
timber furni- concrete synthtic paint pharma- ferti-ture materials ceutic lizer SIC (25.3) (25.7) (32.5) (31.7) (29.5) (26.9) (29.1) Main activity
a) direct production
-transformation +/--other activities 0
b) preparation
+/-c) support +
Total
(dominant change) +
+/-0
+/-+
+
+
+
+
+
+/- 0/-+
+
+
+/-0
0
+/-+/0
+/-0
0
+/-+/0
+
0
0
+/-+
Source: SEO/STB:Technologie en Werkgelegenheid op sectorniveau, Ministerie van Economische Zaken, Den Haag, 1986
(Technology and employment on branche level, Ministry of Economic Affairs, The Hague 1986)
*: changes in qualifications required from employees in case of application of the best practic technology instead of average or normal practice
[image:43.595.67.510.316.606.2]and information requires a higher level of abstraction. Firm specific knowledge becomes more important.
On the other hand the application of new machines causes an under utilization of capacities of employees, sometimes followed by high absenteeism and/or high turnover of personnel, again largely depending on the way the production process is being (re-)structured. The under-utilization of employees has, at least in some branches, still another reason: for several functions employers expect to need higher qualified workers. They are hired in advance while the actual jobcontent does not change.
The application of the new organization model has been successful in the insurance sector. Automation of the administrative process is of moderate recent date. The storage of administrative data has been automatized for a longer time; the real administrative work, the transformation of relative unstructured information into structured information, was until recently done by hand, even in big insurance companies. For this work specialists were needed educated by special institutes.
Later on terminals were used by relatively low educated employees in order to add and change information in various data sources. Also most parts of the processing of the information was done by the computer without substantial intervention by specialists.
As a consequence of the administrative automation and the changing organization of the labour process there are nowadays hardly any specialist functions left. Instead there are new, integrated functions (all-round functions) which combine parts of the older specialist functions with newly developed tasks. The content of these new functions varies from firm to firm and depends now more than before on the specific way the labour process is organized.
changing work patterns. The branch-specific education institute reacts to changing circumstances by providing education-packages and 'in company service'.
Automation did not systematically make disappear low, unskilled labour. It did create new functions which also have a routine character (punching, many operating functions). In addition, technological innovation simplified certain skilled work, for instance in the printing/publishing industry and certain types of desk work. Perhaps it is however more important to stress some methodological and theoretical conclusions that are by now widely accepted. One conclusion is that the implications of technological change for the content of jobs depend on the organization principles in use. In principle the same technological renewal can cause more simplified as well as more sophisticated functions. Simplification in most cases is due to the widely used traditional organizational principles: horizontal and vertical division of labour, standardization of tasks etcetera.
Another conclusion is that the conversion of functional requirements into demand for persons with certain skills depends on personnel policy, which in turn is influenced by the situation on the labour market. Higher educational requirements may be caused by the situation on the labour market, so it is not a proper indication for changes in job content.
There are indications for a growing flexibility of the already mentioned organizational principles: integration of tasks and broadening of qualification requirements with corresponding emphasis on mul ti-applicability of certain skills is growing. There is also a growing importance of other factors than pure skill qualification, like independency, flexibility and social skills.
Taken all this in account it is hard to forecast the developments in qualification requirements. However, it can be expected that if the possibilities of organizational and personel policy get better understood and used, then the diversity of comparable functions in different firms will increase, and specific qualification elements of firms will gain weight. The process of taking together old, new and changing tasks will
3.3 Job improvement programs
Autumn 1985 it was ten years ago that a government programme 'job improvement' was launched. In the seventies there was a growing international consensus about the importance of stimulating research in order to improve the quality of jobs. Several arguments were mentioned. The steady growth of technological progress caused new problems in the area of labour organization and physical labour conditions. The steady growth of the costs of the social security system was an argument to take preventive measures. There was also a growing understanding of the 'double character of labour protection': improvement of the labour conditions does not only protect the employee, it induces a higher labour productivity too.
In many European countries some kind of job improvement program was launched, for example the West-German 'Forschungsprogramm zur Humanisierung des Arbeits lebens', the French fund to improve labour conditions (FACT) and Danish, Norwegian and Swedish efforts in this area. The Dutch version was introduced in 1975 and was called 'Arbeidsplaatsverbetering' (APV).
Although by then the program was ment to be just temporary, fitting in the Keynesian concept of stimulating demand by extra government investments, every year new programs were initiated and older programs modified and extended. The kind of modification of the programs depended partly on the political party in power and partly on the situation on the labour market. In the early years of the program the above mentioned argument was most important but with the start of the eighties, APV was subject to budget-constraints and emphasis was laid on coping with new technologies.
In total 20 different programs have been developed since 1975 with about 15.000 projects and a total amount of investments of 1,250 billion guilders. The contribution of the government was 280 milion guilders. In the past ten years about 165.000 employees have been subject to job improvement programs.
investments coped with immaterial circumstances such as monotonous work, shop-floor consultation and supervision.
It is worth mentioning that many small firms benefited from the programs. This is quite contrary to experiences with other Dutch government programs, and to the experiences with the West German job improvement program (at least in its early stages).
In general the employees involved were pleased with the results. Surveys conducted among the whole working population show slight improvements on the issues of the programs.
Table 3/8 Opinion of the working population aged 18 years and over about their working conditions
percentages
1974 1980 1983
Shift work; 'yes'
Noisy surroundings; 'yes' Dirty work; 'yes'
Possibility to develop
faculties; 'agree + fully agree'
Good chances for promotion; 'agree + fully agree'
Source: CBS, Social Cultural Quarterly, 1984/2
The decline in the 'possibility to develop faculties' probably is caused by the automation process, see previous paragraph. The diminishing career possibilities are caused by several factors. Economic growth disappeared, so for many jobs the prospects worsened and competition for new functions became tough due to high unemployment. The willingness to change jobs slowed down.
In 1981 a survey was conducted among the employers involved to find out if there was any effect of the program on the firm. Employers seem to see more positive results than employees (Table 3/9).
9
26 28 73 48
10 25 30 67 32
[image:47.595.88.530.319.462.2]The Dutch APV program was a reaction to the introduction of new equipment or the working conditions at existing equipment were considered too bad: programs and jurisdiction lag behind. It is obvious that there are more possibilities for job improvement if some kind of arrangement can be derived before the introduction of new technology. In the German case Technology Agreements (TA) are an integrated part of the job improvement program.
Table 3/9 Effects of APV-1981 according to employers (n=162). Percentages.
factors
Position of firm on labour market Turnover in personnel Absenteeism due to
illness
Economic factors Security
Others
improvement
now
25
25
45
32
59
21
improvement within one year
7
10
20
13
1
~
worsened
-1
-*~
no effect
68
65
35
54
40
79
4 INSTITUTIONAL ARRANGEMENTS
4.1 Collective bargaining
In the seventies wages were most years determined by free collective bargaining in the private sector. Socia