Research Article
A 2D Electromechanical Model of Human Atrial Tissue
Using the Discrete Element Method
Paul Brocklehurst,
1Ismail Adeniran,
2Dongmin Yang,
3Yong Sheng,
3Henggui Zhang,
2and Jianqiao Ye
11Engineering Department, Lancaster University, Lancaster LA1 4YR, UK
2Biological Physics Group, School of Physics and Astronomy, University of Manchester, Manchester M13 9PL, UK 3School of Civil Engineering, University of Leeds, Leeds LS2 9JT, UK
Correspondence should be addressed to Henggui Zhang; [email protected] and Jianqiao Ye; [email protected]
Received 8 December 2014; Accepted 16 March 2015
Academic Editor: Rodrigo W. dos Santos
Copyright © 2015 Paul Brocklehurst et al. This is an open access article distributed under the Creative Commons Attribution License, which permits unrestricted use, distribution, and reproduction in any medium, provided the original work is properly cited.
Cardiac tissue is a syncytium of coupled cells with pronounced intrinsic discrete nature. Previous models of cardiac electromechan-ics often ignore such discrete properties and treat cardiac tissue as a continuous medium, which has fundamental limitations. In the present study, we introduce a 2D electromechanical model for human atrial tissue based on the discrete element method (DEM). In the model, single-cell dynamics are governed by strongly coupling the electrophysiological model of Courtemanche et al. to the myofilament model of Rice et al. with two-way feedbacks. Each cell is treated as a viscoelastic body, which is physically represented by a clump of nine particles. Cell aggregations are arranged so that the anisotropic nature of cardiac tissue due to fibre orientations can be modelled. Each cell is electrically coupled to neighbouring cells, allowing excitation waves to propagate through the tissue. Cell-to-cell mechanical interactions are modelled using a linear contact bond model in DEM. By coupling cardiac electrophysiology
with mechanics via the intracellular Ca2+concentration, the DEM model successfully simulates the conduction of cardiac electrical
waves and the tissue’s corresponding mechanical contractions. The developed DEM model is numerically stable and provides a powerful method for studying the electromechanical coupling problem in the heart.
1. Introduction
Atrial fibrillation (AF) is characterised by rapid and irregular conduction of cardiac electrical excitation waves, impairing the ability of the heart to pump blood via mechanical contraction. AF is the most common cardiac arrhythmia [1], affecting∼1.5% of the UK population, a figure which increases with age (rising to 5% beyond the age of 65 and 10% beyond the age of 75 [2]). It can cause cerebral stroke, incapacitation, and loss of life [3,4]. Despite this, the underlying processes governing the generation and maintenance of AF are not yet fully understood [5] and current clinical treatments are sig-nificantly unsatisfactory [6]. Computational models provide a powerful tool for studying these phenomena and would provide a means of quantitatively predicting the underlying molecular and ionic mechanisms that facilitate the genesis
and perpetuation of AF. They also provide a level of control that would not be possible in an experimental setting. Therefore, there is an urgent need to develop biophysically detailed computational models that are capable of capturing various complex mechanisms in the atria, which may then be used to study AF and test potential treatments.
Understanding AF requires thorough analysis of the electrical behaviour of the atria. Highly detailed models of individual cardiac cells have been developed, building on the earlier pioneering work of Hodgkin and Huxley [7] and Noble [8]. These models include the Courtemanche et al. [9] and Nygren et al. [10] models, both of which reproduce the action potential of human atrial myocytes as recorded exper-imentally. Each model features stiffly nonlinear differential equations simulating the flux of ionic currents to provide the membrane potential of a single cell. Many larger-scale
electrophysiological studies exist, which investigate excita-tion conducexcita-tion from cell to cell. This presents a challenge to researchers owing to the large computational cost, high speed of the electrical wave, and complex anatomy of the atria [11,12]. Typically researchers use experimental datasets such as [13] constructing the various atrial regions (pectinate muscle, crista terminalis, Bachmann’s bundle, etc.), each of which has different electrical properties. In order to handle such difficulties numerically, a very fine spatial resolution is required in computational models [5,14,15]. Full reviews of electrophysiological progress may be found in [16,17].
The inclusion of mechanical dynamics is vital for a model to address how cardiac arrhythmias or a proposed treatment can affect the mechanical contraction of the heart, especially, since there is strong coupling between electrical and mechanical activities in the atria [18,19]. Sophisticated models exist at the myocyte/myofilament level [20,21], cap-turing the complex force-calcium relationship and sarcomere dynamics. On a larger scale, cardiac tissue may be mechan-ically idealized as transversely isotropic, hyperelastic, and incompressible [22]. Tissue-/organ-scale models typically use a traditional continuum mechanics approach through mate-rials homogenization, modelling the tension development and deformation by using stress-strain relationships [23–
25]. However, a simply idealized continuum approximation of cardiac tissue ignores the pronounced discrete nature of cardiac tissue and cell arrangement and therefore has fundamental limitations.
In this study, we used the discrete element method (DEM) rather than a continuum approach to physically and mechanically represent atrial tissue. DEM belongs to a family of discrete methods originally proposed by Cundall in 1971 in application to the behaviour of discontinuous materials [26]. The method was refined in [27,28] and describes the motion of circular “particles.” Recently, researchers have shown that particles may be bonded together to accurately model fibre-reinforced materials [29–31].
DEM is therefore well suited in application to atrial tissue, due to the discrete cellular arrangement, the dis-continuous tissue’s electrophysiological properties, and the complex geometry of the atria. The aforementioned contin-uum mechanics approaches assume a smooth and homoge-neous tissue, neglecting consideration of the discontinuous microstructure and irregular arrangement of cells. In this study, we develop a multiscale DEM model that accurately captures electrical and mechanical processes at both the cell and tissue scales in the atria. We build the groundwork for future model development at the organ scale and show that DEM has the potential to be a powerful approach for representing the anisotropic and inhomogeneous nature of the human heart.
The paper is arranged as follows. Section 2 provides an overview of DEM theory used by the model, and the atrial single-cell model is presented. The method for elec-trical propagation is described as well as the coupling with mechanical contraction. Some simulation results are shown
inSection 3. A discussion of the method and conclusions are
given inSection 4and some future work is proposed.
2. Method
2.1. Model for Excitation and Contraction of a Single Cell. The developed biophysically detailed model for the atria considers two physics scales: cellular and tissue. At the cellular level, we simulated the electrical and mechanical behaviour of a single atrial myocyte by coupling two well-known models. For the electrical behaviour, we used the Courtemanche et al. model [9]. Each cell was considered equipotential, with the time derivative of the cell’s membrane potential𝑉(in mV) given by
𝑑𝑉 𝑑𝑡 = −
(𝐼ion+ 𝐼st)
𝐶𝑚 , (1)
where𝐼ion is the total ionic current (pA),𝐼st is an external stimulus (pA), and 𝐶𝑚 is the membrane capacitance (pF). Various ionic and pump currents are represented in the model:
𝐼ion= 𝐼Na+ 𝐼K1+ 𝐼to+ 𝐼Kur+ 𝐼Kr+ 𝐼Ks+ 𝐼Ca,𝐿
+ 𝐼𝑝,Ca+ 𝐼NaK+ 𝐼NaCa+ 𝐼𝑏,Na+ 𝐼𝑏,Ca,
(2)
where𝐼Naand𝐼𝑏,Naare the fast and background Na+currents, respectively;𝐼K1,𝐼to,𝐼Kur,𝐼Kr, and𝐼Ksare the inward rectifier, transient outward, ultrarapid rectifier, and rapid and slow delayed rectifier K+ currents, respectively; 𝐼Ca,𝐿, 𝐼𝑝,Ca, and
𝐼𝑏,Caare the L-type, pump, and background Ca2+ currents, respectively;𝐼NaKis the Na+−K+pump current; and𝐼NaCais the Na+−Ca2+exchanger current. Each ion channel current is modelled by the Huxley-Hodgkin formulation which is fitted to experimental data. For example, the fast sodium current is implemented as
𝐼Na= 𝑔Na𝑚3ℎ𝑗 (𝑉 − 𝐸Na) , (3)
where 𝑔Na is maximal Na+ conductance and 𝐸Na is the equilibrium potential for sodium. The voltage dependency of ion channels is modelled by gating variables𝑚(activation),ℎ (inactivation), and𝑗(slow activation), each governed by
𝑑𝑦 𝑑𝑡 =
𝑦∞− 𝑦
𝜏𝑦 . (4)
For any gate variable 𝑦, 𝑦∞ is its steady state value and 𝜏𝑦 its time constant, both of which are functions of𝑉that are algebraically defined based on data from atrial cells. Differential equations also exist to keep track of intracellular concentrations of Ca2+, Na+, and K+.
a sum of normalized forces within the cell integrated over time:
Integralforce
= ∫ (−𝐹active− 𝐹passive+ 𝐹preload+ 𝐹afterload) 𝑑𝑡, (5)
with terms representing the contribution of various forces from the model formulation. The sarcomere length SL is then computed by
𝑑SL 𝑑𝑡 =
Integralforce+ (SL0−SL) ∗viscosity
mass , (6)
where SL0 is initial sarcomere length. Here viscosity and mass are constants which help describe the muscle response [20]. The model is formulated with close attention to experi-mental data for rat and rabbit myofilaments. Due to lack of experimental data for human contracting cells, we use the rat species modifying parameters of the original paper and a physiological temperature of 37∘C. The initial sarcomere length is chosen as SL0= 2.2 𝜇m to reflect possible stretching at end-diastole.
We coupled the Courtemanche et al. and Rice et al. models by a two-way feedback method. The definition for calcium concentration[Ca2+]ifrom the Courtemanche et al. model [9] is modified slightly to give
𝑑 [Ca2+]i
𝑑𝑡 =
𝐵1
𝐵2, (7)
where𝐵1and𝐵2are defined by
𝐵1= 2𝐼NaCa− 𝐼𝑝,Ca− 𝐼CaL− 𝐼𝑏,Ca
2𝐹𝑎𝑉𝑖
+𝑉up(𝐼up,leak− 𝐼up) + 𝐼rel𝑉rel 𝑉𝑖
− 2𝑑Trop𝐴Ca
𝑑𝑡 ,
𝐵2= 1 + [𝐶𝑚𝑑𝑛]max𝐾𝑚,𝐶𝑚𝑑𝑛 ([Ca2+]i+ 𝐾𝑚,𝐶𝑚𝑑𝑛)2,
(8)
and other variables are defined as in [9]. Here, we have inserted𝑑Trop𝐴Ca/𝑑𝑡as calculated in the Rice et al. model [20]. Values of [Ca2+]i are fed into the Rice et al. model, completing the feedback cycle. In this manner, we obtain a system of nonlinear equations which accurately predicts the membrane potential, calcium concentration, and length of a single cell throughout its excitation-contraction cycle. The system consists of nonlinear differential equations for the 32 time-dependent variables. In total, we monitor 182 variables for each cell at each time step, providing diagnostic information on all aspects of single-cell dynamics.
2.2. DEM Theory. The mechanical interaction of cells in this study is analysed using DEM theory. The theory in full
may be found in the two-part paper [27,28]. The particular implementation and computational engine utilized in this paper is the Particle Flow Code (PFC) by Itasca Consulting Group Inc. [32].
DEM tracks the dynamic interaction of “particles,” where in this two-dimensional context a particle is defined as a rigid disc of unit thickness occupying a finite space. Each particle’s position and velocity are tracked throughout the simulation, which is solved by an explicit time-stepping algorithm. Newton’s second law is used to determine the motion of each particle arising from contact/body forces upon it. A force-displacement law is used to update the contact forces arising from the relative motion at each contact [26,29,32].
For this two-dimensional study, the degrees of freedom of the particles are the𝑥- and𝑦-directions and rotation about the𝑧-axis. The equation for a single particle’s translational motion may be written [31,32] as follows:
𝐹𝑖= 𝑚 ( ̈𝑥𝑖− 𝑔𝑖) , (9)
where𝑖 = 1, 2, 3denotes the coordinate directions(𝑥, 𝑦, 𝑧),𝐹𝑖 is the resultant force (the sum of all externally applied forces acting on the particle), ̈𝑥𝑖is the particle acceleration,𝑚is the mass of the particle, and𝑔𝑖is a body force acceleration vector (e.g., gravity). The equation for rotational motion is given by [31,32]
𝑀3= 𝐼 ̇𝜔3, (10)
where𝑀3is the resultant moment referred to the𝑧-axis,𝑤3is the rotational velocity about the𝑧-axis, and𝐼is the rotational inertia of the particle.
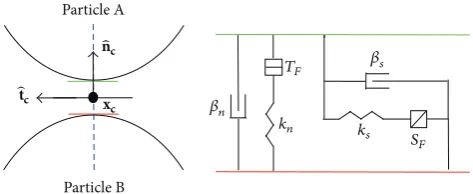
A solid material may be modelled using DEM by bond-ing particles together usbond-ing contact models, and a force-displacement law is solved at the contacts. Two particles may be bonded by a pair of elastic springs with constant normal and shear stiffness (see Figure 1). The bond is retained if the two particles overlap slightly, causing a resistive force, or become slightly separated, causing an attractive force. The springs have specified tensile and shear strength under force, and the contact breaks if these strengths are exceeded. In this study, they are taken high enough for the contacts to persist indefinitely. We use a contact model similar to that described in [33], providing the behaviour of an infinitesimal, linear elastic bonded interface which carries a force. In addition, dashpots are present in the normal and shear direction to provide damping [32].
Particle A
Particle B xc
̂tc
̂
nc
kn
TF
ks S
F
𝛽n
[image:4.600.52.289.73.170.2]𝛽s
Figure 1: An illustration of the linear contact bond model used in
the DEM model, connecting two particles𝐴and𝐵. Herexcis the
location of the contact plane centred between the two particles,̂nc
is the normal directed towards particle𝐵, and̂tcis the tangential
direction.𝑘𝑛and𝑘𝑠are the normal and shear spring stiffness,𝛽𝑛and
𝛽𝑠are the dashpot normal and shear critical damping ratios, and𝑇𝐹
and𝑆𝐹are the tensile and shear strengths of the contact under force.
of the contact under force. We may thendescribe the relative translational motion of particle surfaces at a contact by
̇𝛿 = ̇x(𝐴)c − ̇xc(𝐵),
̇𝜃 = w(𝐴)−w(𝐵), (11)
whereẋc(𝑁) is the translational velocity of particle𝑁at the contact location:
̇
xc(𝑁)= ̇x(𝑁)+w(𝑁)× (xc−x(𝑁)) . (12)
Here, ẋ(𝑁) and w(𝑁) are the respective translational and rotational velocities of particle 𝑁, and x(𝑁) is the location of particle𝑁[32]. The relative translation motion ̇𝛿may be decomposed further into its normal and shear parts:
̇𝛿 = ̇𝛿𝑛n̂c+ ̇𝛿𝑠̂tc. (13) Now, we denote the total contact force asFc, with linear and dashpot components:
Fc =Fl+Fd, (14) and each may be resolved into normal and shear parts:
Fl= −𝐹𝑙
𝑛n̂c+ 𝐹𝑠𝑙̂tc,
Fd= −𝐹𝑑
𝑛n̂c+ 𝐹𝑠𝑑̂tc.
(15)
Finally, the normal contact force is updated at each time step:
𝐹𝑛𝑙 = 𝑘𝑛𝑔𝑠, (16)
where 𝑔𝑠 is the surface gap between the two contacting particles. The shear contact force is updated incrementally, starting from zero and subtracting at each time step:
Δ𝐹𝑠𝑙= −𝑘𝑠 ̇𝛿𝑠Δ𝑡. (17)
The update of the dashpot normal force is given by
𝐹𝑛𝑑= 2𝛽𝑛√𝑚𝑐𝑘𝑛 𝑛̇𝛿, (18)
where𝑚𝑐relates the mass of each particle [32]:
𝑚𝑐 = 𝑚 𝐴𝑚𝐵
𝑚𝐴+ 𝑚𝐵. (19)
The update of the dashpot shear force is
𝐹𝑠𝑑= 2𝛽𝑠√𝑚𝑐𝑘𝑠 ̇𝛿𝑠. (20)
The contacts transmit only a force and no moment, and slippage does not occur in this model because contacts are always present for any given particle.
Particles in DEM can be grouped to form a “clump” that behaves as one body. The contacts between particles within a clump are skipped to reduce the computational cost, whereas contacts between a clump and any particle external to that clump are treated normally. The particles within a clump may overlap to any extent and will never break apart. Hence, a clump may be used to approximate the shape of any nonspherical body (e.g., cylindrical cells in atrial tissue), by using an arbitrary number of particles.
2.3. Applying DEM to Human Atrial Tissue. When choosing how to apply DEM to model human atrial tissue, several considerations must be made. For example, we must first decide how many particles to use in representing one cell (and how to arrange the particles), seeking a balance between realism and computational expense. We must also choose how to introduce force into the system to allow muscle contraction.
DEM gives the option to apply a body force to each particle. For a distribution of particles representing a cell, force could be applied to particles at either end, causing contraction. However, using this approach, it is very difficult to correctly balance the forces within a cell and avoid affecting the neighbouring cells. This leads to unrealistic force accumulation throughout the tissue and an uneven contrac-tile response from each cell. Further, balancing the spring stiffness and particle overlap to satisfy the incompressibility condition of atrial tissue is troublesome. In reality, the protein binding process which results in sarcomere contraction (see, e.g., [34]) causes symmetric cell shortening, which is an independent process for each cell and cells interact mechan-ically in mostly a supportive context. Therefore, it seems appropriate to instead use one DEM clump to represent one cell. Clumps are rigid with respect to one another and are only able to influence each other’s positions, not their size or shape. In order to accurately model contraction of the cell, we manually change the position and size of each clump’s particles to match the amount of contraction predicted by the single-cell model in Section 2.1. In this manner, we ensure that each individual cell responds in a mechanically correct way to the electrical stimulus. Also, this approach helps alleviate the computational expense caused by the large number of cells required.
L
r d
p1 p2 pn−1 pn
S
· · ·
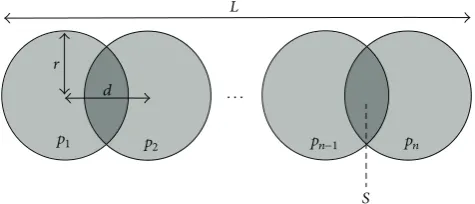
Figure 2: Geometry of one clump/cell in the DEM model. Here,
𝑝1, . . . 𝑝𝑛 are the 𝑛 particles,𝑟 is their radius, 𝑑 is the distance
between particle centres,𝐿is the total length of the clump, and𝑆
is the area of the overlap region between particles.
as𝜌 = 1.053g/mL, taken from values calculated in [35] for rat myocardial tissue regional densities. In our DEM model, 𝑛particles are arranged end to end as shown inFigure 2, using a radius of𝑟 = 8 𝜇m. The number and amount of overlapping of the particles are chosen such that the length of the clump 𝐿 = 100 𝜇m. The amount of overlap is the same for each particle; hence, the equation for the length of the clump is
𝐿 = (𝑛 − 1) 𝑑 + 2𝑟, (21)
where𝑑is the distance from the centre of one particle to the next. In this case we use𝑛 = 9, giving𝑑 = 10.5 𝜇m when the cell is at rest. Using simple geometry, the total area𝐴of the clump is given by
𝐴 = 𝑛𝜋𝑟2− (𝑛 − 1) 𝑆, (22)
where the area𝑆is
𝑆 = 2𝑟2arccos(𝑑 2𝑟) −
𝑑
2√4𝑟2− 𝑑2. (23)
At every time step, the single-cell model ofSection 2.1outputs a sarcomere length for each cell. Since each cell consists of sarcomeres arranged end to end, we assume the total cell length is equal to a linear scaling of the sarcomere length. The area𝐴is always held constant to satisfy the incompressibility condition of atrial tissue. Solving(21)and(22)simultaneously gives the two unknowns𝑟and𝑑, and the clump particle radii and positions are then modified to satisfy these new values. In this manner, the cell/clump may contract/expand in length while conserving 2D area.
[image:5.600.52.290.74.176.2]2.4. Cell-Cell Coupling. Cells need to be coupled both elec-trically (to allow the electrical excitation waves to propa-gate through the tissue) and mechanically (to capture the tissue’s elastic response to cell contraction). Using DEM, it is simple to construct the mechanical tissue model: clumps are placed in the model where required and aligned with the desired fibre orientation. Mechanical contacts are then formed between clumps/cells and their nearest neighbours. A generous contact detection threshold is set, to ensure a dense arrangement of particles. The DEM distribution is computationally cycled until it reaches a stable equilibrium.
Figure 3: A region of tissue made up of several DEM clumps. Each clump is colored individually, and black circles denote a contact between particles.
Mechanical boundary conditions may be applied to any clump, fixing them in either the 𝑥- or 𝑦-directions or both.Figure 3 displays a DEM model of a region of tissue comprising several cells.
Physically, the DEM contacts in our model represent connective material between individual cells. This includes the cell-binding protein structures desmosomes and other connective tissue. In this study, we seek to capture the qualitative behaviour of these materials, which is primarily to prevent the separation and overlap of cells and facilitate force transmission between cells. Therefore, the DEM parameters are chosen to satisfy the following criteria.
(i) The spring stiffness values𝑘𝑛 and𝑘𝑠and their ratio are selected such that the mechanical response to cell contraction is prompt and that cells are not separated throughout the contraction process.
(ii) The spring stiffness values are selected high enough that particles resist overlapping, and thus the incom-pressibility of the tissue is satisfied as closely as possible.
(iii) The spring stiffness and dashpot damping parameters 𝛽𝑛and𝛽𝑠are selected to minimize elastic oscillation and ensure smooth contraction and expansion of the tissue.
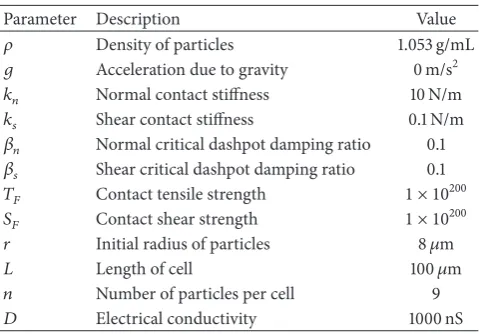
Obtaining the desired behaviour is undertaken through a trial and error process, as the system behaviour is somewhat sensitive to the spring parameters𝑘𝑛 and 𝑘𝑠 (and the ratio between them). In general, higher normal contact stiffness𝑘𝑛 causes the above criteria to be satisfied but requires a smaller time step to maintain the stability of the system’s solution. However, a critical maximum mechanical time step can be estimated based on parameters [32].Table 1 shows the full set of DEM parameter values used in this paper. Note that gravity is neglected in this study as the atria are assumed to be supported by the surrounding anatomy.
Table 1: DEM parameter value used in the model.
Parameter Description Value
𝜌 Density of particles 1.053 g/mL
𝑔 Acceleration due to gravity 0 m/s2
𝑘𝑛 Normal contact stiffness 10 N/m
𝑘𝑠 Shear contact stiffness 0.1 N/m
𝛽𝑛 Normal critical dashpot damping ratio 0.1
𝛽𝑠 Shear critical dashpot damping ratio 0.1
𝑇𝐹 Contact tensile strength 1 × 10200
𝑆𝐹 Contact shear strength 1 × 10200
𝑟 Initial radius of particles 8𝜇m
𝐿 Length of cell 100𝜇m
𝑛 Number of particles per cell 9
𝐷 Electrical conductivity 1000 nS
and velocity butnoteach other’s size and shape. Instead, the length and width of each clump are manipulated manually prior to each time step, based on the single-cell model output. Then, the DEM calculations give the positional response of the total clump distribution by solving the equations of motion and contact forces. The only force introduced into the system is contact forces between cells, which arises as a result of the contraction/expansion of each cell.
The electrical coupling of cells is performed once the DEM particle distribution is constructed. Two cells are con-sidered electrically coupled whenever a DEM contact exists between them, and we define two such cells as “neighbours.” Equation(1), which governs the membrane potential of each cell, contains a term𝐼stwhich represents an external stimulus. Cells are assumed to stimulate their neighbours, representing electricity flowing from cell to cell. If a cell labelled 𝐻 with membrane potential𝑉𝐻has𝑁neighbours, the external stimulus for cell𝐻is given by
𝐼st= 𝐷 𝑁
∑
𝑖=1
(𝑉𝑖− 𝑉𝐻) , (24)
where 𝐷 is an electrical conductance parameter and 𝑉𝑖 is the membrane potential of the neighbour numbered𝑖. The conductivity𝐷governs the velocity of the electrical wave and has a value of1000nS as listed inTable 1. This procedure is repeated for each cell in the tissue, creating one large network of coupled ODEs for the electrical behaviour of all cells in the model.
Physically, electrical propagation from cell to cell is largely due to the presence of gap junctions, a specialized intercellular connection allowing ions and electrical impulses to pass through a regulated gate between cells [36,37]. Gap junctions are predominantly localized at the cell ends in the fibre direction [38]. However, in our model, the physical con-nections between cells are the DEM contacts, which naturally are more numerous in the transverse direction than the fibre direction (e.g., seeFigure 3). Our approach reflects an attempt to balance this discrepancy by assuming that even if multiple DEM contacts exist between two cells, the electrical flow between them is divided equally amongst these contacts. That
is, the number of DEM contacts between two cells does not affect the strength of electrical conduction between them, as long as one contact is present. InSection 3.2, we show that this approach is able to accurately mimic electrical propagation through cells and replicate the anisotropic behaviour of atrial tissue.
Figure 4shows a schematic of the full electromechanical
computational cycle for each time step of the model. The DEM equations are solved explicitly by a centred finite-difference scheme, and a time step of Δ𝑡 = 0.004ms is required owing to the relatively stiff contact springs. For the coupled single-cell equations, the same fixed time step of Δ𝑡 = 0.004ms is used, to guarantee the stable solution of the coupled system of nonlinear single-cell equations using the explicit Euler method and to handle the high wave speed of the electrical propagation. Each box inFigure 4must be completed before proceeding to the next; however, they may be computed efficiently in parallel to speed up calculation times. All calculations are performed using an Intel Xeon 3.6 GHz CPU and multithreaded using all 8 threads and double precision. DEM calculations are performed using PFC version 5.0 [32], and all other calculations are performed using a custom C++ library interfacing with PFC. Further computational savings are made by disabling the contact detection phase of DEM during cycling, which is usually present. The particles in this model are densely packed and tightly bonded to their immediate neighbours, meaning no new contacts will be formed throughout the contraction phase.
3. Results
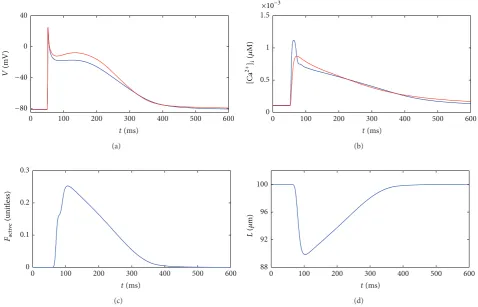
3.1. Single-Cell Model. In this section, we present results from the single-cell model described inSection 2.1. These reflect the electrical and mechanical behaviour of an isolated single cell. At𝑡 = 50ms, a2nA external stimulus was applied to the cell for a duration of2ms. Initial conditions in the cell are obtained by pacing at1Hz for 200 beats.Figure 5shows the evolution of several variables over time within the cell.
Figure 5(a) shows the action potential, beginning at a
resting membrane potential close to −82mV and reaching 20mV in response to the external stimulus. The classic spike-and-dome morphology of the Courtemanche et al. model was altered slightly by the mechanical coupling; the dome was less prominent dome and the action potential duration was slightly shorter in the coupled single-cell model (blue) compared to an uncoupled purely electrical model (red) [9]. The abrupt response to the electrical stimulus is evidence of the stiffness inherent in the equations, which must be carefully accounted for numerically.
t = t + Δt
For each particle, apply the law of motion, updating the particle position and velocity based on the resultant force and motion due to contact forces
For each cell, loop over cell
neighbours and calculate the
total external voltage
contributionIst
For each cell, solve the
single-cell equations and update
time-dependent variables using an
explicit timestep
For each cell, scale the sarcomere
length output from single-cell
equations to give predicted cell length; calculate new values of
particle radius and overlap; update
particle radius and position For each contact between
particles, solve the
force-displacement law, updating the
contact forces based on relative motion and contact constitutive
[image:7.600.100.498.85.322.2]model
Figure 4: The computational cycle for the full electromechanical model.
0 100 200 300 400 500 600
0 40
−40
−80
t (ms)
V
(mV)
(a)
0 100 200 300 400 500 600
0 0.5 1 1.5
t (ms)
×10−3
[
Ca
2+]
i
(
𝜇
M)
(b)
0 100 200 300 400 500 600
0 0.1 0.2 0.3
t (ms)
Factive
(uni
tless)
(c)
0 100 200 300 400 500 600
88 92 96 100
t (ms)
L
(
𝜇
m)
(d)
Figure 5: Results from the single-cell model ofSection 2.1(blue curves). The time evolution of several variables is plotted in response to an
external stimulus. (a) Membrane potential𝑉, (b) intracellular calcium concentration[Ca2+]i, (c) active force𝐹active, and (d) cell length𝐿. For
[image:7.600.60.539.393.700.2](a) (b) (c) (d)
−80 −60 −40 −20 0 20
(mV)
Figure 6: Electrical propagation through a region of connected DEM cells. (a)𝑡 = 3.92ms, (b)𝑡 = 9.12ms, (c)𝑡 = 13.52ms, and (d)
𝑡 = 21.52ms. Cells are colored according to their membrane potential𝑉.
contracted by around 10% of its original length and was fully contracted50ms after receiving a stimulus.
3.2. Electrical Conduction. In this section, we demonstrate the method for the electrical coupling of cells, allowing the excitation wave to propagate through the DEM model domain. We construct a rectangular region of tissue, with all cells oriented vertically, such that the fibre direction is in the𝑦plane. The tissue consists of 90 k particles (10 k cells), representing a region of tissue which is5mm in length and 3.2mm in width. The top-left corner of cells receives external stimulus of2nA at𝑡 = 1ms with a duration of2ms. The progress of the electrical wave is shown inFigure 6.
Several cavities are opened in the tissue to demonstrate that the method can handle discontinuous tissue geometry. In addition, the anisotropy of atrial tissue conduction is naturally accounted for by the formulation; that is, electrical propagation along fibres is faster than that in the transverse direction. This is due to the larger spatial step in the fibre direction, owing to the clump shape. Here, we have chosen a value for the conduction parameter (𝐷 = 1000nS), leading to a conduction velocity of approximately55cm/s in the fibre direction, in agreement with experimental measurements [16]. The model exhibits a conduction anisotropy ratio of roughly 6 : 1 between the fibre and transverse directions. The literature estimates for the anisotropy ratio of atrial tissue vary between 4.76 : 1 and 8 : 1 [16] with little experimental data available.
3.3. Mechanical Contraction. In this section, we present re-sults from the full electromechanical tissue model described
inSection 2.1. A region of tissue5mm in length and3.2mm
in width was constructed with the fibre direction aligned with the𝑦-axis, comprised of 10 k cells and 90 k particles. The full simulation took approximately 4 hours to complete600ms of simulated time. The computational time is approximately
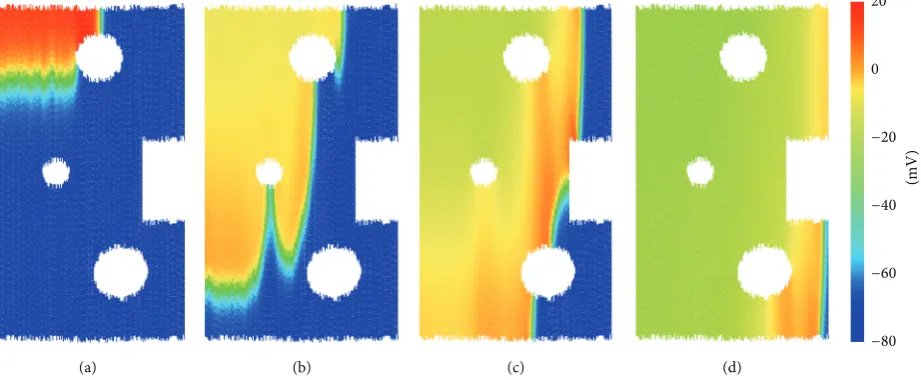
consumed as 50% on DEM calculations, 20% on electrical wave propagation, 20% applying contraction to each cell, and 10% solving the single-cell equations. A boundary condition was applied to the lowermost cells along the𝑥-axis, fixing their movement in the𝑦-direction. The top portion of tissue received a stimulus of2nA at𝑡 = 1ms lasting for2ms. Sev-eral snapshots are presented inFigure 7as the electrical wave propagates throughout the tissue and contraction occurs.
InFigure 7(a), the rapid electrical wave spreads
through-out the cells; by 𝑡 = 37.12ms (Figure 7(b)), contraction is underway in the cells near the top of the tissue. At 𝑡 = 55.92ms (Figure 7(c)), the tissue is fully contracted, and the tissue width has expanded to account for its loss in height due to the tissue incompressibility. Gradually, the tissue relaxes to its resting shape (Figure 7(d)).
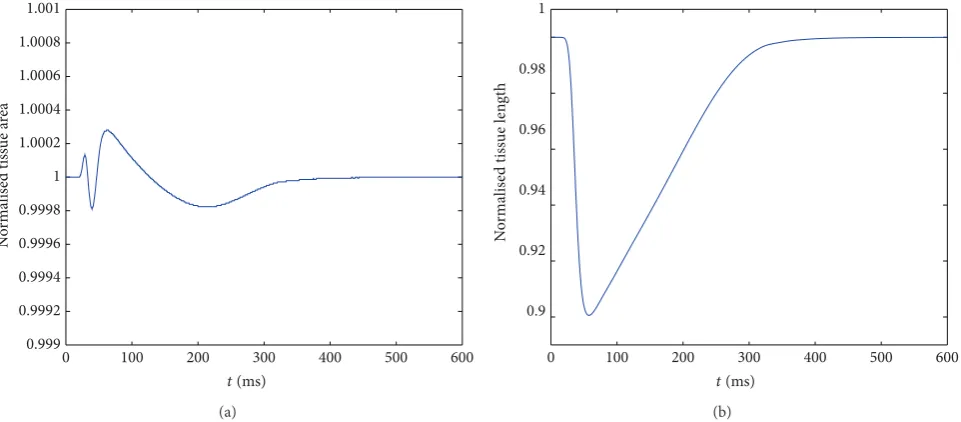
To calculate the area of the tissue, we need to account for the area of the physical particles as well as the voids between particles and any particle overlap. We form a polygon with vertices at the centre points of clumps which are on the boundary of the tissue and then calculate the area of the polygon.Figure 8(a)shows the normalised tissue area (tissue area divided by initial resting area) andFigure 8(b) shows normalised length (distance from the top to bottom through the central fibre divided by the resting length) throughout the contraction.
Figure 8(a)shows that tissue incompressibility is achieved
[image:8.600.71.532.77.267.2]−80 −60 −40 −20 0 20
(mV)
[image:9.600.63.541.79.266.2](a) (b) (c) (d)
Figure 7: Full electromechanical model for a rectangular region of tissue. (a)𝑡 = 7.12ms, (b)𝑡 = 37.12ms, (c)𝑡 = 55.92ms, and (d)
𝑡 = 225.92ms.
0 100 200 300 400 500 600
0.999 0.9992 0.9994 0.9996 0.9998 1 1.0002 1.0004 1.0006 1.0008 1.001
N
o
rm
ali
sed ti
ss
ue a
rea
t (ms)
(a)
0 100 200 300 400 500 600
0.9 0.92 0.94 0.96 0.98 1
t (ms)
N
o
rm
ali
sed ti
ss
ue len
gth
(b)
Figure 8: Normalised tissue area (a) and normalised tissue length (b) against time.
4. Discussion
4.1. Summary. In this study, we have developed a novel multiscale electromechanical model for the human atria from single cell to tissue level using DEM. Our major contributions are (i) a new cellular model for atrial electromechanical activ-ity that couples the Courtemanche et al. electrophysiology model [9] to the Rice et al. myofilament model [20]. The developed cell model is implemented in DEM by using a clump of nine particles, representing atrial cellular geometry; (ii) a 2D DEM tissue model of atrial tissue was developed with consideration of atrial anisotropic and discrete natures. Using the tissue model, the conduction of cardiac electrical waves and the corresponding mechanical contraction were
simulated; and (iii) a numerically stable algorithm was developed to solve the DEM model of atrial tissue.
[image:9.600.61.542.321.532.2]comprising many regions of different geometrical structures [16], which form a challenge for an accurate reconstruction of these regions and numerical treatment of the nodes by FEM. However, the use of DEM allows any possible arrangement and configuration of individual cells.
The numerical method we presented here was stable and efficient, capable of handling over half a million cells on a single desktop computer. Both the single-cell equations and DEM equations may be solved by explicit numerical methods. Continuum models for electrical propagation frequently use reaction-diffusion type equations [16]: such an approach often requires the iterative solution of a large system of equations [17], slowing down computation times. In addition, the centred finite difference approach to solving the DEM equations used here allows calculation of a critical time step [32], ensuring that the mechanical solution remains stable. Further, in our model there is ample opportunity for par-allelism throughout the distinct steps of the computational cycle.
4.2. Limitations and Future Work. The present model has several limitations and aspects which may be improved in later model development. First, the single-cell model is not verified against human experimental data, and the Rice et al. [20] model is formulated for nonhuman species. Some authors have attempted to update the Courtemanche and Rice models for use in human models, such as [42, 43]. However, the development of complete electromechanical single-cell models for various regions of the human atria warrants further study as more experimental data becomes available.
The method for electrical conduction between cells needs further improving, though it performs reasonably well. A more sophisticated method could be used, such as track-ing the diffusion of electricity through individual particles or direct incorporation of gap junctions. However, these approaches may inhibit the choice of using an equipotential single-cell model. The present method provides a good balance between realism and numerical efficacy.
The focus of the present paper was to introduce the DEM methodology for simulating atrial electromechanics, and there is therefore room for improvement in the future. The DEM bond stiffness and damping parameters can be adapted in different directions to more accurately capture the behaviour of the connective material between cells. A more sophisticated contact model than the linear bond model used here can be developed, possibly including nonlinear effects and viscoelasticity. In addition, to complete the electrome-chanical coupling, feedback from meelectrome-chanical contraction can be incorporated into the electrical formulation by introduc-ing a term representintroduc-ing stretch-activated currents [44].
In future, DEM could be used for organ-scale simulations where millions of cells are required. The explicit nature of the numerical methods means the method should scale well to massively parallel systems, using CPU or GPU processors. Construction of an anatomically accurate 3D configuration of cells should be possible. Clumps could be packed into a desired geometry while dynamically modifying their align-ment based on experialign-mental data sets defining the atria’s
fibre orientations. To ensure a dense packing of particles, additional smaller particles could be added, representing connective tissue. In this manner, one could “build” a DEM system of cells to accurately model an atrial region. Though the present paper deals with cells which are aligned in a parallel manner, preliminary tests of our DEM method indicate it is suitable to model abrupt or gradual changes in fibre direction, such as those found in the atria.
4.3. Conclusion. We conclude that DEM is a powerful method for modelling electromechanical behaviour in the human atria. The ability to consider discrete cell arrangement means that DEM is well suited to simulate the dynamic behaviour of atrial tissue, which is anisotropic and discon-tinuous by nature. The multiscale model established here can be used in the future to study the effect of heterogeneity in atrial tissue, which is necessary to fully understand the mechanisms behind AF and other phenomena. The method shows potential to be used for construction of a full 3D model of the human atria, which would provide a valuable computer modelling platform for testing antiarrhythmic drugs and other AF treatments.
Conflict of Interests
The authors declare that there is no conflict of interests regarding the publication of this paper.
Acknowledgments
The authors are grateful for financial support provided to the project by EPSRC (EP/J00958X/1; EP/I029826/1) and also to the developers of Itasca Consulting Group’s Particle Flow Code v5 for their assistance in improving the DEM computational times.
References
[1] S. Nattel, A. Shiroshita-Takeshita, B. J. J. M. Brundel, and L. Rivard, “Mechanisms of atrial fibrillation: lessons from animal
models,”Progress in Cardiovascular Diseases, vol. 48, no. 1, pp.
9–28, 2005.
[2] E. J. Benjamin, P. A. Wolf, R. B. D’Agostino, H. Silbershatz, W. B. Kannel, and D. Levy, “Impact of atrial fibrillation on the risk
of death: the framingham heart study,”Circulation, vol. 98, no.
10, pp. 946–952, 1998.
[3] J. S. Alpert, P. Petersen, and J. Godtfredsen, “Atrial
fibrilla-tion: natural history, complications, and management,”Annual
Review of Medicine, vol. 39, pp. 41–52, 1988.
[4] S. Nattel, “New ideas about atrial fibrillation 50 years on,”
Nature, vol. 415, no. 6868, pp. 219–226, 2002.
[5] M. W. Krueger, A. Dorn, D. U. J. Keller et al., “In-silico modeling of atrial repolarization in normal and atrial fibrillation
remod-eled state,”Medical and Biological Engineering and Computing,
vol. 51, no. 10, pp. 1105–1119, 2013.
[6] J. R. Ehrlich and S. Nattel, “Novel approaches for
pharmacolog-ical management of atrial fibrillation,”Drugs, vol. 69, no. 7, pp.
[7] A. L. Hodgkin and A. F. Huxley, “A quantitative description of membrane current and its application to conduction and
excitation in nerve,”The Journal of physiology, vol. 117, no. 4, pp.
500–544, 1952.
[8] D. Noble, “A modification of the Hodgkin-Huxley equations applicable to Purkinje fibre action and pacemaker potentials,”
The Journal of Physiology, vol. 160, no. 2, pp. 317–352, 1962. [9] M. Courtemanche, R. J. Ramirez, and S. Nattel, “Ionic
mech-anisms underlying human atrial action potential properties:
insights from a mathematical model,” American Journal of
Physiology—Heart and Circulatory Physiology, vol. 275, no. 1, pp. H301–H321, 1998.
[10] A. Nygren, C. Fiset, L. Firek et al., “Mathematical model
of an adult human atrial cell: the role of K+ currents in
repolarization,”Circulation Research, vol. 82, no. 1, pp. 63–81,
1998.
[11] D. Harrild and C. Henriquez, “A computer model of normal
conduction in the human atria,”Circulation Research, vol. 87,
no. 7, pp. E25–E36, 2000.
[12] O. V. Aslanidi, M. A. Colman, J. Stott et al., “3D virtual human atria: a computational platform for studying clinical atrial
fibrillation,”Progress in Biophysics and Molecular Biology, vol.
107, no. 1, pp. 156–168, 2011.
[13] V. Spitzer, M. J. Ackerman, A. L. Scherzinger, and D. Whitlock,
“The visible human male: a technical report,”Journal of the
American Medical Informatics Association, vol. 3, no. 2, pp. 118– 130, 1996.
[14] G. Seemann, C. H¨oper, F. B. Sachse, O. D¨ossel, A. V. Holden, and H. Zhang, “Heterogeneous three-dimensional anatomical
and electrophysiological model of human atria,”Philosophical
Transactions of the Royal Society A: Mathematical, Physical and Engineering Sciences, vol. 364, no. 1843, pp. 1465–1481, 2006. [15] S. Kharche, G. Seemann, L. Margetts, J. Leng, A. V. Holden,
and H. Zhang, “Simulation of clinical electrophysiology in 3D human atria: a performance computing and
high-performance visualization application,”Concurrency
Computa-tion Practice and Experience, vol. 20, no. 11, pp. 1317–1328, 2008. [16] O. D¨ossel, M. W. Krueger, F. M. Weber, M. Wilhelms, and G. Seemann, “Computational modeling of the human atrial
anatomy and electrophysiology,”Medical and Biological
Engi-neering and Computing, vol. 50, no. 8, pp. 773–799, 2012. [17] R. H. Clayton, O. Bernus, E. M. Cherry et al., “Models of
cardiac tissue electrophysiology: progress, challenges and open
questions,”Progress in Biophysics and Molecular Biology, vol.
104, no. 1–3, pp. 22–48, 2011.
[18] N. H. L. Kuijpers, H. M. M. Ten Eikelder, P. H. M. Bovendeerd, S. Verheule, T. Arts, and P. A. J. Hilbers, “Mechanoelectric feedback leads to conduction slowing and block in acutely dilated atria: a modeling study of cardiac electromechanics,”
American Journal of Physiology, vol. 292, no. 6, pp. H2832– H2853, 2007.
[19] P. Kohl, P. Hunter, and D. Noble, “Stretch-induced changes in heart rate and rhythm: clinical observations, experiments
and mathematical models,”Progress in Biophysics and Molecular
Biology, vol. 71, no. 1, pp. 91–138, 1999.
[20] J. J. Rice, F. Wang, D. M. Bers, and P. P. de Tombe, “Approximate model of cooperative activation and crossbridge cycling in
car-diac muscle using ordinary differential equations,”Biophysical
Journal, vol. 95, no. 5, pp. 2368–2390, 2008.
[21] S. A. Niederer, P. J. Hunter, and N. P. Smith, “A quantitative analysis of cardiac myocyte relaxation: a simulation study,”
Biophysical Journal, vol. 90, no. 5, pp. 1697–1722, 2006.
[22] D. A. Nordsletten, S. A. Niederer, M. P. Nash, P. J. Hunter, and N. P. Smith, “Coupling multi-physics models to cardiac
mechanics,”Progress in Biophysics and Molecular Biology, vol.
104, no. 1–3, pp. 77–88, 2011.
[23] R. C. P. Kerckhoffs, S. N. Healy, T. P. Usyk, and A. D. Mccul-loch, “Computational methods for cardiac electromechanics,”
Proceedings of the IEEE, vol. 94, no. 4, pp. 769–783, 2006. [24] R. H. Keldermann, M. P. Nash, H. Gelderblom, V. Y. Wang,
and A. V. Panfilov, “Electromechanical wavebreak in a model of
the human left ventricle,”The American Journal of Physiology—
Heart and Circulatory Physiology, vol. 299, no. 1, pp. H134–H143, 2010.
[25] M. P. Nash and A. V. Panfilov, “Electromechanical model of
excitable tissue to study reentrant cardiac arrhythmias,”Progress
in Biophysics and Molecular Biology, vol. 85, no. 2-3, pp. 501–522, 2004.
[26] P. A. Cundall, “A computer model for simulating progressive
large-scale movements in blocky rock systems,” inProceedings
of the Symposium of International Society of Rock Mechanics, Nancy, France, 1971.
[27] P. A. Cundall, “Formulation of a three-dimensional distinct element model—part I: a scheme to detect and represent contacts in a system composed of many polyhedral blocks,”
International Journal of Rock Mechanics and Mining Sciences & Geomechanics Abstracts, vol. 25, no. 3, pp. 107–116, 1988. [28] R. Hart, P. A. Cundall, and J. Lemos, “Formulation of a
three-dimensional distinct element model—part II. Mechanical calculations for motion and interaction of a system composed
of many polyhedral blocks,” International Journal of Rock
Mechanics and Mining Sciences & Geomechanics Abstracts, vol. 25, no. 3, pp. 117–125, 1988.
[29] D. Yang, Y. Sheng, J. Ye, and Y. Tan, “Discrete element modeling
of the microbond test of fiber reinforced composite,”
Computa-tional Materials Science, vol. 49, no. 2, pp. 253–259, 2010. [30] Y. Sheng, D. Yang, Y. Tan, and J. Ye, “Microstructure effects on
transverse cracking in composite laminae by DEM,”Composites
Science and Technology, vol. 70, no. 14, pp. 2093–2101, 2010. [31] D. Yang, Y. Sheng, J. Ye, and Y. Tan, “Dynamic simulation
of crack initiation and propagation in cross-ply laminates by
DEM,”Composites Science and Technology, vol. 71, no. 11, pp.
1410–1418, 2011.
[32] Itasca Consulting Group, Particle Flow Code Version 5 User
Manual, Itasca Consulting Group, Minneapolis, Minn, USA, 2014.
[33] D. O. Potyondy and P. A. Cundall, “A bonded-particle model
for rock,”International Journal of Rock Mechanics & Mining
Sciences, vol. 41, no. 8, pp. 1329–1364, 2004.
[34] A. F. Huxley and R. Niedergerke, “Structural changes in muscle during contraction: interference microscopy of living muscle
fibres,”Nature, vol. 173, no. 4412, pp. 971–973, 1954.
[35] K. C. Vinnakota and J. B. Bassingthwaighte, “Myocardial density and composition: a basis for calculating intracellular metabolite
concentrations,” American Journal of Physiology—Heart and
Circulatory Physiology, vol. 286, no. 5, pp. H1742–H1749, 2004. [36] P. D. Lampe and A. F. Lau, “Regulation of gap junctions
by phosphorylation of connexins,”Archives of Biochemistry &
Biophysics, vol. 384, no. 2, pp. 205–215, 2000.
[37] P. D. Lampe and A. F. Lau, “The effects of connexin
phosphory-lation on gap junctional communication,”International Journal
[38] S. Rohr, “Role of gap junctions in the propagation of the cardiac
action potential,”Cardiovascular Research, vol. 62, no. 2, pp.
309–322, 2004.
[39] S. Alonso and M. B¨ar, “Reentry near the percolation threshold
in a heterogeneous discrete model for cardiac tissue,”Physical
Review Letters, vol. 110, no. 15, Article ID 158101, 5 pages, 2013. [40] Y. Rudy and W. L. Quan, “A model study of the effects of the
discrete cellular structure on electrical propagation in cardiac
tissue,”Circulation Research, vol. 61, no. 6, pp. 815–823, 1987.
[41] J. N. Weiss, Z. Qu, P.-S. Chen et al., “The dynamics of cardiac
fibrillation,”Circulation, vol. 112, no. 8, pp. 1232–1240, 2005.
[42] M. A. Colman, O. V. Aslanidi, S. Kharche et al., “Pro-arrhythmogenic effects of atrial fibrillation-induced electri-cal remodelling: insights from the three-dimensional virtual
human atria,”Journal of Physiology, vol. 591, no. 17, pp. 4249–
4272, 2013.
[43] B. L. de Oliveira, B. M. Rocha, L. P. Barra, E. M. Toledo, J. Sundnes, and R. W. dos Santos, “Effects of deformation on transmural dispersion of repolarization using in silico models
of human left ventricular wedge,” International Journal for
Numerical Methods in Biomedical Engineering, vol. 29, no. 12, pp. 1323–1337, 2013.
[44] N. Trayanova, W. Li, J. Eason, and P. Kohl, “Effect of
stretch-activated channels on defibrillation efficacy,”Heart Rhythm, vol.
Submit your manuscripts at
http://www.hindawi.com
Stem Cells
International
Hindawi Publishing Corporation
http://www.hindawi.com Volume 2014
Hindawi Publishing Corporation
http://www.hindawi.com Volume 2014 INFLAMMATION
Hindawi Publishing Corporation
http://www.hindawi.com Volume 2014
Behavioural
Neurology
Endocrinology
International Journal of Hindawi Publishing Corporationhttp://www.hindawi.com Volume 2014
Hindawi Publishing Corporation
http://www.hindawi.com Volume 2014
Disease Markers
Hindawi Publishing Corporation
http://www.hindawi.com Volume 2014
BioMed
Research International
Oncology
Journal ofHindawi Publishing Corporation
http://www.hindawi.com Volume 2014
Hindawi Publishing Corporation
http://www.hindawi.com Volume 2014
Oxidative Medicine and Cellular Longevity Hindawi Publishing Corporation
http://www.hindawi.com Volume 2014
PPAR Research
The Scientific
World Journal
Hindawi Publishing Corporation
http://www.hindawi.com Volume 2014
Immunology Research
Hindawi Publishing Corporation
http://www.hindawi.com Volume 2014
Journal of
Obesity
Journal ofHindawi Publishing Corporation
http://www.hindawi.com Volume 2014
Hindawi Publishing Corporation
http://www.hindawi.com Volume 2014
Computational and Mathematical Methods in Medicine
Ophthalmology
Journal ofHindawi Publishing Corporation
http://www.hindawi.com Volume 2014
Diabetes Research
Journal ofHindawi Publishing Corporation
http://www.hindawi.com Volume 2014
Hindawi Publishing Corporation
http://www.hindawi.com Volume 2014
Research and Treatment
AIDS
Hindawi Publishing Corporation
http://www.hindawi.com Volume 2014
Gastroenterology Research and Practice
Hindawi Publishing Corporation
http://www.hindawi.com Volume 2014
Parkinson’s
Disease
Evidence-Based Complementary and Alternative Medicine
Volume 2014