This is a repository copy of Reanalysis of rate data for the reaction CH3 + CH3 → C2H6
using revised cross sections and a linearized second-order master equation.
White Rose Research Online URL for this paper:
http://eprints.whiterose.ac.uk/89226/
Version: Accepted Version
Article:
Blitz, MA, Green, NJB, Shannon, RJ et al. (4 more authors) (2015) Reanalysis of rate data
for the reaction CH3 + CH3 → C2H6 using revised cross sections and a linearized
second-order master equation. Journal of Physical Chemistry A, 119 (28). 7668 - 7682.
ISSN 1089-5639
https://doi.org/10.1021/acs.jpca.5b01002
[email protected] https://eprints.whiterose.ac.uk/ Reuse
Unless indicated otherwise, fulltext items are protected by copyright with all rights reserved. The copyright exception in section 29 of the Copyright, Designs and Patents Act 1988 allows the making of a single copy solely for the purpose of non-commercial research or private study within the limits of fair dealing. The publisher or other rights-holder may allow further reproduction and re-use of this version - refer to the White Rose Research Online record for this item. Where records identify the publisher as the copyright holder, users can verify any specific terms of use on the publisher’s website.
Takedown
If you consider content in White Rose Research Online to be in breach of UK law, please notify us by
1
Reanalysis of Rate Data for the Reaction
Using
Revised Cross-Sections and a Linearised Second Order Master Equation
M. A. Blitza, N.J.B. Greenb, R. J. Shannona, M. J. Pillinga,*, P. W. Seakinsa, C.M. Westernc, S. H.
Robertsond
a
School of Chemistry, University of Leeds, Leeds, LS2 9JT, UK
b
Inorganic Chemistry Laboratory, University of Oxford, South Parks Road, Oxford, OX1 3QR, UK
c
School of Chemistry, Cantock's Close Bristol BS8 1TS, UK
d
Dassault Systèmes, BIOVIA, Science Park, Cambridge, CB4 0WN, UK
Corresponding author M J Pilling, [email protected], Tel ++44 1943 608239
Abstract
Rate coefficients for the CH3 + CH3 reaction, over the temperature range 300 900 K, have been
corrected for errors in the absorption coefficients used in the original publication (Slagle et al., J.
Phys. Chem. 1988, 92, 2455-2462). These corrections necessitated the development of a detailed
model of the B2A1' (3s) - X 2
A2" transition in CH3 and its validation against both low temperature and
high temperature experimental absorption cross sections. A master equation (ME) model was
developed, using a local linearization of the second order decay, which allows the use of standard
matrix diagonalization methods for the determination of the rate coefficients for CH3 + CH3. The ME
model utilised inverse Laplace transformation to link the microcanonical rate constants for
dissociation of C2H6 to the limiting high pressure rate coefficient for association, ; it was used
to fit the experimental rate coefficients using the Levenburg-Marquardt algorithm to minimise 2
calculated from the differences between experimental and calculated rate coefficients. Parameters
for both and for energy transfer were varied and optimised in the fitting
2
2000 K. A high pressure limit of = 5.76 × 10⁻¹¹ (T/298 K)-0.34 cm3 molecule-1 s-1 was obtained,
that agrees well with the best available theoretical expression.
1. Introduction
The association of two methyl radicals
CH3 + CH3 C2H6 (R1)
is important in combustion chemistry as a termination reaction and as a source of C2 species in
methane oxidation1 and in planetary atmospheres following methane photolysis.2,3 The reaction has
been widely studied experimentally, and Baulch et al.4 provide a critical analysis of the data,
although they omit some more recent determinations.
The reaction is pressure dependent and is usually parameterised for combustion
applications using the Troe approach,5,6 although the use of Chebyshev polynomials is increasing.7
The limiting high pressure rate coefficient, , is a key parameter but is more difficult to
determine experimentally at higher temperatures, as the reaction moves increasingly into the fall-off
region as the temperature is increased at accessible pressures. Theoretical methods have improved
considerably and high level calculation arguably provides a more accurate determination of
than does extrapolation of experimental data. The radial potential energy is barrierless and
variational methods, such as flexible transition state theory8 and the statistical adiabatic channel
model9 are required, making demands on the quality of both the radial and angular potentials.
Klippenstein et al.10 demonstrated clearly the importance of the level of theory used to calculate the
potential. They used a variety of approaches, finding CASPT2 provided the most accurate form for
the potential energy, and concluded that methods that include dispersion interactions are essential.
They showed that spin contamination effects become important at shorter bond distances, as the
3
increases. They also incorporated dynamical effects of re-crossing the dividing surface between
(energised) C2H6 and the radicals, proposing an overall decrease in of 15%. The analysis
showed that the rate coefficient decreases with temperature, by a factor close to two over the range
300 2000 K. Earlier, Klippenstein and Harding11 compared their MRCI calculations with a master
equation (ME) analysis of the experimental data. They found that their calculated values exceeded
those from the ME analysis of the rate data (in Ar), by a factor that increased with temperature,
reaching a threefold difference at 1700 K.
The experimental data of Slagle et al.12 have been most widely used in comparison between
theory and experiment at temperatures up to 1000 K. The measurements were based on pulsed
laser photolysis and two radical detection techniques, photoionization mass spectrometry (PIMS) at
low bath gas densities (2 30 × 1016 cm-3) and absorption spectroscopy (AS) at higher densities (1.5 ×
1017 1.5 × 1019 cm-3). The AS measurements required the methyl radical absorption cross-section,
, to convert the second order radical absorbance decays into concentration profiles and hence rate
coefficients. is temperature dependent and was measured by Macpherson et al.13,14 over
the temperature range 296 - 537 K and compared to values calculated at temperatures up to 700 K.
The rate coefficients were also measured, as a function of pressure, over the 296 577 K range.
Subsequent measurements were made at temperatures up to ~900 K with the cross-section
determined by a simple extrapolation of a power series representation of , based on the lower
temperature data, without the benefit of further calculations of the cross section at temperatures
above 700 K.12 These values were later criticised by Hessler and Ogren15 who compared the
extrapolated cross-sections with narrow line width laser measurements, finding significant
differences.
In view of the importance of these AS measurements in providing an experimental set of
pressure and temperature dependent rate coefficients that are relatively close to the high pressure
4
against the lower temperature experimental measurements and against higher temperature
measurements of Oehlschlaeger et al.16 The revised cross-sections are then used to correct the rate
coefficients. The master equation code MESMER17 is then used to fit the experimental data, using
inverse Laplace transformation of the high pressure limiting rate coefficient, ,
to determine the microcanonical rate constants (k(E)) required for the ME calculation. The fitting
was based on the optimisation of the fitting parameters, A, n and the parameters and
m in an exponential down model of collisional energy transfer ( = ).
The method thus provides a direct determination of , which is compared with the theoretical
values of Klippenstein et al.10, over the temperature range 300 900 K.
While the AS measurements provide the set of rate data under conditions closest to the high
pressure limit, there is an extensive set of data available covering a wide range of conditions. These
data were also fitted using the MESMER methodology. This has allowed both the testing and
reassessment of the high pressure limit over the temperature range 300 -2000 K. In addition, the
lower pressure data provide a more extensive means of determining the energy transfer
parameters.
Section 2 reports the methods used for the redetermination of the absorption cross section
for analysis of the AS data. Section 3 briefly outlines the master equation methodology. This section
also includes a discussion of the approach used to link the second order rate coefficients to the high
pressure rate coefficient and energy transfer parameters. This discussion is important since the
master equation approach is usually based on a first order analysis of the kinetics and an exponential
representation of the radical decay, but for this reaction a second order formulation is required, so
the analysis is based on a local linearization, either within the experimental decay or as equilibrium
is approached. Section 4.1 presents an analysis of the AS data and gives the best fit
parameterisations for and for (Ar). Section 4.2 extends the analysis to other
5
of selectivity, which is rationalised in the Supplementary Information. Section 5 compares the
experimental fits with theory.
2. The UV absorption cross section of the B2A1' (3s) - X 2
A2" transition in CH3.
The experimental kinetics results from absorption spectroscopy12,18,19 all use measurements at
selected single wavelengths, and rely on knowing the absorption cross section at these wavelengths
under the experimental conditions, particularly the temperature dependence. Unfortunately the B-X
electronic transition used is far from ideal for this sort of work, as not only is the upper state strongly
predissociated, but also the pattern of vibrational and rotational levels is not fully known for either
state. A further complicating factor is that the available spectroscopic information does not cover
the full temperature range of the kinetic measurements. However, given the importance of the B-X
transition in CH3, there has been some spectroscopy on this and related transitions that post-dates
some of the kinetics measurements, and it is worth re-analysing these kinetic measurements in the
light of these newer data. In addition, we can investigate the sensitivity of the cross sections, and
hence the derived kinetic parameters for a range of different assumptions about the missing data. In
this section we present a selection of simulated absorption cross sections as a function of
temperature for under various different assumptions.
2.1 Ground State CH3
The literature on the spectroscopy of the ground electronic state is reasonably comprehensive; the
most recent relevant paper is by Kawaguchi,20 containing a high resolution Fourier transform
3 band, the asymmetric stretch, which, combined with measurements of the same
band by Amano et al.,21 gave a set of rotational constants for the zero point level as well as the v3 = 1
level. The symmetric stretc 1, is infra-red inactive, but a rotationally resolved coherent Raman
1 fundamental has been reported by Triggs et al. 22
6
by Westre and co-workers.23,24 The out-of plane bending mode 2 has a relatively low frequency
(606 cm1) so excited bending levels must be included in the simulations, but fortunately high
2 fundamental and two hot bands have been reported by
Yamada et al.,25 and lower resolution spectra of higher levels are available from Hermann and
Leone.26 Surprisingly, given that the degenerate bending vibration, 4, should be infra-red active, the
only available experimental measurements are in a matrix, complicated by the presence of
rotational structure persisting in the matrix. The strongest component in matrix spectra is the rR0(0)
transition, expected about 14 cm 1 4 band origin. Measurements in a neon matrix27
and argon matrix28 thus suggest a band origin of 1382-3 cm 1 and measurements in a para hydrogen
matrix29 suggest a band origin of 1387 cm 1. A recent high level ab initio calculation by Cunha de
Miranda et al.30 predicted an anharmonic frequency of 1390 cm1 4; the same calculation
predicted the other modes to within 4 cm1. In the absence of other information, we use a simple
average of 1387 cm1. Since the linewidth in the excited state is greater than 65 cm1,the uncertainty
4 is not significant.
Apart from 4, all the lower rovibrational levels are thus well characterised. To make best use
of the available data we refitted using the PGOPHER program31 to all the rotationally resolved data
given above, which resulted in minor adjustments to the published constants. For details of this fit,
and the final constants used see the Supporting Information. As the molecule is a symmetric top only
the changes to C, DK and HK from the zero point level are determined from the spectroscopy, so we
fixed these at the values estimated by Kawaguchi20 from planarity c F 4 we took the
band origin as 1387 cm1, and simply took the zero point rotational constants, with the Coriolis
3 + 4 = B/2C 1 given by Meal and Polo. 32
To complete the ground state calculation the partition function is required. The vibrational
partition function has been discussed by Medvedev et al.,33 who demonstrated clearly that
7
temperatures. Based on an explicit sum over levels calculated from a high quality ab initio surface,
they showed the partition function calculated assuming harmonic levels was 1.5 times the true value
at 2000 K, rising to a factor of 3 at 3000 K. The error arises mainly from the negative anharmonicity
2. Their calculated levels were, however 10-20 cm 1
in error compared to the observed values
(where available), so our calculation was based on a fit to experimental levels. The band origins from
the rotational calculation above were combined with some additional lower resolution data23,24,26
and fitted to the conventional power series expansion for vibrational levels in (v+½). These available
data allowed the 1 2. The vibrational partition function
was then calculated by an explicit sum over states. This gave values very similar to that from an
explicit sum over states of the 64 levels given by Medvedev et al.,33 with the discrepancy rising from
1% at temperatures around 1100 K, and this only because more than 64 levels were required to
converge the sum. To investigate the effect of ignoring the anharmonicity in v4, the energy level fit
was extended to include the 2v4 and 3v4 from Medvedev et al. 33
This had a minor effect on the
partition function (1% at 3000 K) so the error from ignoring the anharmonicity in the higher
frequency v3 mode is probably negligible.
The complete partition function including rotation was then calculated based on a simple
sum, Qrovib, over all rovibrational states for all states up to and including the v3 = 1 level at 3160 cm
1
. This required adding 2 4 2 4 4 2 levels to the rovibrational calculation, with
estimated values of the constants. To correct for the vibrational levels excluded from this sum, two
vibrational partition functions were calculated by an explicit sum over (only) vibrational levels, one
with all vibrational levels (Qvib), and the other a partial sum over the vibrational levels up to v3 = 1,
8 2.2 The B2A1' excited state
The excited state has long been known34,35 to show only poorly resolved vibrational structure, due to
strong predissociation in the upper state, though the predissociation is sufficiently slower in CD3 to
show some rotational structure. Fortunately an IR-UV double resonance study by Settersten et al.36
was able to produce rotationally well resolved electronic spectra by preparing single rotational
levels, and were able to determine an accurate value for the band origin (46239.4±1.2 cm1). This
origin is somewhat different from earlier experimental estimates of 46205 cm1 34 and
46300 ± 50 cm 1.37 The imprecision results from the large width of the individual rotational levels;
this was measured in detail for the origin band by Westre et al.37 by rotational resonance Raman
spectroscopy, who found widths of 65 cm1 for J = 0, increasing mildly with J. This was confirmed by
Settersten et al.,36 who also observed a moderate decrease in width with K which was predicted, but
not observed by Westre et al.37 These widths limited the precision of the rotational constants but
values of B = 2C = 8.827 cm1 from earlier work reproduced the observed spectra. Centrifugal
distortion was ignored, as it would not have been measurable given the low resolution. The level
dependence of the width is only poorly determined by the available data, so for this study a re-fit to
the widths in Settersten et al.36 and Westre et al.37 was performed, giving the width as w(J) = 82 +
0.08J(J+1) cm 1.
Given the temperature range, hot bands must also be considered, and the information on
vibrationally excited states in the B state is limited. The absorption spectrum shows35 two broad
absorptions at shorter wavelengths than the origin band. The longer wavelength feature of these, at
47015 cm1, was identified as a 0100 0100 hot band on the basis of temperature dependence; this
was confirmed by a subsequent resonance Raman study.38 This implies a significantly higher value
2 in the excited state, which has been explained as due to pseudo Jahn-Teller vibronic mixing
with the ground state.25 The linewidths of this transition has only been measured for CD3, 37
where it
9
information the widths of the origin level are simply multiplied by 2.5 for v2 = 1, which gives a hot
band spectrum with no structure reasonably consistent with that given by Callear and Metcalfe.35
The shortest wavelength feature in the absorption spectrum, at 48345 cm 1 is very broad;
resonance Raman spectroscopy has identified this as the 1000-0000 transition in the symmetric
stretch, and measured the width at 400 cm1.37 This corresponds to an excited state stretching
frequency of 2100 cm1, significantly lower than the ground state value of 3160 cm1. This is
consistent with the literature discussions of the predissociation mechanism, as dissociation to H +
CH2 ̃ 1
A1) occurs with a low barrier, estimated to be 2200 cm 1
from modelling the rotational
dependence of the linewidths,37 and consistent with a high level ab initio calculation39 that predicted
a barrier of 2417 cm 1. A low frequency anharmonic motion may thus be expected along the C-H
stretching co-ordinate. T 3 4 comes
from an ab initio calculation by Mebel et al.,40 predicting frequencies of 2794 and 1253 cm 1. This
work also calculated Franck-Condon factors, and predicted that the only vibrationally off-diagonal
transitions with any significant intensity would v1 = 1, as for the 1000-0000 transition
discussed above.
It is now possible to consider what hot bands need to be included for a complete simulation
of the absorption in the region of the hot band at temperatures up to 2000 K. Hot bands involving
the lowest frequency mod 2 are likely to be significant, but the first, 0100-0100 is significantly
shifted from the origin band because the bending frequency is significantly higher in the upper state,
and bands involving higher v2", while significantly populated, will be at significantly higher frequency
and will not contribute to the spectrum of interest. As discussed above, the symmetric stretch is at a
significantly lower frequency than the ground state, so the 1000-1000 hot band should be 1000 cm1
below the origin, so again should not contribute. The same argument might be expected to apply to
3; the low barrier to dissociation along the C-H stretching co-ordinate
10
to the symmetric stretch, giving a similar shift from the origin. In addition the vibrational energy
means that any absorption is likely to be broad, and thus make a small contribution.
This leaves hot bands involving the degene 4, for which little
experimental information is available, and the 0001-0001 band is likely to make a significant
contribution to absorption at the wavelength of interest at the higher temperatures, given there is
no indication of a large change in frequencies between the two states. The vibrational energy is
similar to the 0100 level, so a similar width might be expected, but it is difficult to make further
predictions. In the work here we will therefore use calculations with and without the 0001-0001
band as an indication of the uncertainty in the calculations, and assume the width is the same as
v2' = 1. In principle the 0002-0002 band might also contribute at the higher temperatures, but this is
likely to be above the barrier to dissociation, and thus too broad to give a significant contribution.
This, and other hot band absorptions, could lead to a significant non-resonant background at higher
temperatures given the number of possible populated states; at 2000 K only 10% of the population
is in the ground vibrational state.
The final component needed is the strengths of the various bands. As a starting point we use
the oscillator strength of the origin band determined by Callear and Metcalfe35 of
f = 0.0137 ± 0.0015. Setting up the rovibrational simulation in PGOPHER gave a spectrum with a profile
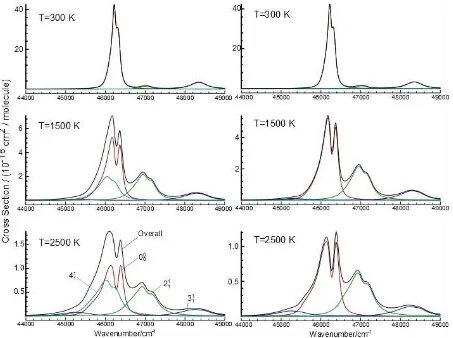
in good agreement with a published spectrum at 293 K compare the top left panel of Figure 1 with
Figure 5 of Settersten et al.36 For these calculations, Model I included 5 vibrational bands the origin
band, 0100-0100, 1000-0000, 1000-1000 and 0001- M II 4 hot band,
0001-0001. To check the absolute absorption cross section, we make use of two measurements of the
cross section at specific wavelengths. The first of these, by Macpherson et al.,13 measured the
absorption at 216.36 nm in the range 296-537 K with a 0.6 nm triangular band pass with an
uncertainty of the individual measurements of about 5%. The second of these, by Oehlschlaeger et
11
again with an estimated uncertainty in the absorption coefficient of 5%. The latter measurements
were made with a very narrow bandwidth laser. To allow for a direct comparison of the two
measurements a correction factor for the lower temperature data is calculated by integrating the
simulated spectra over a triangular function with 0.6 nm full width half maximum, to match the
function specified by Macpherson et al.13, and comparing it to the simulation at the spot wavelength
of 216.62 nm. The correction is done to the low temperature data; as the discussion below will
show, it is much less sensitive to the assumptions made in the simulation. This reduced the effective
low temperature cross section by a factor of 0.80 at 300 K increasing to 0.97 at 537 K as the
spectrum broadened with temperature.
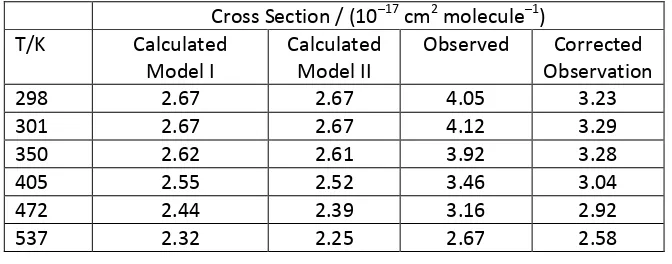
[image:12.595.125.461.420.552.2]Table 1shows calculated and observed values.
Table 1. L B2A1 - X2A2"
transition inCH3
Cross Section / (1017 cm2 molecule 1) T/K Calculated
Model I
Calculated Model II
Observed Corrected Observation
298 2.67 2.67 4.05 3.23
301 2.67 2.67 4.12 3.29
350 2.62 2.61 3.92 3.28
405 2.55 2.52 3.46 3.04
472 2.44 2.39 3.16 2.92
537 2.32 2.25 2.67 2.58
A 4 makes relatively little difference to
the simulation as shown in the similarities of Model I and II (columns 2 and 3 of Table 1). The
agreement between observed and either set of calculated values is quite good if the calculated
values are scaled up by a factor of 1.20. As discussed above, the calculated values use the oscillator
strength from Callear and Metcalfe35 as a base for the intensity, so a correction factor of 1.2 is
reasonable given the , 11% error bars from that work35 and the 5% error bars in Macpherson et al.13
12
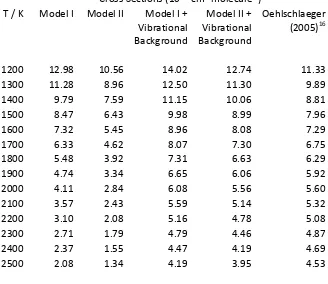
Using the same parameters to simulate the high temperature data of Oehlschlaeger et al.16
reveals a significant discrepancy, in that the calculated values are all much too low, as can be seen in
Table 2. The reason for this becomes apparent on looking at the absorption spectra published in that
work, and in an earlier paper from the same group.41 While the simulation of the profile of the origin
band is reasonable, it is clear that there is a significant very broad absorption that is not from the
origin band, and this absorption is included in the cross section. At 1600 K this accounts for at least
50% of the absorption at the centre of the origin band, and is too large to be accounted for by an
adjust 4 hot band. In addition, the calculated cross section decreases much more rapidly
with increasing temperature than the measured cross section. The implication is that that there are
a significant number of hot bands contributing to the spectrum at higher temperatures. As discussed
above there is no detailed information about these, but we expect them all to be broad as most, if
not all of them, would be above the barrier to dissociation of the excited state at 2200 cm1. We
therefore constructed an approximate model for this vibrational background using the following
assumptions. The model included only vibrational levels, using the energy level pattern calculated
from the constants determined as above. To determine the intensities, Franck-Condon factors were
calculated assuming harmonic oscillator wavefunctions, with the displacement along the only
1 adjusted to match the relative Franck-Condon factors for the origin
and 1000-0000 bands calculated by Mebel et al.40 (The resulting set of Franck-Condon factors were
similar, but not identical to those in Mebel et al.40) The predissociation was accounted for by giving a
width of 1000 cm 1 to all the transitions; the simulation is not very sensitive to the value chosen, and
1000 cm1 gives a reasonable match to the long wavelength end of the spectrum given by Davidson
et al.41 The overall cross section at 216.62 nm is then calculated by adding the cross section from the
rovibronic simulation described above to the cross section from the background model. Any
vibrational transitions included in the rovibrational model were excluded from vibrational model.
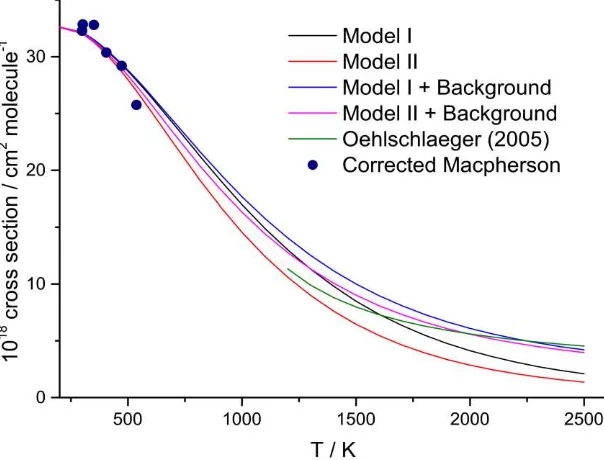
Figure 2 shows an overall simulation at 1600 K showing the effect of this vibrational background.
13
above with the vibrational background added. Note that both include the scaling factor of 1.2 to
[image:14.595.91.419.194.478.2]make the low temperature calculations match with the experiment.
Table 2. High temperature calculated and observed cross sections (10-18 cm2 molecule-1
B2
A1 - X 2
A2" transition inCH3. The calculated values include a scale factor of 1.20 to match the low temperature data.
Cross Sections (10-18 cm2 molecule-1) T / K Model I Model II Model I +
Vibrational Background
Model II + Vibrational Background
Oehlschlaeger (2005)16
1200 12.98 10.56 14.02 12.74 11.33
1300 11.28 8.96 12.50 11.30 9.89
1400 9.79 7.59 11.15 10.06 8.81
1500 8.47 6.43 9.98 8.99 7.96
1600 7.32 5.45 8.96 8.08 7.29
1700 6.33 4.62 8.07 7.30 6.75
1800 5.48 3.92 7.31 6.63 6.29
1900 4.74 3.34 6.65 6.06 5.92
2000 4.11 2.84 6.08 5.56 5.60
2100 3.57 2.43 5.59 5.14 5.32
2200 3.10 2.08 5.16 4.78 5.08
2300 2.71 1.79 4.79 4.46 4.87
2400 2.37 1.55 4.47 4.19 4.69
2500 2.08 1.34 4.19 3.95 4.53
All the models give good fits to the low temperature data, in part because we have used that
to determine the absolute band strength. It is clear that models excluding the broad background give
too low an absorption at high temperatures, and the best fit is Model II + Background, which
4 hot band as part of the background, rather than in the rovibrational model,
suggesting a width for this band rather larger than 200 cm1. This best fit model gives good
agreement over a wide temperature range; an indication of the quality is obtained if the overall
scaling factor is determined from the high temperature data, which gives a value of 1.18 in
comparison with a factor of 1.20 from the low temperature data. This is probably as good as can be
done with the available information as there are two obvious areas where information is lacking.
14
only have limited rotational information, and so ignore centrifugal distortion completely and we only
have a rough model for the rotational dependence of the linewidths; both of these deficiencies are
likely to lead to significant changes at high temperature. The vibrational background model is also
[image:15.595.74.527.197.535.2]obviously very approximate, though this is alleviated by the very low resolution required.
Figure 1. Simulated cross sections for the B2A1 - X 2
A2" transition inCH3 at various temperatures. The panels on the left are for Model I described in the text, and those on the right for Model II, which
15 Figure 2. Simulated cross section for the B2A1 - X
2
A2" transition inCH3 at 1600 K. This is model II as described in the text, with the vibrational background model added. To agree with the low
temperature experimental data, the cross sections need to be scaled up by 1.20
Figure 3.C B2A1 - X
2
A2" transition inCH3 as a function of
[image:16.595.114.416.438.668.2]16
A set of models for the absorption cross section has been developed in this section and tested
against low13,35 and high temperature16 experimental data. It was not possible to constrain the
model fully using those data. In particular, it is not clear what contribution the v4 hot band makes to
the absorption, leading to proposals of two models, one with (Model I) and one without (Model II)
its full potential contribution. In addition, at higher temperatures, it is necessary to invoke a
vibrational background contribution in order to reproduce experiment. The best representation is
found with Model II + vibrational background and it provides a means of calculating the absorption
cross section at temperatures up to 2500 K with reasonable accuracy, using PGOPHER with the input
data given in the Supporting Information. For the present application, we require cross sections up
to 906 K, to refine the rate coefficients obtained by Slagle et al.12 using absorption spectroscopy. The
vibrational background makes little contribution at these temperatures and Models I and II
adequately bracket the values needed to effect this refinement.
3. Master Equation Methodology
The application of the master equation to reactions in the gas phase has been extensively discussed
elsewhere.17,42-45 Here, the main points are summarized and the manipulations required to
accommodate second order systems are discussed. Typically the energy spaces of the species
involved in a reaction are partitioned into a number of contiguous intervals or grains that are
assigned values for the numbers of states they contain, average energies, and, where appropriate,
average values of microcanonical rate coefficients. These grains form the basis of the master
equation representation of the system, an equation of motion of the grain probabilities, which is
usually represented as,
17
where is a vector containing the probability densities of the grains and the matrix contains the
transition rates between the grains either because of collisional activation/deactivation or because
of reaction. The evolution of is limited by two constraints, mass (or density) conservation and
detailed balance.
The solution to Eq. (1) can in general be written as,
(2)
where is a diagonal matrix containing the eigenvalues of , is a matrix of the corresponding
eigenvectors and is a vector containing the initial grain densities. While the detailed trajectories
are often of interest, it is the effective macroscopic rate coefficients that are usually of greater
concern for comparison with experiment or for use in reaction simulation schemes. The extraction of
effective macroscopic rate coefficients can be achieved in a number of ways, but possibly the most
easily automated way is the Bartis-Widom algorithm, which is very effective in those cases where
there is a clear separation of chemically significant eigenvalues (CSEs) from the rest of the
eigenvalue spectrum.
The general form of the master equation given by Eq. (1) is applicable to systems in which
reactions are first order i.e. dissociation and isomerization, or are between two species, one of
which is in excess, i.e. the reaction is pseudo-first order. For such a system, Eq. (1) remains linear and
the elements of remain independent of time. However this is not the case for the title reaction
which is second order in a single species and so cannot be linearized by simply letting one of the
reactants remain at its initial concentration.
This problem has been addressed by a number of workers. Possibly the simplest approach is
to try to account for the temperature and pressure dependence of the association reaction by
considering the rate coefficient for the irreversible unimolecular dissociation reaction and deriving
18
et al.46 applied this procedure in their analysis of the Slagle et al.12 data for CH3 + CH3. The difficulty
with this approach, apart from the numerical precision issues that were encountered (and
circumvented by effectively assuming a reservoir state), is that it does not account for the possible
effects of back reaction which can be significant in more complex reactions. Recently, Georgievskii et
al.47 have reported a method in which they decouple the association reaction from the unimolecular
species which offers another possible approach to the problem. Earlier, Davis and Klippenstein48
reported a comprehensive analysis of the second order association system and applied it to the title
reaction. They examined models of the second order association systems of increasing complexity,
starting with a simple concentration model, until they reached a master equation representation of
the system. The analysis that is applied here is closely related to that work.
Before looking at the full master equation analysis it is perhaps best to re-examine the first
simple model used by Davis and Klippenstein. For the second order reaction,
A A (3)
The phenomenological rate expression for the forward reaction is
d A
d A A
(4)
and at equilibrium the LHS = 0, giving:
A A
(5)
where and are the dissociation and association rate coefficients respectively. Eq. (4) has the
form of the general kinetic equation of motion:
d dt
19
where c is a vector of concentrations and f c is a vector of functions such that the element
determines the evolution of concentration c, and there is an equilibrium concentration vector
such that:
d dt f
(7)
A Taylor expansion of f about some arbitrary fixed point gives:
d d
(8)
where is the Jacobian matrix containing all the partial derivatives . Defining
, it follows that
d d
d d
(9)
This equation shows that the evolution of the trajectory in the neighbourhood of ca is governed
by the Jacobian and the time constants will be the eigenvalues of the Jacobian. In the same
way, as shown by Davis and Klippenstein, the time constants depend on time through their
dependence on the concentration ca. In the case considered this dependence is simple and permits
the identification of first and second-order rate coefficients for the dissociation and association
steps, which do not depend on time, as shown by Davis and Klippenstein.48
For reaction given by Eq. (3) the complete set of rate equations can be expressed as:
d
dt AA k Ak A k Ak A A
(10)
20 d
dt AA A kk k Ak A AA
(11)
Note that the Jacobian in Eq. (11) now depends on the rate coefficients and as well as the local
concentration of A at the point of expansion. The eigenvalues of the above matrix are 0 and
A . The zero eigenvalue follows from mass conservation. The other eigenvalue
governs the rate of motion along the trajectory in the region of the concentration A . If the
eigenvalue is known, then, together with the equilibrium constant expression (Eq. (5)), the effective
macroscopic rate coefficients, and , can be obtained.
The above description does not, of course, account for pressure effects, and in order to do
this the model must be extended to include regular gas kinetic master equation terms. The
development follows along similar lines, the non-linear master equation being,
k A
k A
(12)
where and results in a Jacobian matrix of the form:
(13)
where is a diagonal matrix whose elements are the same as the vector , (the microcanonical
dissociation rate coefficient), is the association rate coefficient, is the distribution function of
the energy of the associated product formed in the reaction (i.e. the chemical activation distribution)
and is obtained from by detailed balance, is the matrix of collisional transition probabilities, is
the identity matrix, and is the collision frequency. The Jacobian in Eq. (12) appears to differ from
that obtained by Davis and Klippenstein.48 This is because they accounted for mass conservation
explicitly by eliminating a differential equation and replacing it with the mass conservation equation,
whereas in the above mass conservation is implicit in the Jacobian and results in the zero eigenvalue.
21
alongside other reaction models within the MESMER framework. The effective rate coefficients
follow from the leading non-zero eigenvalue and the equilibrium constant. In a more complex
scheme with simultaneous isomerisation the Bartis-Widom49 analysis of might resolve the
additional complications, but this requires further analysis and is currently under investigation.
4. Analysis of the Absorption Spectroscopy Data
4.1 Fits to modified absorption spectroscopy data
The experimental data from Slagle et al.,12 based on absorption spectroscopy, were modified using
the absorption coefficients discussed in Section 2. The experiment directly returned values for
k/where is the coefficient for the experimental bandwidth of 0.6 nm. The corrections were
scaled to a value of unity at 300 K in applying the correction, since this was the temperature at which
Macpherson et al.13 made the most detailed measurements. The resulting correction factors and the
rate coefficients are given in Table S1 in the Supporting Information. The modified cross sections
from Models I and II were used and provide appropriate upper and lower bounds for the cross
section (Figure 3). The vibrational background has a negligible effect over the experimental range
(296 906 K).
As discussed above, the microcanonical rate constants for dissociation of C2H6, for
incorporation in the master equation, were determined by inverse Laplace transformation (ILT) of
the high pressure rate coefficient for association, .50 This procedure provides a direct link,
through the master equation, between the pressure and temperature dependent experimental rate
coefficients and one of the main targets of the analysis, The master equation was used to
calculate k(p,T) for each of the 102 experimental conditions using A, n, and m as
variable parameters. The differences between experimental and calculated values of k(p,T) were
22
the best-fit parameters A, n, and m. This procedure is available within the MESMER
code.17,51
The value of 2 per degree of freedom for the fit is 0.44; the experimental values for the
measured uncertainty in k were employed in weighting, suggesting that these uncertainties are
possibly overestimated or contain a systematic component. The best fit parameters are shown in
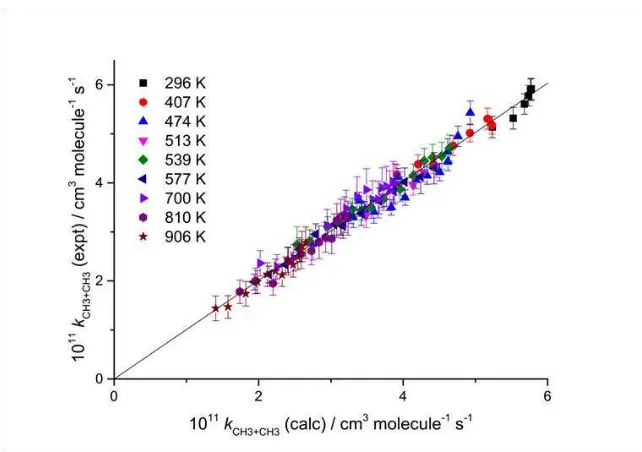
Table 3. Figure 4 shows a plot of the experimental values of k(p,T) vs the calculated values, based on
Model I for the absorption cross section. A linear fit, forced through the origin, is shown. The slope is
[image:23.595.110.431.305.531.2]0.992 and R2 = 0.979.
Figure 4. Plot of the experimental rate coefficients,12 corrected using Model I for the absorption
cross section, vs the best fit values from the master equation fit.
An equally good fit was obtained using Model II for the cross section. As shown in Table 3,
this fit gives a slightly stronger negative temperature dependence, but with (900 K) differing by
only 9% from that returned by Model I. The estimates of the energy transfer parameters, however,
differ substantially between the fits obtained using the two absorption coefficient models. The
differences in the rate coefficients between the two models are only modest and this result
23
too close to the high pressure limit, even at high temperature, to provide a precise representation of
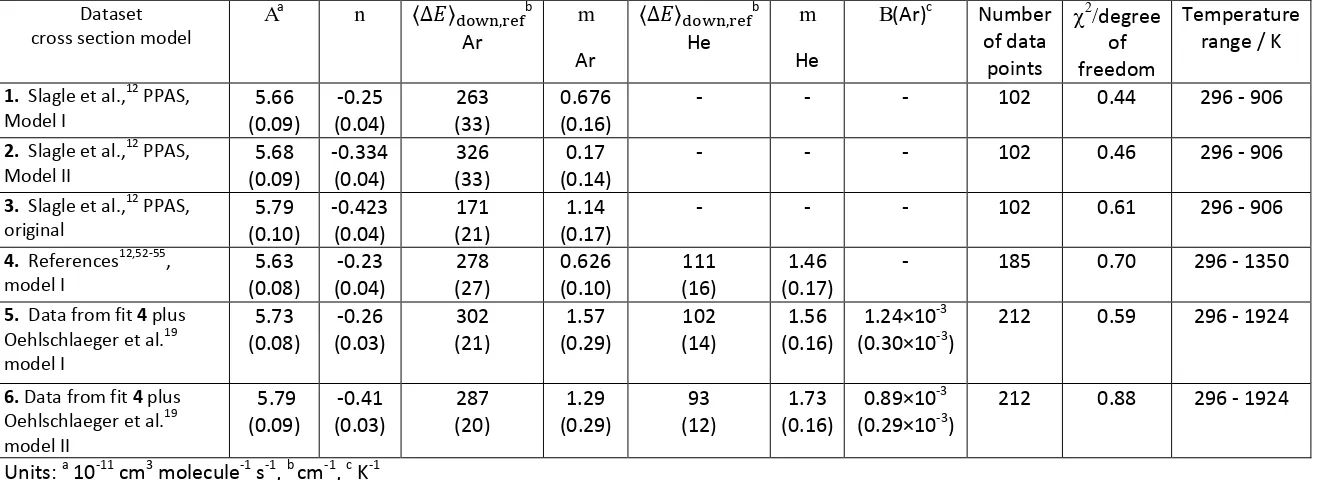
24 Table 3. Best fit parameters from master equation fits.
Dataset cross section model
Aa n b
Ar m Ar b He m He
B(Ar)c Number of data
points
degree
of freedom
Temperature range / K
1. Slagle et al.,12 PPAS, Model I 5.66 (0.09) -0.25 (0.04) 263 (33) 0.676 (0.16)
- - - 102 0.44 296 - 906
2. Slagle et al.,12 PPAS, Model II 5.68 (0.09) -0.334 (0.04) 326 (33) 0.17 (0.14)
- - - 102 0.46 296 - 906
3. Slagle et al.,12 PPAS, original 5.79 (0.10) -0.423 (0.04) 171 (21) 1.14 (0.17)
- - - 102 0.61 296 - 906
4. References12,52-55, model I 5.63 (0.08) -0.23 (0.04) 278 (27) 0.626 (0.10) 111 (16) 1.46 (0.17)
- 185 0.70 296 - 1350
5. Data from fit 4 plus Oehlschlaeger et al.19 model I 5.73 (0.08) -0.26 (0.03) 302 (21) 1.57 (0.29) 102 (14) 1.56 (0.16) 1.24×10⁻³ (0.30×10⁻³)
212 0.59 296 - 1924
6. Data from fit 4 plus Oehlschlaeger et al.19 model II 5.79 (0.09) -0.41 (0.03) 287 (20) 1.29 (0.29) 93 (12) 1.73 (0.16) 0.89×10⁻³ (0.29×10⁻³)
212 0.88 296 - 1924
Units: a 10-11 cm3 molecule-1 s-1, b cm-1, c K-1
Technique: PPAS: pulsed photolysis, absorption spectroscopy
25 4.2 Extended Analysis
There have been several measurements of k(p,T) over a range of conditions (see Table 4), and many
of these studies have been included in an extended set of fits using the MESMER code; each of these
fits has included the modified experimental data discussed in Section 4. The results of three of these
fits are presented in Table 3; further examples are presented in the Supporting Information.
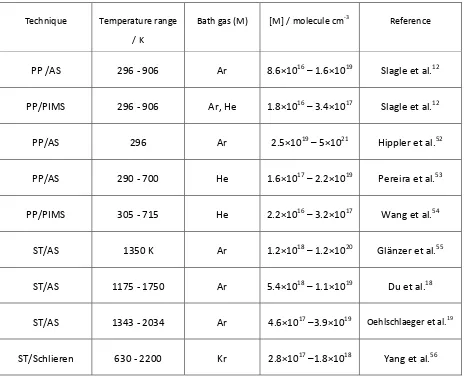
Table 4. Measurements of the rate coefficient for CH3 + CH3 included in the master equation fits
discussed in Section 4.
Technique Temperature range
/ K
Bath gas (M) [M] / molecule cm-3 Reference
PP /AS 296 - 906 Ar 8.6×10¹⁶ 1.6×10¹⁹ Slagle et al.12
PP/PIMS 296 - 906 Ar, He 1.8×10¹⁶ 3.4×10¹⁷ Slagle et al.12
PP/AS 296 Ar 2.5×10¹⁹ 5×10²¹ Hippler et al.52
PP/AS 290 - 700 He 1.6×10¹⁷ 2.2×10¹⁹ Pereira et al.53
PP/PIMS 305 - 715 He 2.2×10¹⁶ 3.2×10¹⁷ Wang et al.54
ST/AS 1350 K Ar 1.2×10¹⁸ 1.2×10²⁰ Glänzer et al.55
ST/AS 1175 - 1750 Ar 5.4×10¹⁸ 1.1×10¹⁹ Du et al.18
ST/AS 1343 - 2034 Ar 4.6×10¹⁷ 3.9×10¹⁹ Oehlschlaeger et al.19
ST/Schlieren 630 - 2200 Kr 2.8×10¹⁷ 1.8×10¹⁸ Yang et al.56
Techniques: PP, pulsed photolysis; AS, absorption spectroscopy; PIMS, photoionization mass spectrometry; ST, shock tube.
In addition to the absorption spectroscopy data from Fit 1, Fit 4 is primarily based on measurements
[image:26.595.67.531.290.669.2]26
photoionization mass spectrometry. The most extensive set of data in this category derives from
Slagle et al.,12 in a joint paper with the absorption spectroscopy measurements discussed above. In
addition higher pressure data were obtained by Pereira et al.53 using absorption spectroscopy at
temperatures up to 700 K. The measurements were secondary to a determination of the rate
coefficient for CH3 + OH and the technique was not optimised for absorption spectroscopy. These
data required correction for the absorption cross section, and Model I was used in Fit 4. Even higher
pressure measurements were made by Hippler et al.52 at 296 K. Finally a limited set of
measurements was made at 1350 K by Glänzer et al.55 using a shock tube with absorption
spectroscopy. Fit 4 returns very similar ILT parameters to fit 1 and the energy transfer parameters
for Ar are comparable. The fit also returns energy transfer parameters for He, using a facility in the
MESMER code that allows fitting to different bath gases, with different energy transfer parameters,
but constrained to the same ILT parameters and hence to the same microcanonical rate constants
for dissociation of C2H6*.
The temperature range was considerably extended in fit 5 by including the shock tube data
of Oehlschlaeger et al.19 They measured the dissociation of C2H6 by monitoring the initial rise of [CH3]
at low concentrations of ethane, to avoid interfering reactions. The absolute values of [CH3] were
determined by absorption spectroscopy; the absorption cross sections were measured directly16 and
the results form the basis of the high temperature models developed in Section 2. The dissociation
rate coefficients were converted into association rate coefficients using the equilibrium constant
calculated from the thermochemical database of Goos et al.57 The fits were poor with the usual
representation of the temperature dependence of . It was necessary to apply a different
set of energy transfer parameters to these shock tube data, significantly reducing the increase in
with T (see Supporting Information). An alternative approach was taken in fit 5 using a
three parameter expression: = exp(-BT) and the best fit
parameters are shown in Table 3. This representation should be interpreted simply as a heuristic
27
this observation may be associated with the recent demonstration of the importance of collisional
angular momentum relaxation, as well as total energy relaxation, in association reactions.58 The
angular momentum distributions in the reaction system will differ considerably at low and at high
[image:28.595.76.523.186.511.2]temperatures.
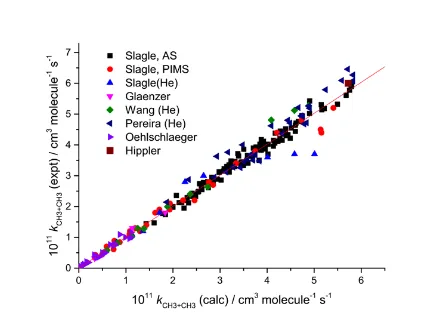
Figure 5. Plot of the experimental rate coefficients vs the best fit values from the master equation fit
5. The data refer to: Slagle et al.,12 Glänzer et al.,55 Wang et al.,54 Pereira et al.,53 Oehlschlaeger et
al.19
The ILT parameters A and n are changed relatively little in the extended fit; the two
expressions for from fits 4 and 5 differ by only 2% across the temperature range. Figure 5 shows a
plot of the calculated values of k(p,T) vs the experimental values from fit 5 and identifies the sources
of the rate data. While the scatter is somewhat larger than is the case for Figure 4, it is still very
28
range in magnitude of the rate coefficients. The slope is 0.993 and R2 = 0.979. The Supporting
Information includes a representation of k(p,T) for the Ar data from this fit using Chebyshev
polynomials.
Fit 6 shows the effects of using the low temperature absorption spectroscopy data corrected
using Model II for the absorption spectroscopy data from Slagle et al.12 Note that in both fits 5 and
6 the data from Oehlschlaeger et al.19 were used directly without any correction to the cross
sections, which were directly measured across the whole temperature range. Indeed these
absorption data were used to assess the different absorption cross section models in Section 2.
Two other sets of rate data were used; they are shown in Table 4 and are discussed in
greater detail in the Supporting Information. Du et al.18 used azomethane dissociation to generate
CH3 with Ar as a bath gas but obtained values ~70% lower than those of Oehlschlaeger et al., 19
with
greater scatter. The measurements of Yang et al.56 involved dissociation of CH3I and were made in Kr
at lower pressures (20 280 Torr). They are more scattered than the data shown in Figure 5 and the
low pressures mean that these data did not constrain A and n significantly. They do, though, provide
estimates of the energy transfer parameters for Kr over a wide experimental range. Values are
reported in the Supporting Information; the paper reports dissociation rate coefficients, which were
converted into association rate coefficients using Goos et al.57
4.3 Uncertainties
A primary goal of this paper is the determination of for the CH3 + CH3 reaction and its
comparison with the best theoretical determinations. An assessment of the overall uncertainty in
the limiting rate coefficients, resulting from the scatter in the experimental measurements and the
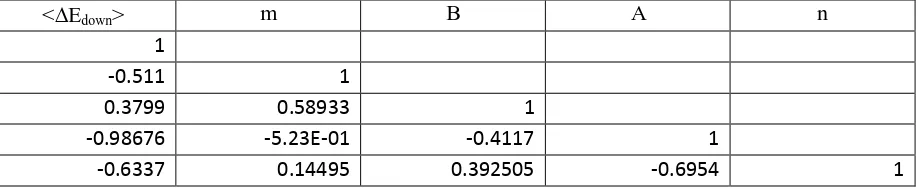
fitting process, is essential in such a comparison. Table 5 gives the correlation matrix for Fit 5,and
demonstrates the strong correlations between all the fitted parameters. It is essential that these
correlations are properly incorporated into the determination of the confidence limits for ,
which were obtained in the following manner. The methodology, in a similar context, is discussed in
29 Table 5. Correlation matrix for Fit 5
<Edown> m B A n
1
-0.511 1
0.3799 0.58933 1
-0.98676 -5.23E-01 -0.4117 1
-0.6337 0.14495 0.392505 -0.6954 1
Table 5 gives the correlation matrix for Fit 5,and demonstrates the strong correlations between all
the fitted parameters. Confidence limits for the high pressure limiting rate coefficients for the CH3 +
CH3 reaction were obtained in the following manner. First of all joint probability distributions,
accounting for correlations between all parameters, were obtained as described in Kucherenko et
al.60 An inverse cumulative distribution function was used to transform a Sobol sequence, consisting
of 1000 elements, into a set of standard normal sample vectors . A Cholesky decomposition, , of
the covariance matrix, from the Marquardt fitting was then calculated:
(14)
and a set of joint probability distributions of the parameters was obtained from as follows:
(15)
Here is a vector of the mean values for each parameter as taken from the best fit values from the
Marquardt fitting procedure. Calculations of the CH3 + CH3 association rate coefficient were then
performed using MESMER at temperatures between 300 and 2000 K at limiting high pressures, the
value of the fitted parameters in each calculation being taken sequentially from . Finally
confidence limits were taken from 2values for the distribution at each temperature. These limits
are shown in Figure 6, which is discussed in more detail in Section 5. The percentage uncertainties,
at the 2level, increase from 3.1% at 300 K to 8.7% at 1500 K. They solely reflect the statistical
30
the latter can be gauged from the fits using Models I and II for the cross section, which are shown
[image:31.595.116.471.141.442.2]using fits 5 and 6 in Figure 6.
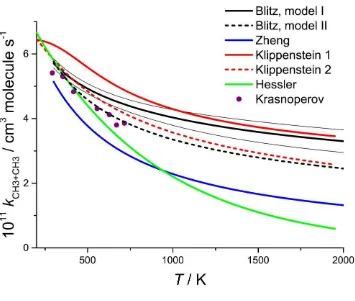
Figure 6. Temperature dependence of for CH3 + CH3 showing the best fit results from Fits
5 and 6 (see Table 3) and the statistical uncertainty limits for Fit 5 ; the narrow black lines show
the upper and lower 2 uncertainties from the analysis discussed in Section 4.3 . The theoretical
results from Klippenstein et al.10,11 and Zheng et al.61 are also shown, together with the best fit
results to experimental data from Hessler and Ogren15 and the recent results by Krasnoperov.62
5. Discussion
5.1 High pressure limit
for CH3 + CH3 at temperatures up to 900 K is well defined by the pulsed photolysis /
31
fits that include data obtained at lower pressures. Inclusion of the shock tube data of Oehlschlaeger
et al.19 increases the negative temperature dependence slightly, but the values of � from
the best fit parameters from Fits 4 and 5 differ by only 3%, well within the fitting uncertainties
discussed in the previous section. It should be noted that those uncertainties solely reflect the
statistical errors from the fits and do not contain any contribution from the uncertainty in the cross
section. The latter can be gauged from the parameters in Table 3 obtained using Models I and II for
the cross section, (fits 5 and 6) and the plots of shown in Figure 6. The best fit values for fit 6
differ from those for fit 5 by 0.8% at 300 K and 24% at 2000 K. The overall uncertainty in at
the2levelis thus ~±10% at 300 K and ~±20% at 2000 K, where the differences between the results
from Models I and II have been used to estimate the likely uncertainties in the cross sections. The
absolute values of the cross sections were fixed mainly by reference to the experimental data of
Macpherson et al.13 which were quoted with errors of ± 5% which are included in these final
uncertainties The comparison between the calculated cross sections and the experimental values of
Oehlschlaeger et al.16 was used to test the cross section model at high temperatures and
demonstrated the need to include a vibrational background contribution to the values determined
from Models I and II. This vibrational background was insignificant at temperatures up to 900 K, the
range needed for the cross section corrections used in the redetermination of the rate coefficients
from Slagle et al.12
While Model II + vibrational background provided the best fit to the experimental high
temperature cross sections, the master equation fits to the rate data were somewhat better with
Model I for the low T correction. It is difficult, therefore, to distinguish between the results from
Models I and II. The most appropriate representation is the mean of the two giving
= 5.76 × 10⁻¹¹ (T/298 K)-0.34 cm3 molecule-1 s-1.
The most detailed predictive calculations of for CH3 + CH3 were performed by
32
corrected CASPT2/cc-pvdz potential energy surface. They applied a 15% reduction in the rate
coefficient to correct for local re-crossings of the transition state dividing surface, deduced from
dynamical calculations. They obtained = 1.57 × 10⁻⁹T-0.538 exp(-68 K/T). As shown in Fig. 6, this
expression shows a steeper temperature dependence than obtained from Model I, but is
comparable to the results from Model II. The agreement is good at 300 K and differs at 2000 K by
27% for Fit 5 and only 4% for Fit 6; the difference for the mean value expression quoted above is
16%. This is very satisfactory agreement given the long extrapolation in p and T involved. Fig. 6 also
shows the calculated results obtained by Klippenstein and Harding11 in an earlier analysis based on
an MRCI potential, without a dynamical correction. A further plot is shown of the data of Zheng et
al.61 who used density functional theory (M06-L), obtaining a stronger negative T dependence. Fig. 6
also shows the results from Hessler and Ogren,15 based on fitting experimental data to a number of
analytic representations of k(p,T). They recommended = 8.78 × 10⁻¹¹ exp(-T/723 K), which
shows a stronger negative temperature dependence than the present analysis. In a later paper,
Hessler63 showed that the data are compatible with a range of T dependences, including one close to
that found here, depending on the fitting method used.
Krasnoperov62 has recently determined for CH3 + CH3 using high pressure pulsed
photolysis, coupled with absorption spectroscopy. Their results are shown in Figure 6 and agree well
with those obtained here, lying close to the results from Model II.
Other analyses of experimental data and application of theoretical models to obtain
have recently been discussed by Pilling.64 Cobos and Troe65 used a simplified two parameter version
of the statistical adiabatic channel model, tuning one of the parameters to the then available
experimental data and obtaining � = 4.7 × 10⁻¹¹ cm3 molecule-1 s-1 and � = 5.4 ×
10-11 cm3 molecule-1 s-1. Wagner and Wardlaw66 used a microcanonical RRKM model, based on
flexible transition state theory, coupled with a weak collision, integral representation of fall-off, to fit
33
al.4 evaluated the available experimental data in 2005 recommending a temperature invariant high
pressure limit of 6.0 × 10⁻¹¹ cm3 molecule-1 s-1, but with an uncertainty of a factor of two. Wang et
al.54 calculated using flexible transition state theory, based on an ab intio potential, fitting
with a master equation model to available experimental data, including their own, to determine
energy transfer parameters. They calculated = 7.42 × 10⁻¹¹ (T/298 K)-0.69 exp(-88K/T) cm3
molecule-1 s-1.
5.2 Low pressure limit
The low pressure limiting rate coefficient, k0(T), was determined from the master equation, with the
best fit parameters for Fits 5 and 6, with Ar as bath gas, , by successively decreasing the bath gas
concentration until k(p,T) varied linearly with pressure at a given temperature. The resulting values
are given in the Supporting Information, together with the values recommended in the evaluation of
Baulch et al.4 which were determined using Troe fits6 to the then available data. The agreement is to
within a factor of ~8 at 300 K falling to 0.3 at 1500 K (this work:Baulch et al). The results from Fits 5
and 6 agree to within ~30% at 300 K, decreasing to within <10% at 1500 K. The best fit mean
parameterisation is k0(T) = 1.48 × 10
-22
(T/298)-10.04 × exp(-2209 K/T) cm6 molecule-2 s-1.
5.3 Energy transfer parameters. The energy transfer parameters in the low temperature regime
(<1000 K) are reasonably well defined for Ar and He. Jasper et al.58 recently calculated
from first principles using classical trajectories on potential energy surfaces obtained by
simple (tight binding + exp/6 attraction) representations that were thoroughly tested for CH4 + He,
Ne and H2 and C2H6 + He collisions against direct dynamics calculations. Their values for C2H6 / Ar
range from 185 cm-1 to 390 cm-1 over the temperature range 300 900 K, compared with the values
from the present analysis of 279 to 555 cm-1 (Model I, fit 4); the difference is ~40% throughout the
temperature range. The 1 experimental uncertainties in and m are 10% and 16%
respectively. The differences in the temperature dependence are somewhat larger for He, but the
34
experimental values from 103 387 cm-1 over the more restricted temperature range 300 700 K.
The experimental uncertainties in and m for He are 14% and 12% respectively.
The agreement for Ar at higher temperatures is less good. Extrapolating the energy transfer
parameters from Fit 4 to temperatures above 1000 K shows improved agreement with the values
obtained by Jasper et al.,67 with only a 20% difference at 2000 K. However, these values fit the data
of Oelschlaeger et al.19 poorly. Three approaches were applied. In the first, a three parameter fit was
used for as discussed in Section 4. This results in a maximum in at ~ 1300 K of
~600 cm-1, followed by a slow decrease to ~ 500 cm-1 at 2000 K; Jasper et al. obtained =
444 cm-1 at 1000 K and 789 cm-1 at 2000 K. Alternatively, as discussed in the Supporting
Information, we used separate fits for below and above 1000 K, constraining the ILT A and
n parameters to the same values across the temperature range. This resulted in high temperature
values for and m of 677 cm-1 and -0.09 respectively, for Tref = 1400 K ,corresponding to
values of of 686 cm-1 at 1200 K and 655 cm-1 at 2000 K respectively. Finally, attempts were
made to use a three parameter representation of (= A(T/300 K)nexp(-C/T)) which would
allow a more flexible representation of k(E). The ILT technique, as implemented in MESMER, does
not permit a negative activation energy which would require non-zero values of k(E) below the
dissociation threshold. Minimizing 2
forced C towards zero with no improvement in the fit over that
found with two parameters. A three parameter fit for or the use of different parameters
at high and low temperatures, were still necessary to obtain good fits across the whole temperature
range.
The Supporting Information provides data on the energy transfer parameters for Kr,
obtained from the experimental results of Yang et al.56 These were parameterised for a reference
temperature of 1500 K, in the middle of the experimental range. The values obtained were
= 331 cm-1 and m = 0.40, corresponding to values of 234 cm-1 at 630 K and
35
The experimental range covered in the present analysis of the Ar data is wider than has
previously been attempted in any direct fitting of a master equation model to experimental rate
measurements. It is interesting that it was not possible to obtain a unique set of energy transfer
parameters across the whole range. This issue may be related to the recent application of calculated
energy transfer parameters to master equation calculations of fall-off in association reactions by
Jasper et al.58 They found that it was necessary to employ a 2-D master equation to incorporate
collisional changes in both total energy and angular momentum in modelling the association
reactions CH3 + H and C2H3 + H. Agreement with experiment in their fully a priori model was much
improved when collisional changes in both E and J were allowed, compared with a 1-D model which
allows only changes in E. The range of J values at high T is larger than that at low T and the apparent
deficiencies in the use of a 1-D model may explain the difficulties we encountered in the
concomitant fitting of high and low temperature experimental data. It may also explain the
differences from the calculations of Jasper et al.. The MESMER code currently cannot incorporate
energy transfer parameters that depend on the total energy E. Such a facility is planned and will
permit use of energy transfer parameters derived from trajectory calculations in fitting or comparing
with experimental data.
5.4 Parameterisation of the rate coefficient in the fall-off region
Two methods were used to provide a parametric representation of the rate coefficient in the fall-off
region, by fitting the output of the master equation calculations. The first is based on Chebyshev
polynomials. Rate coefficients in Chebyshev form7 can be used in CHEMKIN68 and in CANTERA69
simulations. A spreadsheet is provided (Supporting Information II) to facilitate routine use of the
parameters to determine k(p,T). The second method used was that recently discussed by Troe and
Ushakov70 which uses a modified broadening term, suitable for dissociation and association
reactions. The forms of the parameterisations, together with the parameters, are given in the
36
Because of the large number of parameters used, the Chebyshev parameterization
reproduces the master equation more closely (within 1 2% across the fitted range), and can be
used as an accurate representation of the master equation output. The Troe fits are also very
satisfactory but, because they use fewer parameters, albeit based on a model derived from master
equation analyses, they show larger deviations (up to 30 40% at [M] = 1 × 10¹⁶ molecule cm-3 falling
to 2 6% at [M] = 1 × 10²⁰ molecule cm-3). The smaller number of parameters used in the Troe fits
facilitates their widespread use in data evaluations and compilations. A figure showing the fits is
included in Supporting Information I.
5.5 Breakdown of the local linearization of the rate equation at high [CH3]
The master equation methodology used to fit the experimental data relies on the local linearization
developed in Section 3. As discussed in that Section, because reaction 3 is reversible and both CH3
and C2H6 are recognised in the ME analysis, there are two chemically significant eigenvalues, 1 and
2; the former is zero and relates to mass balance. CH and the two rate
coefficients can be separated using the equilibrium constant.
There is a limitation imposed by the truncation of the Taylor series and it is that the
equation of motion is only valid for very short intervals of time. The Jacobian, and therefore
2,depend on the methyl concentration, which necessarily changes as the system evolves. Therefore
the expansion limited to linear terms will only be valid for that period of time for which the change
in methyl radical concentration is very small, and this time period will vary depending on where the
system is on the evolution trajectory. At the end of this period the Jacobian and therefore need to
be re-evaluated. As discussed above, the approach accounts for the reversibility of the process. The