This is a repository copy of Computational fluid dynamic modelling of the effect of ventilation mode and tracheal tube position on air flow in the large airways.
White Rose Research Online URL for this paper: http://eprints.whiterose.ac.uk/130153/
Version: Accepted Version Article:
Lumb, AB, Burns, AD orcid.org/0000-0002-3448-7510, Figueroa Rosette, JA et al. (3 more authors) (2015) Computational fluid dynamic modelling of the effect of ventilation mode and tracheal tube position on air flow in the large airways. Anaesthesia, 70 (5). pp. 577-584. ISSN 0003-2409
https://doi.org/10.1111/anae.13003
© 2015, Wiley. This is the peer reviewed version of the following article: Lumb, AB, Burns, AD , Figueroa Rosette, JA et al. (3 more authors) (2015) Computational fluid dynamic modelling of the effect of ventilation mode and tracheal tube position on air flow in the large airways. Anaesthesia, 70 (5). pp. 577-584, which has been published in final form at http://dx.doi.org/10.1111/anae.13003. This article may be used for non-commercial
purposes in accordance with Wiley Terms and Conditions for Use of Self-Archived Versions
[email protected] https://eprints.whiterose.ac.uk/ Reuse
Items deposited in White Rose Research Online are protected by copyright, with all rights reserved unless indicated otherwise. They may be downloaded and/or printed for private study, or other acts as permitted by national copyright laws. The publisher or other rights holders may allow further reproduction and re-use of the full text version. This is indicated by the licence information on the White Rose Research Online record for the item.
Takedown
If you consider content in White Rose Research Online to be in breach of UK law, please notify us by
Dr Andrew Lumb
Anaesthetic Department
St James’s University Hospital
Leeds
LS9 7TF
UK
Computational fluid dynamic modelling of the effect of ventilation mode and
tracheal tube position on air flow in the large airways
A. B. Lumb,1 A. D. Burns,2 J. A. Figueroa Rosette,3 K. B. Gradzik,4 D. B.
Ingham5 and M. Pourkashanian6
1 Honorary Senior Clinical Lecturer in Anaesthesia, School of Medicine, University of
Leeds, Leeds, UK
2 Senior Lecturer in Computational Fluid Dynamics, 3 PhD research student, 4
Graduate student, 5 Professor of Applied Mathematics, 6 Professor in High
Temperature Combustion Technology, Energy Technology and Innovation Initiative,
Faculty of Engineering, University of Leeds, Leeds, UK
Corresponding author: Dr A. Lumb
Email: [email protected]
Summary
We have used computational fluid dynamic modelling to study the effects of tracheal
tube size and position on regional gas flow in the large airways. Using a
three-dimensional mathematical model, we simulated flow with and without a tracheal
tube, replicating both physiological and artificial breathing. Ventilation through a
tracheal tube increased proportional flow to the left lung from 39.5% with no tube to
43.1-47.2%, depending on tube position. Ventilation mode and tube distance from
the carina had no effect on flow. Lateral displacement and deflection of the tube
increased ventilation to the ipsilateral lung, e.g. when deflected 10° to the left of
centre, flow to the left lung increased from 43.8% to 53.7%. Because of the small
diameter of a tracheal tube relative to the trachea, gas exits a tube at high velocity
such that regional ventilation may be affected by changes in the position and angle
of the tube.
Introduction
When using a tracheal tube (TT), the incidence of endobronchial intubation varies
from 5% in intensive care to 28% at cardiac arrests, and though this complication
may be regarded as innocuous, it is in fact associated with many adverse events [1].
Clinical detection of endobronchial intubation is difficult. Most of the tests used
depend on observation, palpation or auscultation of the chest, but combinations of
multiple tests are required to achieve reasonable sensitivity and specificity. A case
report of asynchronous ventilation of the right and left lungs during general
anaesthesia (GA) with a TT suggested that a Coanda effect can occur in the airway,
resulting in preferential ventilation of one lung [2].This suggestion that unequal
ventilation of the lungs may occur even when the TT is above the carina raises
interesting questions regarding regional ventilation during GA, and calls into question
the use of any test that relies on air movement into the lungs to detect endobronchial
intubation.
Measurement of flow to different regions of lung is difficult in-vivo. Functional
magnetic resonance imaging can generate detailed images of regional ventilation [3],
but cost and ethical constraints prevent this being easy to perform in an
anaesthetised and intubated patient. A technique for automatically recording breath
sounds from an array of 36 acoustic sensors under the patient, vibration response
imaging [4], has been used during anaesthesia, but resolution is low, the technique
being just able to differentiate between one- and two-lung ventilation. More recently,
a method of measuring regional ventilation using electrical impedance tomography
has been developed which has better spatial resolution, producing images with lung
regions of 2-5 cm in size [5]. Both techniques have been used in the clinical setting
now being used to guide ventilation in lung-injured patients [7]. The low spatial and
temporal resolutions of these methods make them inadequate for detailed study of
the influence of TT position on air flow. However, more significant barriers to
studying this problem are the practical and ethical challenges of placing and using a
TT in different positions, particularly because of the risks of endobronchial i ntubation.
To circumvent all these challenges we have used computational fluid dynamic
modelling of air flow to investigate regional lung ventilation with various TT positions
Methods
A three-dimensional mathematical model of a human airway was provided by
ANSYS UK (Milton Park, Abingdon, Oxon). The model was originally produced by
mesh generation algorithms that convert 3-D medical images into a geometric model
[8], a technique that has been subsequently developed into ‘virtual bronchoscopy'
[9]. A geometric model consists of a mesh, that is, a large but finite number of
polyhedra that represent the boundary and interior of the lung geometry, as
illustrated in Fig. 1. The model used for this study represents the airway from the
start of the trachea to 21 segmental bronchi.
The commercial computational fluid dynamic package ANSYS CFX was used
to compute the flow through the model using a variety of tube positions and flow
patterns. Computational fluid dynamic modelling solves the mathematical equations
describing fluid flow, based on conservation of mass, momentum and energy within
each of the finite polyhedra of the mesh. In order to model positioning of a TT at
different distances from the carina, it was necessary to modify the original geometry
of the model supplied by ANSYS UK. Such modifications were limited by the fact that
the software used to generate the original geometry is no longer available. The
objectives were achieved by using the currently available ANSYS ICEM mesh
generation software to truncate the geometry at desired distances from the carina.
Flow of air entering the airway from the TT was then approximated by a fixed
circular entry region located at the central position (see below) and as required for
different TT positions. Due to this approximation, we were not able to take into
account effects due to an angled bevel or a Murphy’s eye at the TT tip. Inlet velocity
described below. At a fixed volume flow rate, inlet velocity is inversely proportional to
the inlet area. The cross-sectional area of the trachea in the model is 6.40 cm2, while
the cross sectional areas of 8 mm and 7 mm internal diameter TTs are 0.50 cm2 and
0.38 cm2. Hence, in order to achieve the same volume flow rates, the air velocities
exiting a 8 mm and 7 mm TT are 13- and 17-times greater respectively, compared
with the trachea without a TT. Flow rates to the five main lobar bronchi were
calculated and presented as a percentage of the total flow.
Three ventilation modes were initially studied: spontaneous respiration with no
TT in place, and the inspiratory phase of artificial ventilation via a TT with either
constant-flow volume-controlled ventilation (VCV) or pressure-controlled ventilation
(PCV). The same respiratory parameters were used for all three: FiO2 0.21 in
nitrogen, respiratory rate of 12 breaths per minute, minute ventilation of 6 l.min-1, and
inspiration:expiration ratio of 1:2 with the expiratory phase equally divided between
expiration and an expiratory pause. These parameters produce a tidal volume of 500
ml and an inspiratory time of 1.67 s. For spontaneous respiration, the inspiratory
pattern was set to follow a sinusoidal shape which is similar to that seen in awake
subjects [10]. The peak inspiratory flow with these settings was 28 l.min-1. For VCV,
a constant inspiratory flow of 18 l.min-1 generated the required tidal volume. For
PCV, the inspiratory flow pattern was assumed to be an exponential decline from the
initial peak flow, with a time constant (tau) of 0.5 s based on normal values for a
supine anaesthetised paralysed patient (total resistance 1 kPa.l-1.s-1 × total dynamic
compliance 0.5 l.kPa-1) [11]. With these parameters, the initial inspiratory flow rate
was 60 l.min-1.
Flow patterns were first modelled with no TT in situ, with the spontaneous
approximate peak inspiratory flow). Volume-controlled ventilation and PCV patterns
were then modelled with the tip of a 8 mm TT in the centre of the trachea and 2 cm
proximal to the carina. As the inlet cross section of the trachea is not a perfect circle,
we calculated the centre as the geometric centroid of the inlet cross section.
Because we found no difference in flow distribution to different lung regions
between the sinusoidal spontaneous respiration pattern and steady inflow, for the
comparison of tracheal tube positions only steady inflow at 30 l.min-1 was used. This
approach meant that a shorter number of simulations were required. It was not
possible to obtain perfectly steady state outflows, even when using a constant flow at
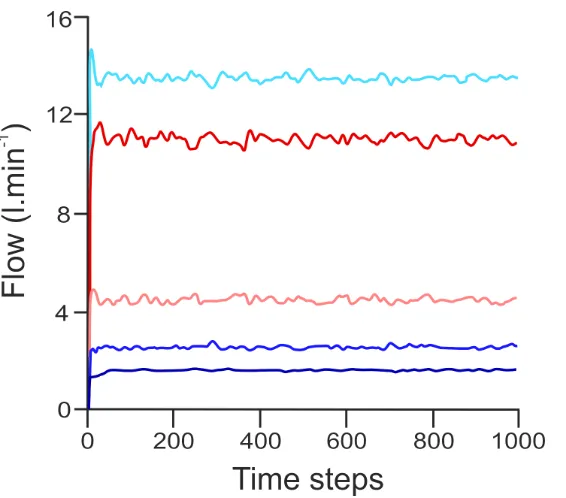
the inlet, due to small transient instabilities in the solution. The total flow rates out of
the five main outlet branches were monitored as a function of iteration number, and
the solution was assumed to have achieved a quasi-steady state when these
oscillated with small amplitude about fixed mean values. This is shown in Fig. 2,
which indicates that an initial transient settles quickly to a quasi-steady state.
Average values of outlet flow rates were computed from the variable values, starting
from time step number 300 which was sufficiently large for quasi-steady outlet flow
rates to be achieved.
We studied four different factors affecting flow from the TT:
1. TT size of either 8 or 7 mm internal diameter.
2. Longitudinal position of the tracheal tube: aligned along the central axis of
the trachea at 0.5 1, 2 and 4 cm proximal to the carina. The central position was
3. Lateral displacement from the central axis of the 8 mm TT to right or left by
5 mm or 7 mm.
4. Deflection of the TT from the central axis by 10° t o left, right, anterior and
posterior. This was modelled only for the 8 mm TT in the normal position 2 cm from
the carina in the centre of the trachea. The choice of 10° was based on an estimate
of the angle formed by the natural curvature of a TT with its cuff inflated inside the
Results
Ventilation through a TT increased flow to the left lung compared with no TT present,
mostly as a result of increased proportional flow to the left lower lobe, and this effect
appeared to be greater with a smaller TT (Table 1). Artificial ventilation mode and
distance from the carina of a centrally placed TT had little effect on proportional flows
to each of the five lung lobes (Table 1). Deflection of the TT away from the midline
by only 10° affected proportional flow to each lung, particularly when deflected to the
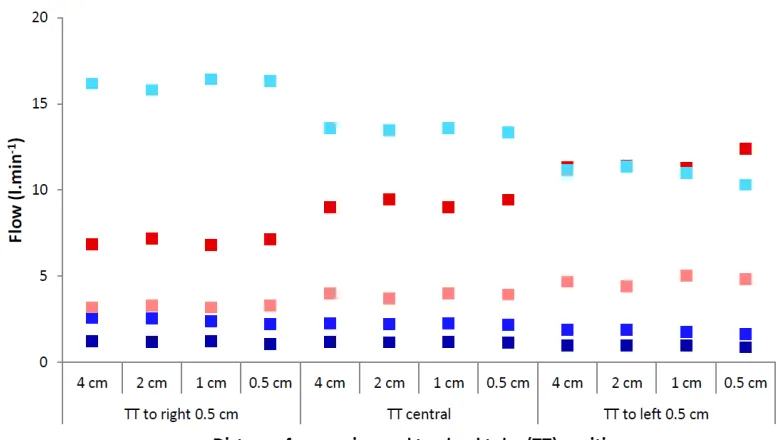
left or right rather than anterior or posterior (Table 1). Lateral displacement of the TT
increased proportional flow to the ipsilateral lung, also mostly due to increased flow
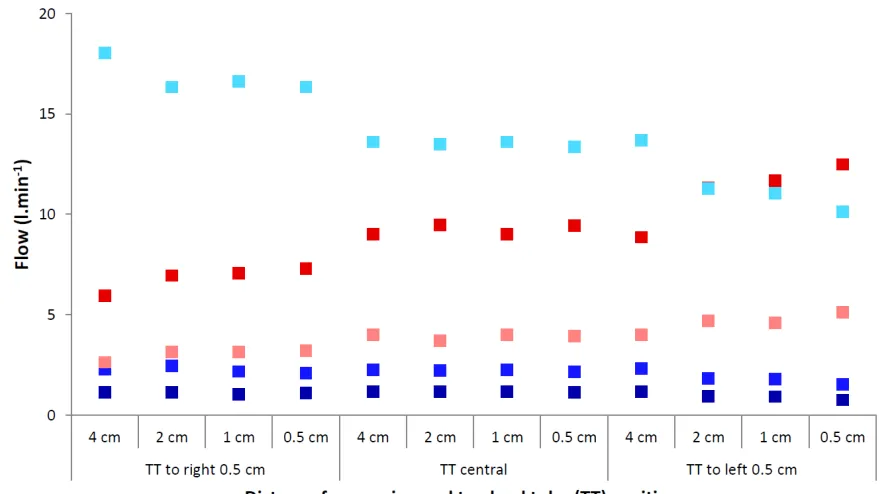
to the respective lower lobe. Increasing the displacement from the midline from 5
mm (Fig. 3) to 7 mm (Fig. 4) further increased the flow disparity between the two
Discussion
Our computational fluid dynamic model has provided novel data on the pattern of
airflow emerging from a TT, including being able to observe the effect of different
inspiratory airflow patterns and various tube sizes and positions. The model has
limitations that prevent its findings from being applied to in-vivo situations:
1. It is representative of only a single human airway, and the size and geometry of
the airway in the region of the carina is known to be variable. In the individual on
whom the model is based, the right lung architecture is slightly atypical with a large
lower lobe bronchus relative to the middle and upper lobes (see Fig. 1).
2. We have used assumed patterns for ventilatory flow rates to allow them to be
mathematically generated. Actual flow patterns in spontaneously breathing and
artificially ventilated patients will be variable, but the patterns and flow rates chosen
for our study represent a typical patient receiving standard care.
3. The tip of the tube used in our model is flat, i.e. has no bevel and no Murphy’s
eye. It is possible that the tube tip shape might alter the flow pattern of the gas
emerging from it, but considering the high velocity of gas exiting the tube we think
this is unlikely to be a significant factor.
4. We have assumed that the TT is straight for the last few centimetres before the
gas exits the tube and therefore that any secondary cross-flow currents induced as
gas flows through the TT bend in the oropharynx will have decayed sufficiently
quickly to be of minor significance by the time the gas exits the tube.
5. Our model does not take into account differences in regional lung compliance that
ventilation is usually greater in dependent lung regions and influenced by body
position, breath size, inspiratory flow rate and lung pathology [11]. However, in a
supine and healthy patient breathing normal tidal volumes, variation in regional
ventilation is small [12], and influenced more by gravity within each lobe rather than
by relative ventilation to the five lung lobes considered in this study. Thus, we believe
our results are applicable to healthy patients under general anaesthesia, but are
unlikely to be representative of regional ventilation in patients with lung diseases
which may increase ventilation heterogeneity at a lobar level, such as acute lung
injury or emphysema.
Validation of our computational fluid dynamic model in-vivo is not currently
possible. As already described, currently available techniques for assessing regional
lung ventilation in a patient whose trachea is intubated are limited, particularly at the
spatial resolution needed to determine flow to individual lung lobes. Furthermore,
controlling or ascertaining the position of a TT within the trachea is difficult - flexible
bronchoscopy may allow the distance from the carina to be measured, but
fluoroscopy in two planes or computerised tomography would be needed to
determine its 3D-position.
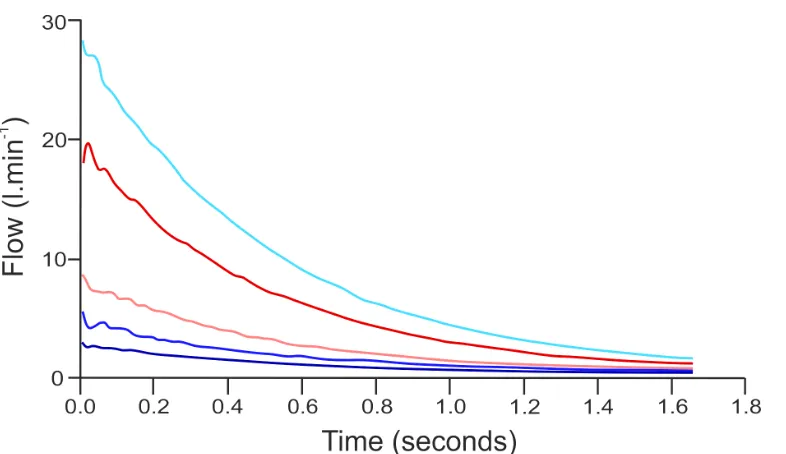
The lack of effect of ventilation mode was reassuring. Furthermore, Fig. 5
shows that, despite the different flow patterns, there was no obvious effect of time on
the relative flow to different lobes. After less than about 50ms, flow to the five lobes
is in an established pattern that remains the same until the end of expiration.
Physiological differences between these modes in-vivo are small, with no firm
agreement in the literature regarding which is the preferred technique in healthy
lungs. In injured lungs, pressure-controlled mechanical ventilation of the lungs is
barotrauma, rather than because of any known physiological benefit. Our data has
not been able to contribute to the volume- vs. pressure-controlled mechanical
ventilation debate.
Our data confirms what would be intuitively expected of flows through a TT.
Passing the same gas flow through an 8 mm TT compared with the trachea which
has a diameter of >2 cm inevitably results in a large increase in gas velocity.
Compared with when no TT is in place, this results in a high-velocity jet of gas exiting
the end of the TT. It is unsurprising that the position and direction of this jet can
influence where the gas is distributed. As the gas hits the carina or airway wall, the
laminar flow pattern is immediately disturbed, and gas swirls around in the large
airways before passing further down into the airway branches (Fig. 1). Despite this
abnormal flow pattern, the ultimate distribution of gas to the five lobes remains
similar to that seen with no TT in place, though there is a small but consistent
increase in ventilation of the left lung in all situations where a TT is present, which is
possibly more pronounced with a smaller TT. This observation holds true irrespective
of how far a centrally-placed TT is from the carina. The same cannot be said for TT
positions away from the centre, with flow distribution being preferentially distributed
to the ipsilateral lung. For tubes at the left side of the airway, closer proximity to the
carina seems to result in a greater degree of unilateral ventilation, particularly with
the 7 mm displacement. The flow pattern in this situation is chaotic, with the gas
which eventually ends up on the right side taking a circuitous route via the left main
bronchus and trachea. Similar flow patterns are seen with angular deflection of the
TT. As may be expected, anterior or posterior deflection results in similar distribution
to the left and right lungs as via a TT in other situations. However, angulation to
similar to those seen with TT displacement. In summary, the high velocity jet of gas
leaving the TT means that the direction in which the TT is pointing in the airway
becomes crucial, and any position other than in the centre of, and aligned
longitudinally with, the trachea will cause gas distribution between right and left lungs
to be abnormal.
Our results indicate that the position of the TT in the trachea may affect
regional distribution of ventilation. Pulmonary ventilation-perfusion relationships are
known to be abnormal during general anaesthesia, with an increase in areas with
both high and low ratios contributing to impaired pulmonary exchange of both
oxygen and carbon dioxide [11]. Our results offer a new potential mechanism for the
abnormal ventilation distribution seen with artificial ventilation. Furthermore, the
influence of tube position on ventilation-perfusion relationships may also, at least in
part, explain why the effects of mechanical ventilation of the lungs on gas exchange
in patients is so variable [13]. In patients with more abnormal ventilation-perfusion
relationships, such as those with lung disease or obesity, the small variations in
regional ventilation suggested by our study could be crucial to maintaining
acceptable gas exchange.
Our data also has implications for TT design. The larger the TT diameter, the
less pronounced will be the increased velocity of gas flow within, so larger TTs
should provide more uniform ventilation, but their use has implications for ease of
tracheal intubation and trauma to the airway. In theory, the best way to reduce gas
velocity in a tube is a gradual (rather than step) increase in tube diameter such as an
expanding funnel shape like the bell on a trumpet. This is unlikely to ever be feasible
without a complex mechanical system for changing the TT shape once it is beyond
the vocal cords.
In clinical anaesthesia, the only aspect of TT position that has received
attention is its distance from the carina. In 1963, Bamforth wrote that a TT should not
be passed more than 3 cm beyond the vocal cords to avoid endobronchial intubation
[14]. Subsequent work has recommended that the TT tip should be 4 cm from the
carina, but also noted that the tips of 58% of TTs placed for routine surgery were
actually less than 3 cm from the carina [15]. Another study, this time in critically ill
patients requiring mechanical ventilation of the lungs, showed a mean (SD) distance
from the TT tip to the carina of 3.3 (1.6) cm [16]. It is also known that TT position is
not constant, with neck flexion and extension moving the tip by 2 cm in either
direction [17]. Thus, it is likely that the TT positions used in our study all occur
commonly during clinical practice in both anaesthesia and critical care. It is therefore
mildly reassuring that the distance of the tube from the carina appears have only a
small influence on regional ventilation, provided it is still central within the trachea
and not in either main bronchus. It is, however, a concern that no clinical studies
have ever considered whether the TT tip is centrally placed in the trachea, which we
have found to be an important factor. When inflated outside the body, many TT tube
cuffs inflate eccentrically, so it is likely that the TT tube will often be pushed against
one side of the trachea, in a random fashion, and that this may adversely affect
regional ventilation.
Our model, despite having limitations, has allowed us to obtain novel and
potentially clinically important information on how regional ventilation is influenced by
the TT position within the trachea. Further studies of TT behaviour using
made to behave more physiologically, and so hopefully improve a piece of
anaesthetic equipment that has remained essentially unchanged and rarely
investigated for almost 100 years.
Acknowledgements
References
1. O’Connor CJ. Avoidance of endobronchial intubation. Measuring the depth of
endotracheal tube insertion is simple and effective. British Medical Journal
2010; 341: 1111-2.
2. Qudaisat IY. Coanda effect as an explanation for unequal ventilation of the
lungs in an intubated patient? British Journal of Anaesthesia 2008; 100:
859-60.
3. Hopkins SR, Levin DL, Emami K, et al. Advances in magnetic resonance
imaging of lung physiology. Journal of Applied Physiology 2007; 102: 1244–54.
4. Jean S, Cinel I, Gratzy I, et al. Image-based monitoring of one-lung ventilation.
European Journal of Anaesthesiology 2008; 25: 995–1001.
5. Leonhardt S, Lachmann B. Electrical impedance tomography: the holygrail of
ventilation and perfusion monitoring? Intensive Care Medicine 2012; 38:1917–
29.
6. Steinmann D, Engehausen M, Stiller B, Guttmann J. Electrical impedance
tomography for verification of correct endotracheal tube placement in paediatric
patients: a feasibility study. Acta Anaesthesiologica Scandanavica 2013; 57:
881–7.
7. Mauri T, Bellani G, Confalonieri A, et al. Topographic distribution of tidal
ventilation in acute respiratory distress syndrome: effects of positive
end-expiratory pressure and pressure support. Critical Care Medicine 2013;
41:1664–73.
8. Ley S, Mayer D, Brook BS, et al. Radiological imaging as the basis for a
simulation software of ventilation in the tracheo-bronchial tree. European
9. Mayer D, Bartz D, Fischer J, et al. Hybrid segmentation and virtual
bronchoscopy based on CT images. Academic Radiology 2004; 11: 551–65.
10. D’Angelo E, Calderini E, Wolfler A, Pecchiari M. Factors influencing the shape
of the inspiratory flow. Respiration Physiology 2001; 126: 211–9.
11. Lumb AB: Nunn's applied respiratory physiology, 7th edn. Edinburgh, Elsevier,
2010.
12. Sá RC, Cronin MV, Henderson AC, et al. Vertical distribution of specific
ventilation in normal supine humans measured by oxygen-enhanced proton
MRI. Journal of Applied Physiology 2010; 109: 1950–9.
13. Hedenstierna G. Contribution of the multiple inert gas elimination technique to
pulmonary medicine 6: Ventilation-perfusion relationships during anaesthesia.
Thorax 1995; 50: 85-91.
14. Bamforth BJ. Complications during endotracheal anesthesia. Anesthesia and
Analgesia 1963: 42: 727-32.
15. Evron S, Weisenberg M, Harow E, et al. Proper insertion depth of endotracheal
tubes in adults by topographic landmarks measurements. Journal of Clinical
Anesthesia 2007; 19: 15–9.
16. Locker GJ, Staudinger T, Knapp S, et al. Assessment of the proper depth of
endotracheal tube placement with the trachlight. Journal of Clinical Anesthesia
1998; 10: 389–93.
17. Conrardy PA, Goodman LR, Lainge F, Singer MM. Alteration of endotracheal
tube position. Flexion and extension of the neck. Critical Care Medicine 1976;
Tables
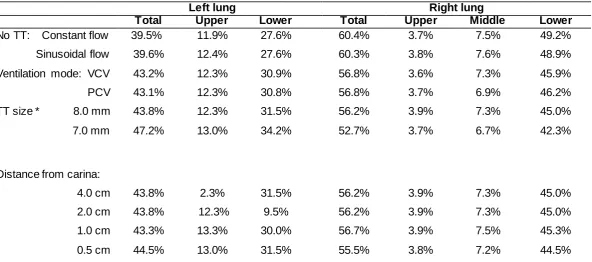
Table 1 Effect of inspiratory flow pattern and tracheal tube (TT) position on distribution of gas to the left and right lungs and their lobes, for sinusoidal flow (simulating spontaneous breathing), volume-controlled mechanical ventilation (VCV) and pressure-controlled mechanical ventilation (PCV). Values are proportion of total flow.
Left lung Right lung
Total Upper Lower Total Upper Middle Lower
No TT: Constant flow
Sinusoidal flow 39.5% 39.6% 11.9% 12.4% 27.6% 27.6% 60.4% 60.3% 3.7% 3.8% 7.5% 7.6% 49.2% 48.9%
Ventilation mode: VCV
PCV 43.2% 43.1% 12.3% 12.3% 30.9% 30.8% 56.8% 56.8% 3.6% 3.7% 7.3% 6.9% 45.9% 46.2%
TT size * 8.0 mm
7.0 mm 43.8% 47.2% 12.3% 13.0% 31.5% 34.2% 56.2% 52.7% 3.9% 3.7% 7.3% 6.7% 45.0% 42.3%
Distance from carina:
Deflection 10°* Right Left Anterior Posterior 35.4% 53.7% 44.9% 41.5% 10.6% 14.8% 13.0% 12.3% 24.8% 38.9% 31.9% 29.2% 64.4% 45.5% 55.0% 58.5% 4.0% 3.2% 3.3% 4.0% 8.5% 6.2% 7.4% 7.4% 51.9% 36.1% 44.3% 47.1%
Figures
Figure 2 Flow rate of gas to five lobes of the lungs with a constant flow of 30 l.min-1
through an 8 mm tracheal tube placed in the midline.
Left lower lobe ; left upper lobe ; right lower lobe ;
Figure 3 Flow rate of gas to five lobes of the lung with an 8 mm tracheal tube placed 5 mm away from the midline and at four distances from the carina (constant total flow of 30 l.min-1).
Left lower lobe ; left upper lobe ; right lower lobe ; right middle lobe ;
Figure 4 Flow rate of gas to five lobes of the lung with an 8 mm tracheal tube placed 7 mm away from the midline and at four distances from the carina (constant total flow of 30 l.min-1).
Left lower lobe ; left upper lobe ; right lower lobe ; right middle lobe ;
A
B
Figure 5 Flow rate to five lobes of the lung relative to time with the three different ventilation modes studied; in each case, tidal volume and total flow rate are as described in the text and the models used an 8mm TT in the centre of the trachea 2cm proximal to the carina:
Panel A. Sinusoidal (normal) ventilation
Panel B. Volume controlled (constant flow) mechanical ventilation
Panel C. Pressure controlled mechanical ventilation.
Left lower lobe ; left upper lobe ; right lower lobe ;