Abstract—Philippines experience frequent flash flooding, usually with insufficient lead time which causes panic and fear to the people. In spite of decades of effort by the government and the private sectors to improve observations and warning, flash floods continue to be one of nature’s worst killers. On the average, there is at least one disastrous flood every four (4) years in the Philippines [1]. This paper proposed to develop a technology on Flash Flood Warning System Using SMS with advanced warning information based on prediction algorithm devised by the researcher regarding increasing water level and water speed. These two factors were considered as triggers to the flashflood, thus become components of the regression algorithm devised by the researchers. Based on the training data captured for seven days, the regression equation was developed while the actual/real time data were input to the regression model. Prediction of the current and forthcoming risk on flood is computed by the system based on the model and is sent through SMS to registered users for early warning purposes.
Index Terms— Flash Flood, Prediction Algorithm, Multiple Regression Analysis, Data Mining, Decision Support System
I. INTRODUCTION
R
ecent devastating floods around the world have spawned a large number of researches aimed at the development of stronger and "smarter" flood protection systems [4]. Modern technologies enabled non-stop monitoring with the use of remote sensing technology, satellite imaging, fiber-optics and electronic sensors installed in the dikes or bridges.The Philippines experiences frequent flash flooding, usually with insufficient lead time which causes panic and fear to the people. In spite of decades of effort by the government and the private sectors to improve observations
Manuscript received August 16, 2013.
Prof. Joel T. Decastro, is the Director of the Institute of Information and Communications Technology, West Visayas State University, Lapaz, Iloilo City, Philippines.
Prof. Gabriel M. Salistre, Jr., is a Faculty Member, College of Engineering, Western Visayas College of Science and Technology, Lapaz, Iloilo City, Philippines.
Prof. Yeong-Cheol Byun, is a Faculty of Telecommunications and Computer Engineering, Cheju National University, Jeju, Korea
Prof. Bobby D. Gerardo, Ph.D. is an IAENG Member and currently a Full-Fledged Professor at Institute of Information and Communications Technology, West Visayas State University, Iloilo City, Philippines.
and warning, flash floods continue to be one of nature’s worst killers. According to PAGASA [5], on the average there is at least one disastrous flood every four (4) years in the Philippines.
As flooding continues to affect a greater portion of the growing population in Iloilo, communities with persistent flood problems or with risk of great losses when flooding does occur, are continually seeking methods to diminish flood losses. Flood warning systems is an attractive solution because of their low cost of operation and because they can enhance the operation of other flood mitigation methods such as reservoir floodgate operation, flood proofing, flood insurance and flood plain zoning.
Despite the government and local agencies working out and giving people warning of incoming calamities, they lack the technology to give the public accurate information about their occurrence, especially the flood.
The government and local agencies had been known to monitor the water level manually by putting measurements in certain areas under the bridge to determine the volume of water. From time to time, a representative has to go to these danger zones to check any changes in the water level. Delays in broadcasting may result to human errors in the analysis and forecast which sometimes caused alarm. These manual staff gages and flood markers used to measure the water level, which were painted on bridge’s pier, walls and posts lack durability since they will usually fade in a short span of time.
On the other hand, ultrasonic sensors are non-contacting, thus, they are not affected by dirty water, falling debris or aquatic wildlife. They are also not affected by fluctuating water temperatures and by high flow rates. Ultrasonic sensors are also easy to calibrate, can withstand freezing temperatures, requires only low maintenance and has long-term reliability [6].
The current flash flood monitoring systems were prone to issues of maintainability, data accuracy and delay of warning information. Thus, the researcher came up with an advance flash flood warning system using SMS technology.
The flood warning system technology developed in this study included a remote monitoring device with software and hardware components designed to monitor the level and velocity of water/flooding using an ultrasonic sensor, pulse detector, microcontroller board, personal computer server, and Short Message Service (SMS) in the text communication service of cell phones, web or mobile communication systems with standardized
Flash Flood Prediction Model based on Multiple
Regression Analysis for Decision Support
System
communications through SMS information where news can be disseminated in just few seconds.
II. RELATEDSYSTEMS
GSM Based Remote Terminal Unit of the Flash Flood Warning and Control System was designed to give early flood warning where the water level of a certain place was monitored remotely. The water level data was then sent to the flood monitoring station via SMS. At the monitoring station, the warning was given once the water level has achieved different level.
The Controller board performed the function of sending ASCll words to Modem, replying to the modem and performing loop operation to continuously check the water level. The System Sensor board was responsible to amplify to the signals from the water sensor and amplify them to 5V. GSM Modem was connected to PC to interface with different software such as HyperTerminal, Bus Hound and others. AT+CMEE command was used to change the error messages display mode. Whenever the water level reaches a level, it triggered the sensor and the signal was amplified at the amplifier system. Microcontroller responding to the signal sent the info to MAX-232 IC to amplify the data and thus sent it to the transmitter. Whatever was received at the other end was then monitored by the GUI [11].
In a study of Sedigh, et al. on a low-cost wireless system for autonomous generation of road safety alerts, describes an autonomous wireless system that generates road safety alerts, in the form of SMS and email messages, and sent them to motorists subscribed to the service. Drivers who regularly traverse a particular route are the main beneficiaries of the proposed system, which was intended for sparsely populated rural areas, where information available to drivers about road safety, especially bridge conditions, was very limited. At the heart of this system was the SmartBrick, a wireless system for remote structural health monitoring. Sensors on the SmartBrick network regularly collected data on water level, temperature, strain, and other parameters important to safety of a bridge. The system generated alerts indicating hazardous road conditions when the data exceeded thresholds that can be remotely changed.
Flood Early Warning System developed at Garang River Semarang used Information Technology base on SMS and Web. A flood early warning system made from an automatic rainfall recorder (ARR) was placed in upstream of Garang River. An automatic water level recorder (AWLR) placed in Simongan were to receive rainfall and identify water level data via a computer as server was placed in Semarang government office. Their functions are for sending flood status for preparation, and caution to flood attendants, and stake holders. Artificial neural network (ANN) was used to predict water level in Garang River where the input are
rainfall in upstream river for 1, 2, 3, 4 or 5 days before the occasion and the water level in the downstream for 3 hours before the occasion. The output is water level in downstream of Garang River for next 2 hours. This system integrated with information technology that was SMS (Short Message Services) and Web may cause the flood early warning to be accessed anywhere as long as communication network is available. The result showed time for sending data of rainfall and water level in telemetry system was less than 10 minutes, while information system built to give flood early warning information was also less than 10 minutes. Consequently, the information was relayed faster thereby acquiring more time in preparation of at least two hours before the flood happens [10].
A Microcontroller-based Intelligent System for Real-time Flood Alerting was done through the development of an efficient hydrologic monitoring system required the use of an automated data acquisition system, the analysis of several parameters that were monitored (water level, water flow, rainfall fell etc.), and a real-time alerting system in case of flood production.
Hydrologic Monitoring was very important in flood prevention, in the last years, different modern techniques were applied for flood forecasting, including some artificial intelligence based approaches, such as expert systems, artificial neural networks, intelligent agents and multi-agent systems. As most of the hydrological processes required real time monitoring and online alerting, a microcontroller-based intelligent system was developed that can be connected to various sensors and measuring devices for hydrological parameters measurements, and can transmit online hydrological alert codes to the decision making factor.
On the other hand, paper of Gwimbi presented the effectiveness of an early warning system for the reduction of flood disasters which could be beamed from some experiences from cyclones induced floods in Zimbabwe. The aim of any early warning systems is to provide warning to people of an impending natural hazard so that those vulnerable are aware of the potential impact of the natural processes in order to respond appropriately and minimize damage. Documenting the experiences of the local communities, the Civil Protection Unit responsible for managing disasters, the meteorological services department responsible for weather forecasts, nongovernmental organizations operating in the area and local authorities, the study provided an important insight for future non- structural flood mitigation strategies. The current early warning communication was a one-way process, with those issuing warnings not fully aware of the needs and priorities of vulnerable communities, and therefore not responsive to their needs. Warning information was poorly disseminated to poor communities with limited capacity to respond.
Using a wireless sensor network for weather and disaster warning was described by Yawut [11] on paper about system that uses wireless sensor network based on the Zigbee/IEEE802.15.4 standard which sends weather information such as temperature, humidity and pressure to a remote server by an XBee module. Some papers implemented a wireless data acquisition network to collect climate data and soil moisture for a smart irrigation system This paper developed a mechanism on flash flood
in Portugal in order to improve irrigation efficiency. Several SPWAS (Solar Powered Wireless data-Acquisition Stations) have been deployed for the measurement of soil moisture data and to send it to a control center.
A flood early warning system, based on SMS and web, was proposed by [10]. To record rainfall and water level data, an automatic rainfall recorder was placed in an upstream location on the river, while a water level recorder was placed in a downstream location. A receiving server was located in the government office to receive rainfall and water level data and hence to predict a flood. The system then sends flood status information to attendants and stakeholders via SMS.
In recent years, the nature of the mobile communications market witnessed a major change whereby the need for new resource demanding data services has drastically increased. In order to meet the quality of service requirements of emerging data services and to efficiently exploit the available scarce radio resources in wireless networks, there is a need to develop advanced multiuser scheduling algorithms. The problem of multiuser scheduling has been addressed by many research publications which sought to develop algorithms customized to a wide range of wireless network scenarios [1] [2] [3] [7].
Ultrasonic sensors actively transmit acoustic waves and receive them later. This is done by ultrasonic transducers, which transform an electrical signal into an ultrasonic wave and vice versa. Often it is possible to use the same transducer for both transmitting and receiving. On its path from the transmitter to the receiver, the wave becomes modified by the situation under investigation. The ultrasound signal carries the information about the variables to be measured. The task for the ultrasonic sensors is not merely to detect ultrasound. As intelligent sensors they have to extract the information carried by the ultrasonic signals efficiently and with high accuracy.
To achieve this performance, the signals are processed, demodulated and evaluated by dedicated hardware. Algorithms based on models for the ultrasonic signal propagation and the interaction between the physical or chemical variables of interest are employed [6]. Distance sensors based on ultrasonic principles use the travel time and amplitude of the received signal to derive the presence, distance, and type of a sound reflecting object.
For ultrasonic propagation sensors, the effect of the tested variables on the transmission is evaluated. Here, the parameters that are affected are the speed of propagation, local changes of propagation (diffraction and refraction), directional and frequency dependency (anisotropy and dispersion), propagation attenuation, acoustic impedance, scattering and wave guiding coefficients.
This activity involves the actual installation of river gages, rain gages and flood markers and the communication system, including back-up communications.
The type of monitoring system, whether automatic, manual or combination of both, and the number of station sites are basically determined on the watershed’s physical configuration. However, the type and the number of sites are primarily subjected, based on the budgetary limitation, on the community’s capability to operate and ability to
sustain the system. The type of system and its quantity is also dependent on the need for accuracy, dependability and timeliness of data and information. The more sophisticated and high-ended the system configuration is, the more resources, time and money, are required.
In the Philippines, such as in the Binahaan River local flood warning system in the Leyte Island, warning levels are connected to certain conditions, for example, storm warning signal associated with an approaching tropical cyclone, river stage at a certain forecasting point or an observed rainfall value at an upstream station accumulated for a certain period of time.
Another example, as in the Hermosa-Dinalupihan local flood warning system in the province of Bataan in Philippines, the rate of rise from a predetermined river level to the succeeding predetermined level in a certain period of time is one criteria for activating the pre- disaster actions in a community [5]. River assessment levels and rainfall threshold values should be treated as subjective and temporary at the start of operations. Values should be adjusted accordingly based on actual event observations and as more data and information comes in. However, there were fewer attempts as discussed in [5, 8, 11] in the use of decision support to forecast possible flashflood, thus this paper pursues this specific goal to come up with a prediction model to anticipate the said risk.
III. ARCHITECTURALDESIGNANDPROPOSED MECHANISM
[image:3.595.307.545.495.623.2]Figure 1 show the Over-all architecture of the Flood Warning System, which is composed of the server and the remote devices. Along withg ths is the use of the SMS system for data communications.
Fig. 1. Over-all architecture of the Flood Warning System
Fig. 2. Architectural design of the prediction system
IV. EXPERIMENTALRESULTS
This chapter presents the findings of this study. It aimed to design and develop a “Flood Prediction and Early Warning Mechanism to Decision Support System”. It also aimed at determining the social acceptability of the Flood Prediction and Early Warning Mechanism for Decision Support System as to design, fabrication and over-all operating performance in terms of functionality, reliability, efficiency, usability and maintainability.
Figure 3 shows the complete set-up of the SMS-Based Flash Flood Warning System during the simulation of the system.
Figure 3: Apps for SMS-Based Flash Flood Warning System
Its two main components are the remote monitoring device and the server. The monitoring device is composed of a platform (12 x 8 inches), the pipe which is about 4 ft. in height and the blade at the bottom of the device. The platform at the top holds the main parts of the device
namely: ultrasonic sensor for water level sensing, pulse detector for determining the water velocity, a wireless modem to communicate to the server, a FEZ Domino board where the program was being stored and a 6-volts battery charged by a solar panel that supplies power to the wireless modem and the FEZ Domino.
The server application and the modem which received the readings and send the necessary warning messages to the list of subscribers were also simulated.
The water level was monitored based on various conditions or states set by the researcher. Each state has a range of water level values which are configurable. This is because the range for each water level states is relative to the location of the area to be monitored. This range can only be determined by geologists who have the necessary knowledge on this field.
The water velocity determined the estimated number of hours for the possible flash flood to occur. It is based on the various set of conditions as well. The range of values for interpreting the estimated time for the flash flood to occur based from the water velocity value are also configurable.
The water level and water velocity values sent by the monitoring device to the main application are reflected on the left side of the console. For every reading, the differential from the previous reading is automatically computed and displayed in the console.
One of the concerns of the system is when the messages pile up and the SIM card used for both the modem in the server and in the monitoring device gets full. To address this issue, the Clear Counter function was created. This function allows the user to delete all messages from the SIM card used by the server and the monitoring device.
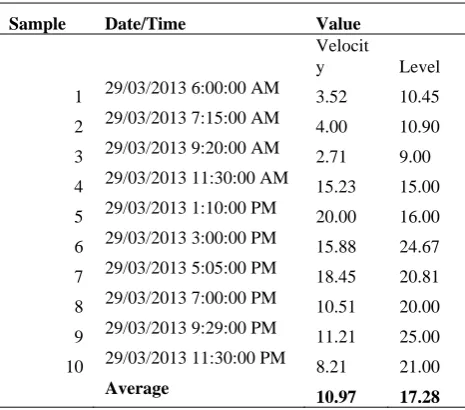
[image:4.595.46.291.485.668.2]Table 1 shows part of the seven days trials for the water level and velocity. Relative to this are the corresponding averages per day on the two measurements. This will be utilized as input to the training model of the prediction equation as explained in this section. While Table 2 shows the over-all summary for the 7 days trial.
Table 1. Sample for Water Level and Velocity (Trial 1)
Sample Date/Time Value
Velocit
y Level
1 29/03/2013 6:00:00 AM 3.52 10.45
2 29/03/2013 7:15:00 AM 4.00 10.90
3 29/03/2013 9:20:00 AM 2.71 9.00
4 29/03/2013 11:30:00 AM 15.23 15.00
5 29/03/2013 1:10:00 PM 20.00 16.00
6 29/03/2013 3:00:00 PM 15.88 24.67
7 29/03/2013 5:05:00 PM 18.45 20.81
8 29/03/2013 7:00:00 PM 10.51 20.00
9 29/03/2013 9:29:00 PM 11.21 25.00
10 29/03/2013 11:30:00 PM 8.21 21.00
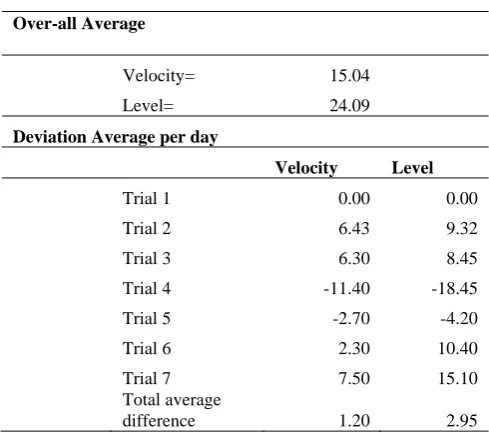
[image:4.595.305.538.562.767.2]Table 2. Over-all Summary of Seven Days trial for the Water Level and Velocity
Over-all Average
Velocity= 15.04
Level= 24.09
Deviation Average per day
Velocity Level
Trial 1 0.00 0.00
Trial 2 6.43 9.32
Trial 3 6.30 8.45
Trial 4 -11.40 -18.45
Trial 5 -2.70 -4.20
Trial 6 2.30 10.40
Trial 7 7.50 15.10
Total average
difference 1.20 2.95
Table 2 shows the total summary of the seven days trial. The same table indicated the average per day deviation or difference in readings. This is essential to the factors for the prediction model. The same will be used to compute for the regression equation to predict forthcoming risk.
Prediction model based on Regression Equation
The Prediction Model using the training data for 7 trials will be the input to the equation given in (1).
Y=aX+b (1)
Y=a+b1X1+b2x2 (2)
Equation (1) is a regression equation for the water level risk. The variable Y is a predicted model, while a is the dependent variable coefficient and b1 and b2 are the model factors computed based on the input values. While x1 is the water velocity and x2 is the water level.
This will forecast the probability of an imminent risk in the rise of water level. With the input training data for seven days, the following model was computed:
Computation of Sample predicted risk
First of all, the Deviation Interval is computed and is given by the equation, (i) = (Higest-Lowest)/3.
Example 1:
Based on Table 2, the highest deviation for water level is 15.1 and the lowest is 0. So, the interval is computed as
i = (15.1-0)/3 = 5.033 For the Water Velocity
i = (7.5-0)/3 = 2.50
Therefore the following Level of risks is computed: Level of Risk (Velocity and Water Level)
Combined Risk Value (based on deviation values)
Low < 1.091
Average 1.092 14.005
High 14.006 24.733
Prediction Model
The prediction model for one dependent and two independent variables is presented in equation 4.
Y = a + b1X1+b2X2+…+bnXn (4)
Y = 0.74 + 0.23X1 + 0.26X2
To compute for a and b for one variable, equations 4a and 4b could be utilized.
X
b
-Y
a
(4a)
2
x xy
b (4b)
While for b1 and b2, the following equations are used:
2
2 1 2
2 2 1
2 2 1 1
2 2 1
) ( ) )( (
) )(
( ) )(
(
x x x
x
y x x x y
x x
b (4c)
2
2 1 2
2 2 1
1 2 1 2
2 1 2
) ( ) )( (
) )( (
) )(
(
x x x
x
y x x x y x x
b (4d)
In this case, b1 and b2 are the forecasted values for the water level and velocity, respectively. These are demonstrated in equations 4c and 4d.
Once the values for a, b1 and b2 are computed, these coefficients are entered into the multiple regression equation, which will result to the final model for predicting the water level, velocity and the relative risk.
[image:5.595.312.538.532.613.2]usually this varies based on the typology or geographic properties of the area. For the two independent variables, the coefficients are computed as follows:
b1 = 0.23
b2 = 0.26
Equation 5 is used to computed for the coefficient a.
2 2 1 1X -b X b
-Y
a (5)
a = 0.74
Thus, the prediction model based on the coefficient computed is given by:
Y = 0.74 + 0.23X1 + 0.26X2
Example of Prediction of level and velocity
Based on the current readings, let the values for be, Velocity=15 and the water Level=38, so the predicted risk is computed as:
Y=0.74+0.23(15)-0.26(38) Y=15.01
This result implies that there is a average risk of flash flood based on the computed predicted risk of Y= 15.01. This computed value and the descriptive meaning are then forwarded to the cellular phones of clients/user registered in the system with notification of imminent risk of flash flood.
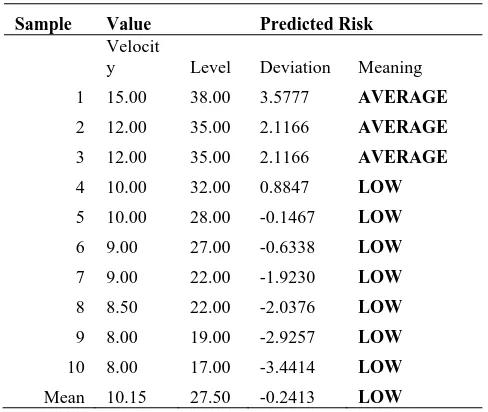
[image:6.595.44.288.510.716.2]The data below shows the current velocity and level values and its predicted risk based on the regression model.
Table 3. Actual Readings (Day 3) Sample Value Predicted Risk
Velocit
y Level Deviation Meaning
1 15.00 38.00 3.5777 AVERAGE 2 12.00 35.00 2.1166 AVERAGE 3 12.00 35.00 2.1166 AVERAGE 4 10.00 32.00 0.8847 LOW 5 10.00 28.00 -0.1467 LOW 6 9.00 27.00 -0.6338 LOW 7 9.00 22.00 -1.9230 LOW 8 8.50 22.00 -2.0376 LOW 9 8.00 19.00 -2.9257 LOW 10 8.00 17.00 -3.4414 LOW Mean 10.15 27.50 -0.2413 LOW
These results could be used by the client/user/decision maker in signaling water alarm based on the weekly and daily average computed risk. This system is essential for early warning because the outright readings from velocity and water level sensors are immediately translated into
predicted risk, thus likelihood of the flash flood is anticipated in advanced.
The warning information containing the current water level and water speed values are sent to the mobile phone numbers of the subscribers through SMS.
V. CONCLUSIONANDRECOMMENDATIONS This paper developed an advanced warning system based on prediction algorithm which was devised by the researcher relative to the increasing water level and speed. These two factors were considered as triggers to the flashflood, thus become components of the prediction model based on multiple regression function. Based on the training data captured for seven days, the regression equation was developed while the actual/real time data were input to the regression model. The prediction model was computed with the assumption that water speed has high contributory factor for flashflood. This model is then used to forecast likelihood of flashflood using the readings on current data. A warning mechanism is triggered and is sent through SMS once a threshold is achieved. This is incorporated in the algorithm devised by researcher which is then incorporated in the overall system.
REFERENCES
[1] Alpcan T, FanX, Bas-ar T., Arcak M,Wen JT.Power control for multi cell CDMA Wireless networks: a team optimization approach. Wireless Networks 2008; 14(5):647–57.
[2] Bender P, Black P, Grob M, Padovani R, Sindhushayana N, Viterbi A. CDMA/HDR: a bandwidth-efficient high-speed wireless data service for nomadicusers. IEEE Communications Magazine 2000; 38(7):70–7.
[3] Berardinelli RL, FrattasiG, Mogensen PS. Channel-aware scheduling algorithms for SC-FDMA in LTE uplink. In:
Proceedings of the international symposium on personal, indoor and mobile radio communications (PIMRC), September 2008.
[4] Krzhizhanovskayaa,V.V, G.S. Shirshova,b, N.B. Melnikovaa,b,g, R.G. Bellemana,F.I. Rusadia, B.J. Broekhuijsenc, B.P. Gouldbyd, J. Lhommed, B. Balise, M. Bubake, A.L. Pyayta,f, I.I. Mokhovf, A.V. Ozhiginf, B. Langf, R.J. Meijera (2011) Flood early warning system: design, implementation, International Conference on Computational Science, ICCS 2011
[5] Hernando, H. T., PAGASA, “General Guidelines for Setting-up a Community-Based Flood Forecasting and Warning System” (CBFFWS) Philippines October 2007
[6] Irrigation Training and Research Center California
Polytechnic State University (Cal Poly). (1998). Water level Sensor and Datalogger Testing and Demonstration. Retrieved, April 2013 from http://www.itrc.org/reports/sensors/WaterLevelSensor.pdf. [7] Kou M, Zhen Y. Dynamic uplink/down link resource allocation
for TDD OFDMA access network, In: Proceeding sof the international conference on communications and mobile computing; January 2009.
[8] Kwah, Zai Shyong (2003) “GSM Based Remote Terminal Unit Of The Flood Warning And Control System” School of Engineering, Design and Technology, University of Bradford (January 2010). Retrieve November, 2010.
[9] Magori, V.: Signal Processing for Smart Ultrasonic Sensors, Proc. 3rd Annual European Computer Conference pp.(3-21) - (3-26)., l989. [10] Windarto, Joko.“Flood Early Warning System Develop at Garang
River Semarang using Information Technology base on Sms And Web”International Journal Of Geomatics And Geosciences” Volume 1, No 1, 2010.Engineering Faculty, Diponegoro University Semarang Indonesia (2010). Retrieve “November, 2010.