Article
Design, Construction, and Testing of a
Gasifier-Specific Solid Oxide Fuel Cell System
Alvaro Fernandes1,*, Joerg Brabandt2, Oliver Posdziech2, Ali Saadabadi1, Mayra Recalde1, Liyuan Fan1, Eva O. Promes1, Ming Liu1, Theo Woudstra1
and Purushothaman Vellayan Aravind1
1 Energy Technology Section, Department of Process and Energy, Delft University of Technology,
Leeghwaterstraat 39, 2628 CB Delft, The Netherlands; [email protected] (A.S.); [email protected] (M.R.); [email protected] (L.F.); [email protected] (E.O.P.); [email protected] (M.L.); [email protected] (T.W.); [email protected] (P.V.A.)
2 Sunfire GmbH, Gasanstaltstraße 2, 01237 Dresden, Germany; [email protected] (J.B.); [email protected] (O.P.)
* Correspondence: [email protected]; Tel.: +31-(0)15-278-36-88
Received: 26 May 2018; Accepted: 26 July 2018; Published: 31 July 2018
Abstract: This paper describes the steps involved in the design, construction, and testing of a gasifier-specific solid oxide fuel cell (SOFC) system. The design choices are based on reported thermodynamic simulation results for the entire gasifier- gas cleanup-SOFC system. The constructed SOFC system is tested and the measured parameters are compared with those given by a system simulation. Furthermore, a detailed exergy analysis is performed to determine the components responsible for poor efficiency. It is concluded that the SOFC system demonstrates reasonable agreement with the simulated results. Furthermore, based on the exergy results, the components causing major irreversible performance losses are identified.
Keywords:SOFC; validation; simulation; exergy; syngas
1. Introduction
The production of electricity, biofuels, and chemicals is increasingly using biomass sources. Indeed, by 2015, Europe had installed a net maximum capacity of 35.4 GW from energy sources
including municipal waste, biogas, wood and wood residues, and other solid residues. [1].
Biomass is a storable feedstock that is being employed for power generation in biomass-fired plants. These plants are typically steam cycle or organic Rankine cycle (ORC) power systems capable
of achieving electrical efficiencies from 15% (small plants) to 40% (large plants) [2,3].
Alternatively, biomass can be processed into gaseous fuels such as syngas and biogas for further use in power-producing steam engines, which have a modest efficiency of approximately 20%; or gas
engines, gas turbines, and fuel cells, especially SOFC, which can achieve efficiencies up to 50% [4–7].
Nevertheless, there are major problems in the use of biomass for power generation, namely the logistics of collection and seasonal availability, which create inefficient biomass power chains. To overcome these issues, the installation of small-scale decentralized biomass power plants is
an economically viable and efficient solution [5,8]. At this scale, gas engines and gas turbines
suffer from lower efficiency (i.e., a reduction in power production capacity), compared with SOFCs. Moreover, SOFCs also have the advantage of operating at very high efficiencies in part-load windows.
Furthermore, they are less susceptible to variations in fuel composition [9,10].
To accommodate the fluctuating electricity demands of both grid and off-grid installations, SOFC systems should be capable of operating within a wide part-load window. Consequently, it is
fundamental that SOFC systems have an adequate system configuration and components. The selection of components must be based on, among other factors, the material limitations, variations in gas composition, thermal management, and carbon suppression.
System modelling is a rapid and cost-effective method for predicting system performance and
off-design operation conditions. Many studies on the simulation of SOFC systems [11] focus on the
performance under specific design conditions or the transient performance of SOFCs under a varying
electric load [12], whereas others consider the transient performance of the entire SOFC system. These
system models are usually validated by mathematical models, although some have been validated using experimental data for a number of the components.
Rokni [13] investigated the re-powering of a steam power plant with gas turbines and SOFCs.
In his work, three system configurations were simulated: base case (steam plant), steam plant with gas turbines, and steam plant with SOFCs. Only the latter system was calibrated with experimental data for a planar SOFC, while for other components a similar modeling approach to other available studies was followed. It was reported that the plant with an SOFC system could achieve an optimized
efficiency above 66% for an operating temperature of 1013 K, current density of 200 A/cm2, and a fuel
utilization of 80%.
Similarly, Ugartemendia et al. [14] validated his dynamic model of an SOFC-steam cycle with
SOFC experimental data from the literature. Other components such as heat exchangers were assumed to have constant thermal effectiveness. The authors concluded that the operating temperature of 1173 K and a fuel utilization of 65% were the optimal conditions for achieving the higher power output.
Chung et al. [15] studied the influence of operating parameters on the plant efficiencies of a
methane gas-fed SOFC power generation system. The results obtained from a mathematical model simulated under the design conditions revealed that the air-to-fuel ratio (A/F) was the most important parameter in terms of system efficiency. The pre-reforming rate of fuel was found to be relatively insignificant in terms of efficiency, but could be used as an auxiliary tuner for the operating temperature of the SOFCs, in addition to A/F.
Chitsaz et al. [16] conducted a thermodynamical evaluation of an integrated tri-generation system
driven by an SOFC. Through steady-state system simulations based on mathematical correlations, and partially validated by experimental data obtained from an SOFC setup, a maximum system exergy efficiency of 46% was achieved. The main sources of irreversibility were observed to be the air heat exchanger, SOFC, and afterburner.
A similar analysis was performed by Stamatis et al. [17] for an SOFC and a hybrid SOFC-gas
turbine system fuelled by ethanol. The models were partially validated by available experimental data from the literature for the SOFC component. A system efficiency of up to 60% was achieved under certain operating conditions. It was also disclosed that the SOFC and burner-reformer components were the major sources of irreversibilities within the systems.
Xu et al. [18] investigated the influence of various design parameters on the SOFC thermal
behaviour and system performance of a natural-gas-fuelled 1 kW conceptual design for a residential combined heat and power system. This system was also modelled based on mathematical correlations and partially validated by experimental data obtained from an SOFC experimental setup. The results indicated that the cell output voltage, system inlet fuel flow rate, and SOFC stack inlet air temperature had a dramatic effect on the electrical efficiency and cogeneration efficiency.
Somekawa et al. [19] investigated the influence of various design parameters on a manufactured
multi-stack SOFC system coupling an anode regenerator between stacks. The regenerator consisted of
a CO2absorber and water vapour condenser to selectively remove these compounds from the anode
off-gas mixture. The system models were validated by experimental data collected from an SOFC setup and a hot module designed especially for the study. A remarkable total fuel utilization of 92.0% and an electrical efficiency of 77.8% were achieved with this design.
A diesel-fed SOFC power system is being designed and developed for maritime applications
reformer and SOFC components with experimental data available in the literature. The authors will further validate the whole system with experimental lab work. The system model will then be used for system performance analysis and the determination of optimal operation conditions through an exergetic analysis.
The aforementioned studies all use hydrogen, methane, or natural gas as the fuel. In a recent study,
D’Andrea et al. [21] performed a dynamic simulation for the proof-of-concept of a biogas-fed SOFC
polygeneration system. The SOFC model was primarily validated by reproducing similar test conditions as used by the manufacturer and comparing with data provided by the manufacturer. A second validation was performed by including the SOFC model in the system model for comparison with data collected from the proof-of-concept. This model was developed to investigate both the stack and balance-of-plant (BoP) thermal behaviour under abnormal operation conditions, namely fast load current ramps, fault cathode air, and different rates of internal reforming of the fuel in the SOFC. They concluded that in the event of the two first abnormal conditions, the SOFC may overheat and be damaged. To prevent this, the system control should shift the system to the open circuit condition. It was also concluded that the percentage of fuel that is internally reformed in the SOFC can be adjusted to control the temperature.
To the best of the authors’ knowledge, this paper is the first to describe all of the steps involved in the design, construction, and testing of a gasifier-specific SOFC system. For the first time, system testing was conducted to compare the recorded performance with the predicted thermodynamic performance obtained by system simulation, aiming at validating the exergy flow model of the system. In addition to the design point analysis, we investigated part-load and off-design conditions to develop a deeper understanding of the variation in system performance.
2. Selection of the Design of SOFC System
The SOFC system was developed to be integrated with a plasma gasifier and a gas cleanup
unit (Figure1) at TU Delft. Prior to determining the system configuration, TU Delft performed a
thermodynamic analysis of the power plant in which two suitable configurations for the SOFC system
were evaluated [22]. The main difference in the configurations was the mechanism for suppressing
carbon formation.
Both system configurations considered the SOFC materials, approaches for suppressing carbon formation, SOFC temperature control strategy, and thermal management.
2.1. SOFC Materials
Nickel–Gadolinium-doped Ceria (Ni/GDC) anode cells were selected for their anticipated
advantages with hydrocarbon fuels [23,24]. It has been reported that Ni/GDC is more resistant
to carbon deposition and poisoning by typical syngas contaminants than Nickel/Yttria-stabilized
Zirconia (Ni/YSZ) anodes [25–27].
2.2. Carbon Suppression Technique
The major difference between the system configurations in the study of Liu et al. [22] is the
technique employed for suppressing carbon formation. One system uses steam produced in a heat recovery steam generator unit that is mixed with the anode flow before it enters the SOFC module, whereas the other uses a catalytic partial oxidation unit (CPOx) to suppress carbon formation and pre-reform some of the hydrocarbons before it enters the SOFC module. In our system, the last technique is employed.
2.3. SOFC Temperature Control Strategy
2.4. Thermal Management
The syngas exits the gas cleanup unit at a relatively low temperature (approximately 673 K) and the cathode air enters the system at environment temperature. Therefore, both flows must be heated before they enter the SOFC module. This is accomplished by using heat exchangers and a CPOx unit to suppress carbon formation. Flue gas produced in an afterburner is used as heat source to heat the cathode air, and is also used to pre-heat/heat the syngas. For the system configuration using steam as the carbon suppression, the flue gas is also used as heat source to generate steam in a heat recovery steam generator. The flue gas subsequently moves to the dryer and is used to pre-dry the feedstock that is fed to the gasifier.
Dryer Plasma
gasification Gas cleanup SOFC system
Microwave generator Human waste
(Faecal matter)
Surplus heat and electricity Heat
[image:4.595.84.509.242.331.2]Electricity
Figure 1. Flow of the integrated plasma gasifier-gas cleanup-solid oxide fuel cell (SOFC) system. Reproduced with permission from [22], Copyright Elsevier, 2018.
Previous results suggest that the system configuration with a CPOx unit could achieve higher
electrical efficiency [22]. As this unit also increases the flexibility in terms of thermal integration, it was
selected for construction.
3. Description of the SOFC System
In this section, the components in the SOFC system and the construction process are briefly described. The equipment used to record data for the test runs and the safety control strategies are also listed.
3.1. System Construction Design
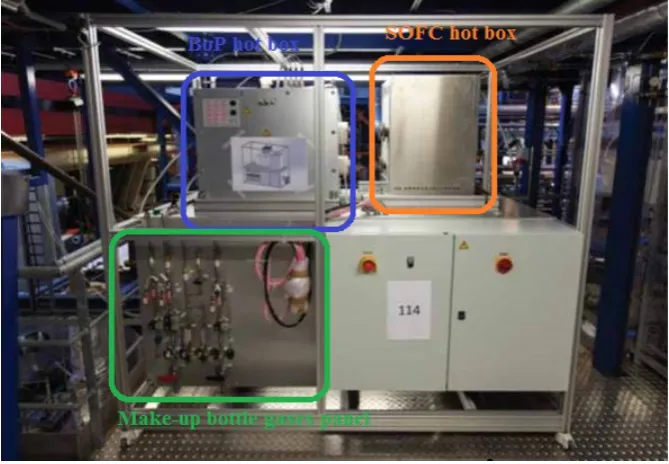
The SOFC system (Figure2) consists of two hot boxes: a BoP hot box and an SOFC hot box [28];
as well as a make-up gases panel. The hot boxes are connected by four insulated pipes (i.e., anode and cathode inflows/outflows). The BoP hot box is also connected to the supply gases, syngas, and intake air, and has an exhaust flue gas pipe. Each hot box is thermally insulated with low-thermal-conductivity panels to reduce heat losses to the surroundings. Moreover, the BoP hot box is filled with a granulated microporous insulation material that offers good resistance to heat transfer between BoP components.
The BoP hot box contains the air heater, fuel pre-heater, CPOx unit, and afterburner. Both the fuel pre-heater and air heater are counter-flow plate heat exchangers made of high-temperature alloy. Under the design conditions, the air heater increases the cathode air temperature to 923 K. The fuel pre-heater increases the fuel temperature to approximately 523–623 K, after which the fuel is supplied to the CPOx unit. This component increases the oxygen-to-carbon (O/C) ratio to prevent carbon formation, pre-reforms hydrocarbons, and increases the fuel temperature to 973–1073 K. Both the CPOx and afterburner are catalytic burners impregnated with adequate catalysts.
The SOFC hot box contains the SOFC module, consisting of two towers of SOFC stacks that are electrically connected in parallel. Each tower is composed of three 30-cell stacks that are electrically connected in series. This module was tested and achieved a nominal power of 4 kW
in reference conditions (40% H2/60% N2, fuel utilization (Uf) = 0.75, cell voltage (Vcell) > 0.65 V,
for syngas. The make-up gases panel contains the hydrogen and nitrogen rotameters, which provide the forming gas during system start-up, and the hydrogen, nitrogen, and air (CPOx air) mass flow controllers, which provide the gases for the test runs. Other gases such as carbon monoxide and carbon dioxide are measured by mass flow controllers located in the gas cleanup unit and supplied by the syngas inlet pipe.
[image:5.595.130.465.235.467.2]The intake air is fed to the system using two blowers (i.e., a cathode blower and a CPOx blower). The cathode blower can provide 900 nL of air per minute under reference conditions. A filter and a flow measurement device are located on the discharge side. The CPOx blower provides 15 nL of air per minute under reference conditions and is coupled with a filter on the admission side. The mass flow controller is located on the discharge side of the CPOx blower.
Figure 2.The SOFC 3.5 KWesystem at TU Delft with description of the various parts. The air blowers are located behind the make-up bottle gases panel.
3.2. Safe Operation Parameters
The safe operating parameters are primarily intended to protect expensive components and users from risks associated with the operation of the SOFC system. This is accomplished by implementing safety functions in a programmable logic controller (PLC) that are capable of shifting the system to a safe operation mode when required. The safety functions process information acquired from installed measurement devices in the system and signals from external safeguards such as the gas detection and ventilation systems.
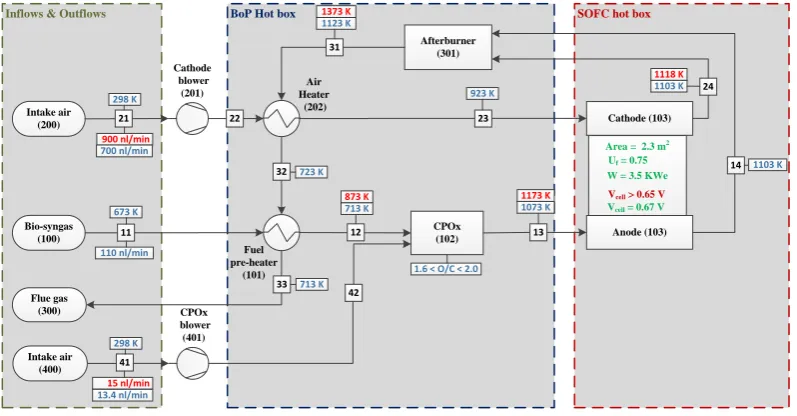
The parameters that can limit the extent of the system part-load operation are illustrated in
Figure3. The safe upper limit operating temperature, maximum flows of cathode air and CPOx air,
SOFC hot box
Inflows & Outflows BoP Hot box
W = 3.5 KWe
Bio-syngas (100) Intake air
(200)
CPOx
(102) Anode (103) Cathode (103) Afterburner (301) Flue gas (300) Cathode blower (201) Air Heater (202) Fuel pre-heater (101) CPOx blower (401)
Vcell> 0.65 V
Intake air (400)
Vcell= 0.67 V
Area = 2.3 m2
Uf= 0.75
41 42 13 12 11 33 14
21 22 23
24 31 32 923 K 1073 K 1173 K 1103 K 1103 K 1118 K 1123 K 1373 K 723 K 713 K 673 K 110 nl/min 15 nl/min 13.4 nl/min 298 K 298 K 900 nl/min 700 nl/min 713 K 873 K
[image:6.595.99.498.90.298.2]1.6 < O/C < 2.0
Figure 3. Limiting operation and preliminary design parameters of the SOFC system. Red parameters: maximum volume flows and temperatures; blue parameters: preliminary design parameters. BoP: balance-of-plant; CPOx: catalytic partial oxidation unit.
4. System Modelling
The system was simulated using Cycle-TempoR software (version 5.0, Delft University of
Technology, Delft, The Netherlands), a Fortran-based software package designed for analysing the first
and second laws of thermodynamics of power plants [29].
Figure4illustrates the SOFC system model. Three inlet flows are defined: syngas (source 100),
cathode air (source 200), and CPOx air (source 400). There is one outlet flow: flue gas (sink 300). The operating parameters of the SOFC are inserted to accurately determine the amount of chemical
energy converted into electricity. Specifically, these parameters are the fuel utilization (Uf), equivalent
resistance (Req), and electric power ( ˙WSOFC). Other parameters such as the CPOx O/C ratio and SOFC
outflows temperature must also be specified.
The CPOx air mole flow (Φ41) is calculated as
Φ41 = Φ11·
y11.CO·(O/C−1) +y11.CO2 ·(O/C−2)
2·y41.O2
, (1)
whereypipe.speciesis the mole fraction of the species (CO, CO2, or O2) in the mixture (pipe) andΦ11is
the inlet flow (mol/s) of the syngas in the system (pipe 11). Assuming a gas composition constant in
the cross-section and that the process occurs at constant temperature and pressure,Φ11is calculated in
the SOFC component by
Φ11= I
z·F·Uf·(y13.H2+y13.CO)
−Φ41·y41.N2, (2)
Uf=
Φ13·(y13.H2+y13.CO)−Φ14·(y14.H2 +y14.CO) Φ13·(y13.H2+y13.CO)
, (3)
I= W˙SOFC
Vcell
, (4)
Vcell =VNernst,x−
Ix
Areax
[image:6.595.178.523.629.774.2]VNernst,x=− 4go z·F +
¯
R·Tcell z·F ·ln
yH2,x·y 0.5 O2x yH2O,x
·p0.5cell !
, (6)
where I andVcell are the current produced by all cells and the cell voltage in amperes and volts,
respectively,zis the number of electrons involved in a single reaction,Fis Faraday’s constant (96485
C/mol),VNernst,xis the local Nernst potential (V), and the ratio ofIxandAreaxis the local current
density (A/cm2). More detailed information can be found in [29,30].
The cathode air mole flow (Φ21) is calculated by an energy balance in the SOFC as
Φ21 =
Φ24·h¯24+Φ14.¯h14−Φ13·h¯13+W˙SOFC
¯
h23
, (7)
where ¯his the enthalpy in kJ/mol.
The modelling of the heat exchangers is based on the first law of thermodynamics for the energy balance in the heat exchanger,
˙
QTrans=Φm,h·cp,h·(Th,in−Th,out) =Φm,c·cp,c·(Tc,out−Tc,in), (8)
wherecpis the specific heat (kJ/(kg·K)) of the medium,Φmis the flow of the fluids (kg/s), h is the hot
medium, and c is the cold medium. The transmitted heat flow in kW ( ˙QTrans) can be calculated as
˙
QTrans=U·A·LMTD, (9)
whereUis the overall heat transfer coefficient (W/m2·K) andAis the heat transfer surface area (m2).
The logarithm mean temperature difference (LMTD) for a counter-flow heat exchanger is
LMTD= (Th,in−Tc,out)−(Th,out−Tc,in) ln(Th,in−Tc,out
Th,out−Tc,in)
. (10)
The off-design calculations of Cycle-TempoR use the approach developed by Miedema [31],
in which the variation in the overall heat transfer coefficient multiplied by the heat transfer surface area is proportional to the variation of the mass flow:
(U.A)i= (U.A)D·
Φm,i
Φm,D
ηcf
, (11)
whereirefers to an off-design operating point, D refers to the design operating point of the heat
exchanger, andηcfis an exponential correction factor. Knowing the inlet temperatures of both media
in the heat exchanger, Cycle-TempoR iteratively calculates the outlet temperature of both flows.
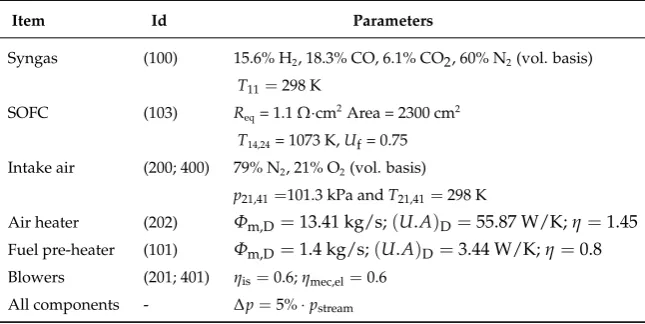
Table 1.Input parameters used in the system modelling.
Item Id Parameters
Syngas (100) 15.6% H2, 18.3% CO, 6.1% CO2, 60% N2(vol. basis) T11=298 K
SOFC (103) Req= 1.1Ω·cm2Area = 2300 cm2 T14,24= 1073 K,Uf= 0.75 Intake air (200; 400) 79% N2, 21% O2(vol. basis)
p21,41=101.3 kPa andT21,41=298 K
Air heater (202) Φm,D=13.41 kg/s;(U.A)D=55.87 W/K;η=1.45 Fuel pre-heater (101) Φm,D=1.4 kg/s;(U.A)D=3.44 W/K;η=0.8 Blowers (201; 401) ηis=0.6;ηmec,el=0.6
All components - ∆p=5%·pstream
5. Test Runs with the SOFC System
The SOFC system was designed and developed to integrate a gasifier-gas cleaning unit-SOFC plant fed by faeces from human waste. The faeces, after being separated from urine in the sanitation system, were sent to a pre-drying unit to reduce the moisture content from approximately 80% to acceptable
levels for the plasma gasification process (20–40%) [22]. The syngas composition used for the design
of the SOFC system was based up on the model developed and presented in [22]. The model was
based on equilibrium assumptions for the gasifier considering that very-high-temperature gasification processes approach equilibrium conditions.
The SOFC system was tested over the range allowed by the limited testing conditions in the laboratory. The syngas composition was modified from the initial design composition by increasing the nitrogen concentration by 20% to enhance the accuracy of the nitrogen flow measurements. The syngas composition and flow rate were controlled by mixing bottled gases that were individually measured in mass flow controllers before entering the system. As a consequence, the syngas was fed in at the environmental temperature on a dry basis, which also diverged from the design conditions. Thus, some parameters like the flow rate of the CPOx blower or cathode air flow rate did limit the window of operation points in the performed experiments.
Operating points were taken at constant intervals of 10 mA/cm2current density. Operating points
were only considered for analysis if the system achieved the steady state without crossing any of the safe operating parameters.
During the test runs, the following operating parameters that are calculated or displayed in the interface of the software were maintained:
• Constant SOFC fuel utilization of 0.75±0.01,
• Constant O/C ratio of 1.6±0.002 in the CPOx unit,
• Constant outlet temperature of 1073±10 K at the SOFC cathode.
Table 2.List of measurement devices and their accuracy.
Measurement Type Measurement Device Accuracy
Temperature Thermocouples type N ±1.1 K or 0.4% of Rd±0.3% terminal (PLC) Cell voltage In-situ wiring ±0.3% signal analog input (PLC)
CPOx air flow Mass flow controller ±0.5% of Rd±0.1 of Fs (16 nL/min) H2flow Mass flow controller ±0.5% of Rd±0.1 of Fs (20 nL/min) N2flow Mass flow controller ±0.5% of Rd±0.1 of Fs (20 nL/min) CO flow Mass flow controller ±0.8% of Rd±0.2 of Fs (5 nL/min) CO2flow Mass flow controller ±1% of Rd±1% of Fs (1 nL/min)
Cathode air Flow meter ±2% of Rd±0.3 signal analog input (PLC) Current Electronic load ±0.2% of Fs (160 A)
Rd: reading value; Fs: full scale/nominal; PLC: programmable logic controller.
6. Results and Discussion
The results of this study are presented in four main parts. Firstly, the system model results for different syngas supply conditions and SOFC temperatures are compared with those under the design conditions. Secondly, data recorded in the test runs are compared with results obtained by the system model. Thirdly, the system efficiency is analysed to determine the major sources of inefficiency. Finally, based on the results, some considerations for improved design strategies are given.
6.1. Thermodynamic Comparison for Different Syngas Supply Conditions and SOFC Temperatures
A thermodynamic model was prepared considering both the design conditions and the
experimental conditions. The results are depicted in Figure4and Table3.
p T h m p = Pressure [bar] T = Temperature [°C] h = Enthalpy [kJ/kg] m = Mass flow [kg/s] Inflows & Outflows Intake air Bio-syngas Intake air Flue gas
BoP hot box SOFC hot box
SOFC Afterburner Air heater Fuel pre-heater CPOx blower Cathode blower CPOx 298 K 298 K 301.6 K 301.6 K 298 K 298 K 298 K 673 K 684.8 K 721.6 K 1161.1 K 1214.6 K 878.6 K 913.3 K 1118.1 K 1020.8 K 602.3 K 716.1 K 736.1 K 727.3 K 1073 K 1103 K 301.6 K 301.6 K
O/C - 1.6
O/C - 1.6
196 nl/min 110 nl/min 888 nl/min 722 nl/min 39.5 nl/min 12.7 nl/min Vcell = 0.670 V
j = 2270 A/m2
Vcell = 0.653 V j = 2330 A/m2
100 101 H 102 103 A C 200 201 202 H 300 301 400 401 11 11 12 12 13 13 14 14 21 21 22 22 23 23 24 24 31 31 32 32 33 33 41 41 42 42
Cycle-Tempo 5.0 (Build 484) d:\biofuels and fuel cells systems for aircrafts\stack 4kw experiments\models\simulations\new simulations\syngas models\sofctesting fig.gui
April 11, 2017 8:49:47 Page 1 of 1
[image:9.595.147.446.445.727.2]Table 3.Comparison of the results of the main streams as well as system model efficiencies.
Simulation Considering Design Conditions
Pipe number
11 13 14 23 24 31 41
mol % H2 26.95 21.70 5.57
mol % CO 22.00 18.55 4.54
mol % CO2 7.01 8.01 22.05 3.90
mol % N2 37.85 43.09 43.04 79.0 81.04 76.06 79.0
mol % O2 21.0 18.96 15.57 21.0
mol % H2O 6.19 8.60 24.81 4.46
Mole flow (mol/s) 0.082 0.089 0.089 0.537 0.523 0.608 0.009 Vol. flow (nL/min) 110.0 119.9 119.9 721.8 703.3 817.2 12.7
Exergy (kW) 10,382 10,118 3984 4773 6958 10,287 ~0
Auxiliaries consumption = 0.092 kW System electric efficiency = 32.8% Simulation Considering Experimental Conditions
Pipe number
11 13 14 23 24 31 41
mol % H2 15.60 8.71 2.23
mol % CO 18.36 13.21 3.25
mol % CO2 6.10 7.84 17.80 4.38
mol % N2 60.0 65.51 65.50 79.0 80.70 77.99 79.0
mol % O2 21.0 19.30 14.82 21.0
mol % H2O 4.74 11.22 2.80
Mole flow (mol/s) 0.146 0.169 0.169 0.661 0.647 0.811 0.029 Vol. flow (nL/min) 195.8 227.0 227.0 888.0 869.2 1090 39.5
Exergy (kW) 12,545 11,946 5166 5381 8129 12,606 ~0
Auxiliaries consumption = 0.116 kW System electric efficiency = 27.0%
The supply of a syngas composition with no water vapor and higher nitrogen content (experimental conditions) resulted in an increase of all other flows. Higher syngas flow was fed to compensate the loss of chemical energy in the CPOx unit by oxidation with air to achieve the specific
O/C ratio. For the effect, a higher amount of CPOx air was also supplied (Figure4). As a major
consequence, a higher amount of heat was produced that resulted in higher outlet temperature of pipe 13 of the CPOx unit, which was also higher than the SOFC temperature. Therefore, the cooling requirements of the SOFCs were enhanced and, subsequently, a higher cathode air flow was needed. The higher cathode flow resulted in a lower operating temperature in the afterburner (53 K) and lower temperature of the cathode inflow (pipe 23) of approximately 35 K.
The syngas fed at 298 K was heated in the fuel pre-heater to 100 K less than with the preliminary design conditions, even though higher heat flow was transmitted by the flue gas. As a consequence, the temperature of the flue gas leaving the system (pipe 33) was slightly reduced.
6.2. Comparison of System Simulation with Test Runs
In the test runs, only three steady-state operating points were achieved, at 70, 80 and 90 mA/cm2,
resulting in a part-load operating window of 37–47%. For lower current densities than 70 mA/cm2,
a steady state could not be reached because of the safety protection for the fuel pre-heater (T33should
not exceed 573 K), whereas for higher current densities than 90 mA/cm2, no sufficient CPOx air could
be provided to achieve the specified O/C ratio.
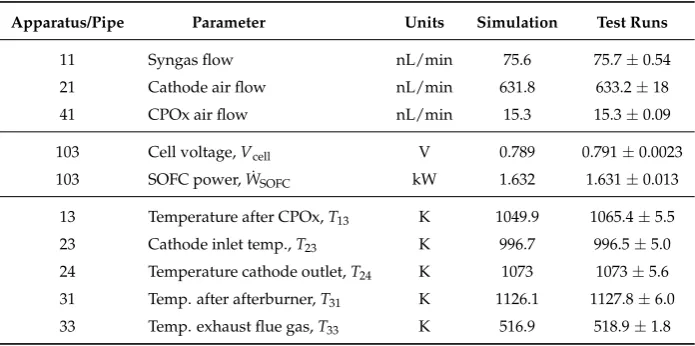
Table4compares the data measured in the test run at a current density of 90 mA/cm2with the
values calculated in the system simulations. Good agreement between the results can be observed.
Figure5compares the SOFC performance (average cell voltage) and cathode air flow required to
maintain an outlet cathode temperature of 1073 K for experimental and simulation results. A good match in the average cell voltage was seen, and thus equal power was produced. The cell voltage
was also in accordance with values reported in many studies in syngas-fed-SOFCs [32,33]. Moreover,
as equal fuel flow rate and composition were supplied, it can be concluded that the heat production in the subsystem was similar between test runs and the simulation model. The temperatures of the main
streams in the BoP box are shown in Figures6–8. There was reasonable agreement between the values
measured in the real system during the test runs and those provided by the system simulations. In general, the maximum deviations were on the order of 10 K. The exception was the temperature of the
syngas after the CPOx (T13), where the deviation was approximately 20 K for a current density of 90
mA/cm2.
[image:11.595.124.472.439.612.2]These deviations were caused by various factors, such as simplifications and constraints imposed in the system simulation (non-heat-losses approach, equilibrium calculations for the CPOx component, and inaccuracies in the heat exchanger design), and the accuracy of measurement devices in the system, among others.
Table 4.Comparison of results for the 90 mA/cm2operating point.
Apparatus/Pipe Parameter Units Simulation Test Runs
11 Syngas flow nL/min 75.6 75.7±0.54
21 Cathode air flow nL/min 631.8 633.2±18
41 CPOx air flow nL/min 15.3 15.3±0.09
103 Cell voltage,Vcell V 0.789 0.791±0.0023
103 SOFC power, ˙WSOFC kW 1.632 1.631±0.013
13 Temperature after CPOx,T13 K 1049.9 1065.4±5.5
23 Cathode inlet temp.,T23 K 996.7 996.5±5.0
24 Temperature cathode outlet,T24 K 1073 1073±5.6
31 Temp. after afterburner,T31 K 1126.1 1127.8±6.0
33 Temp. exhaust flue gas,T33 K 516.9 518.9±1.8
6.3. System Efficiency
The system performance (electric efficiency) was evaluated at the three operating points obtained
in the test runs. The thermodynamic calculations are similar to those described in [34]. Figure9shows
300 400 500 600 700
V
ol
ume
f
lo
w
[
nL/mi
n]
70 80 90 Current density [mA/cm2]
Simulation Test runs
(a)
0.78 0.79 0.80 0.81 0.82
70 80 90
A
ve
rage
cell
vo
ltage
[
V
]
Current density [mA/cm2]
Test runs Simulation
[image:12.595.173.416.90.414.2](b)
Figure 5.Comparison of parameters acquired in the test runs with simulated ones. (a) Cathode volume flow; (b) Average cell voltage (Vcell).
37.2 42.1 46.6
752 802 852
1025 1075 1125
70 80 90
Part-load [%]
Te
mp
er
at
ur
e
[
oC]
Te
mp
er
atu
re
[K
]
Current density [mA/cm2]
Test runs [T13] Test runs [T31] Simulation [T13] Simulation [T31]
[image:12.595.144.457.464.658.2]37.2 42.1 46.6 677 702 727 752 950 975 1000 1025
70 80 90
Part-load [%] Te m perature [ oC] Te m perature [K ]
Current density [mA/cm2]
[image:13.595.146.458.89.254.2]Test runs [T23] Simulation [T23]
Figure 7.Comparison of simulated results with those acquired in the test runs. Cathode air from air heater (T23) .
37.2 42.1 46.6
227 252 277 302 500 525 550 575
70 80 90
Part-load [%] Te mp er at ur e [ oC] Te m pe rat ur e [K ]
Current density [mA/cm2]
[image:13.595.147.451.307.471.2]Test runs [T33] Simulation [T33]
Figure 8.Comparison of simulated results with acquired ones in the test runs. Temperature of flue gas leaving the system (T33) .
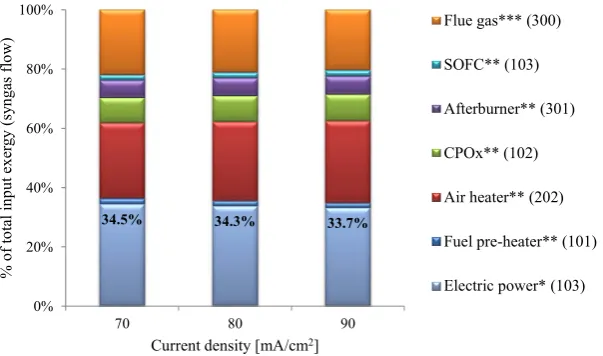
34.5% 34.3% 33.7%
0% 20% 40% 60% 80% 100%
70 80 90
% of tot al input e xe rg y (s yn ga s fl ow)
Current density [mA/cm2]
Flue gas*** (300)
SOFC** (103)
Afterburner** (301)
CPOx** (102)
Air heater** (202)
Fuel pre-heater** (101)
Electric power* (103)
[image:13.595.150.452.523.701.2]The air heater contributed to a 25–30% reduction in the efficiency of the system, making it the major source of irreversibility. The impact of this type of component on the system performance has
been highlighted in many studies (e.g., [35,36]), and is caused by heat transfer at limited temperature
as well as great temperature difference between hot and cold media. Flue gas losses appeared as the second contributor, carrying approximately 20% of the exergy. The high physical exergy carried by the stream due to high exhaust temperature and mass flow rate were the aspects contribution for such value. The afterburner and CPOx also caused a significant reduction in system performance of approximately 14% as a consequence of the irreversible nature of the oxidation process. The latter component also contributed to the great exergy contained in flue gas. Although it is not clearly
demonstrated in Figure9, a significant amount of the chemical exergy of the syngas was converted
[image:14.595.125.470.327.493.2]into heat exergy in the CPOx. The main consequence was that, for equal electric power production, a larger amount of syngas needed to be fed into the system, which subsequently reduced the system efficiency. Finally, the SOFC and fuel pre-heater were minor sources of irreversibility. Nevertheless, they collectively corresponded to approximately 6% in exergy destruction. This resulted in a modest system electrical efficiency of 33.7–34.5%.
Table 5.System performance of various stationary SOFC systems. Modified after [37].
System Manufacturer Output Power (kW) η(%) Fuel Processing Ref.
Bloom energy 250 AC >53 - [38]
Wärtsilä 24 DC 47 SR/AOGR [39]
FZJ 20 DC 41 External SR [37]
VTT(2010) 7 AC 43 SR/AOGR [40]
VTT(2011) 8 AC 49 SR/AOGR [41]
CFCL 1.5 AC 60 SR/WR [42]
ENE-farm 0.7 AC 41–47 SR/WR [43,44]
Hexis 1 AC 35 CPOx [45]
SOFCpower 1 AC 32 CPOx [46]
IKTS 1.26 AC 39 CPOx [47]
SR: steam reforming; AOGR: anode off-gas recycling; WR: water recycling.
The system performance was comparable with other systems employing a CPOx unit, as can be
seen in Table5. It can also be observed that all SOFC systems employing steam reforming as the fuel
processing had higher system efficiency. This aspect is associated with the steam reforming process, which increases the chemical energy of the fuel by using available heat exergy in the system.
Nevertheless, it is should also be highlighted that the system performance is affected by various aspects such as the fuel composition, selected load operation as well as the system design choices. In the next section, some considerations for improving the design are given.
7. Future Considerations for Improving the Design
8. Summary
In this study, we investigated the design, construction, and testing of a gasifier-specific SOFC system. This paper makes the following contributions to the study of advanced SOFC technologies:
1. System development: this is the first study to describe the design, development, and testing
of an SOFC system to be integrated with a gasifier. The gasifier considered in this study is a
plasma reactor with the capacity to process 8.84 kW of human waste (before pre-drying) [22,48].
The SOFC system was designed based on discussions between TU Delft and Sunfire GmbH.
2. Calculated results exhibited good agreement with experimentally recorded values under different
operating conditions. This clearly demonstrates the advantage of a rigorous thermodynamic model of new fuel cell power systems when they are being designed and built.
3. The validated model clearly indicates where the thermodynamic losses are occurring and provides
indications on how to minimize these losses in such a system, resulting in improved designs in the future.
4. System efficiencies of 33.7–34.5% were estimated. The CPOx unit and heat exchangers, especially
the air heater, were identified as the major contributors to reductions in efficiency.
Author Contributions:The experimental work was carried out by A.S., M.R., L.F. and E.O.P. The SOFC simulation was supported by M.L. O.P. and J.B. jointly with M.L., E.O.P. and P.V.A. decided the conceptual design SOFC system. J.B. and O.P. led and supervised the construction of the SOFC system. T.W., P.V.A. and J.B. contributed in the results discussion. A.F. led the experimental work, developed the SOFC models, and prepared the first draft and final version of the paper. The paper was corrected and reviewed by J.B. and P.V.A.
Funding:This research was founded by The Bill & Melinda Gates foundation to build the SOFC system.
Acknowledgments:The Bill & Melinda Gates Fundation is thanked for the financial support. Also, the Portuguese Fundação para a Ciência e Tecnologia (FCT), through the Grant—SFRH/BD/77042/2011, and the Ecuador Secretaría de Educación Superior, Ciencia, Tecnología e Innovación (SENESCY) are thanked for the partial financial support to the first authors.
Conflicts of Interest:The authors declare no conflict of interest.
References
1. Eurostat. The Key to European Statistics. 2017. Available online: http://ec.europa.eu/eurostat/web/ energy/data/database(accessed on 22 April 2017).
2. Guercio, A.; Bini, R. 15—Biomass-fired Organic Rankine Cycle combined heat and power systems. InOrganic Rankine Cycle (ORC) Power Systems; Macchi, E., Astolfi, M., Eds.; Woodhead Publishing: Sawston, UK, 2017; pp. 527–567. [CrossRef]
3. Hurskainen, M.; Vainikka, P. 7—Technology options for large-scale solid-fuel combustion. InFuel Flexible Energy Generation; Oakey, J., Ed.; Woodhead Publishing: Boston, MA, USA, 2016; pp. 177–199. [CrossRef] 4. Chacartegui, R.; Sanchez, D.; de Escalona, J.M.; Monje, B.; Sanchez, T. On the effects of running existing
combined cycle power plants on syngas fuel. Fuel Process. Technol.2012,103, 97–109. [CrossRef]
5. Asadullah, M. Barriers of commercial power generation using biomass gasification gas: A review.
Renew. Sustain. Energy Rev.2014,29, 201–215. [CrossRef]
6. Santhanam, S.; Schilt, C.; Turker, B.; Woudstra, T.; Aravind, P. Thermodynamic modeling and evaluation of high efficiency heat pipe integrated biomass Gasifier-Solid Oxide Fuel Cells-Gas Turbine systems. Energy
2016,109, 751–764. [CrossRef]
7. Bellomare, F.; Rokni, M. Integration of a municipal solid waste gasification plant with solid oxide fuel cell and gas turbine. Renew. Energy2013,55, 490–500. [CrossRef]
8. Singh, J. Management of the agricultural biomass on decentralized basis for producing sustainable power in India.J. Clean. Prod.2017,142, 3985–4000. [CrossRef]
9. Bae, C.; Kim, J. Alternative fuels for internal combustion engines. Proc. Combust. Inst.2017,36, 3389–3413. [CrossRef]
11. Barelli, L.; Bidini, G.; Ottaviano, A. Part load operation of SOFC/GT hybrid systems: Stationary analysis.
Int. J. Hydrogen Energy2012,37, 16140–16150. [CrossRef]
12. Andersson, D.; Aberg, E.; Yuan, J.; Sunden, B.; Eborn, J. Dynamic Modeling of a Solid Oxide Fuel Cell System in Modelica. In Proceedings of the ASME 2010 8th International Conference on Fuel Cell Science, Engineering and Technology, Brooklyn, NY, USA, 14–16 June 2010; American Society of Mechanical Engineers: New York, NY, USA, 2010; pp. 65–72.
13. Rokni, M. Performance comparison on repowering of a steam power plant with gas turbines and solid oxide fuel cells.Energies2016,9, 399. [CrossRef]
14. Ugartemendia, J.; Ostolaza, J.X.; Zubia, I. Operating point optimization of a hydrogen fueled hybrid solid oxide fuel cell-steam turbine (SOFC-ST) plant.Energies2013,6, 5046–5068. [CrossRef]
15. Chung, T.D.; Hong, W.T.; Chyou, Y.P.; Yu, D.D.; Lin, K.F.; Lee, C.H. Efficiency analyses of solid oxide fuel cell power plant systems. Appl. Therm. Eng.2008,28, 933–941. [CrossRef]
16. Chitsaz, A.; Mahmoudi, S.M.S.; Rosen, M.A. Greenhouse gas emission and exergy analyses of an integrated trigeneration system driven by a solid oxide fuel cell. Appl. Therm. Eng.2015,86, 81–90. [CrossRef] 17. Stamatis, A.; Vinni, C.; Bakalis, D.; Tzorbatzoglou, F.; Tsiakaras, P. Exergy analysis of an intermediate
temperature solid oxide fuel cell-gas turbine hybrid system fed with ethanol. Energies2012,5, 4268–4287. [CrossRef]
18. Xu, H.; Dang, Z.; Bai, B.F. Analysis of a 1 kW residential combined heating and power system based on solid oxide fuel cell. Appl. Therm. Eng.2013,50, 1101–1110. [CrossRef]
19. Somekawa, T.; Nakamura, K.; Kushi, T.; Kume, T.; Fujita, K.; Yakabe, H. Examination of a high-efficiency solid oxide fuel cell system that reuses exhaust gas. Appl. Therm. Eng.2017,114, 1387–1392. [CrossRef] 20. Huerta, G.V.; Álvarez Jordán, J.; Dragon, M.; Leites, K.; Kabelac, S. Exergy analysis of the diesel pre-reforming
solid oxide fuel cell system with anode off-gas recycling in the SchIBZ project. Part I: Modeling and validation.
Int. J. Hydrogen Energy2018. [CrossRef]
21. D’Andrea, G.; Gandiglio, M.; Lanzini, A.; Santarelli, M. Dynamic model with experimental validation of a biogas-fed SOFC plant. Energy Convers. Manag.2017,135, 21–34. [CrossRef]
22. Liu, M.; Woudstra, T.; Promes, E.; Restrepo, S.; Aravind, P. System development and self-sustainability analysis for upgrading human waste to power.Energy2014,68, 377–384. [CrossRef]
23. Din, Z.U.; Zainal, Z. The fate of SOFC anodes under biomass producer gas contaminants. Renew. Sustain. Energy Rev.2016. [CrossRef]
24. Cassidy, M.; Connor, P.; Irvine, J.; Savaniu, C. 5—Anodes. InHigh-Temperature Solid Oxide Fuel Cells for the 21st Century (Second Edition), 2nd ed.; Kendall, K., Kendall, M., Eds.; Academic Press: Boston, MA, USA, 2016; pp. 133–160. [CrossRef]
25. Kuramoto, K.; Hosokai, S.; Matsuoka, K.; Ishiyama, T.; Kishimoto, H.; Yamaji, K. Degradation behaviors of SOFC due to chemical interaction between Ni-YSZ anode and trace gaseous impurities in coal syngas.Fuel Process. Technol.2017,160, 8–18. [CrossRef]
26. Liu, M.; van der Kleij, A.; Verkooijen, A.; Aravind, P. An experimental study of the interaction between tar and SOFCs with Ni/GDC anodes. Appl. Energy2013,108, 149–157. [CrossRef]
27. Zhang, L.; Jiang, S.P.; He, H.Q.; Chen, X.; Ma, J.; Song, X.C. A comparative study of H2S poisoning on electrode behavior of Ni/YSZ and Ni/GDC anodes of solid oxide fuel cells. Int. J. Hydrogen Energy2010,
35, 12359–12368. [CrossRef]
28. GmbH, S. Power Core—Efficient Electricity Generator. 2017. Available online:http://www.sunfire.de/en/ products-technology/power-core(accessed on 6 October 2017).
29. Delft, T. Cycle-Tempo 5.0. 2015. Available online: http://www.asimptote.nl/software/cycle-tempo/ (accessed on 22 September 2017).
30. De Groot, A. Advanced Energy Analysis of High Temperature Fuel Cell Systems. Ph.D. Thesis, Delft University of Technology, Delft, The Netherlands, 2004.
31. Miedema, J.A. CYCLE: A general computer code for thermodynamic cycle computations. Studies of cogeneration in district heating systems. InNASA STI/Recon Technical Report N; NASA: Washington, DC, USA, 1981; Volume 82.
33. Baldinelli, A.; Cinti, G.; Desideri, U.; Fantozzi, F. Biomass integrated gasifier-fuel cells: Experimental investigation on wood syngas tars impact on NiYSZ-anode Solid Oxide Fuel Cells.Energy Convers. Manag.
2016,128, 361–370. [CrossRef]
34. Fernandes, A.; Woudstra, T.; van Wijk, A.; Verhoef, L.; Aravind, P. Fuel cell electric vehicle as a power plant and SOFC as a natural gas reformer: An exergy analysis of different system designs. Appl. Energy2016,
173, 13–28. [CrossRef]
35. Lee, Y.D.; Ahn, K.Y.; Morosuk, T.; Tsatsaronis, G. Exergetic and exergoeconomic evaluation of an SOFC-Engine hybrid power generation system.Energy2018,145, 810–822. [CrossRef]
36. Hosseinpour, J.; Chitsaz, A.; Eisavi, B.; Yari, M. Investigation on performance of an integrated SOFC-Goswami system using wood gasification. Energy2018,148, 614–628. [CrossRef]
37. Peters, R.; Blum, L.; Deja, R.; Hoven, I.; Tiedemann, W.; Küpper, S.; Stolten, D. Operation experience with a 20 kW SOFC system. Fuel Cells2014,14, 489–499. [CrossRef]
38. Bloom Energy Corporation. Bloom Energy Server ES5—250 kW. Available online: https://www. bloomenergy.com/(accessed on 8 July 2018).
39. Noponen, M.; Hottinen, T.; Sandstrom, C. WFC20 Biogas Unit Operation. In Proceedings of the 9th European Solid Oxide Fuel Cell Forum, Lucerne, Switzerland, 29 June–2 July 2010; pp. 2–90.
40. Halinen, M.; Rautanen, M.; Saarinen, J.; Pennanen, J.; Pohjoranta, A.; Kiviaho, J.; Pastula, M.; Nuttall, B.; Rankin, C.; Borglum, B. Performance of a 10 kW SOFC demonstration unit. ECS Trans.2011,35, 113–120. 41. Halinen, M.; Pennanen, J.; Himanen, O.; Kiviaho, J.; Silvennoinen, P.; Backman, J.; Salminen, P.;
Pohjoisranta, A. Sofc Power 2007–2012 Project—The Finnish SOFC System Research Flagship. J. Fuel Cell Technol.2013,13, 32–39.
42. Payne, R.; Love, J.; Kah, M. Generating electricity at 60% electrical efficiency from 1–2 kWe SOFC products.
ECS Trans.2009,25, 231–239.
43. Suzuki, M.; Takuwa, Y.; Inoue, S.; Higaki, K. Durability verification of residential SOFC CHP system.
ECS Trans.2013,57, 309–314. [CrossRef]
44. Yoshida, H.; Seyama, T.; Sobue, T.; Yamashita, S. Development of residential SOFC CHP system with flatten tubular segmented-in-series cells stack.ECS Trans.2011,35, 97–103.
45. Mai, A.; Iwanschitz, J.; Schuler, A.; Denzler, R.; Nerlich, V.; Schuler, A. Hexis and the SOFC System Galileo 1000 N—Past, Present, Future. In Proceedings of the 11th European SOFC SOE Forum A, Lucerne, Switzerland, 1–4 July 2014; pp. 3–11.
46. Bucheli, O.; Bertoldi, M.; Modena, S.; Ravagni, A. Development and manufacturing of SOFC-based products at SOFCpower SpA.ECS Trans.2013,57, 81–88. [CrossRef]
47. Pfeifer, T.; Chakradeo, A.; Ahire, N.; Baade, J.; Barthel, M.; Dosch, C.; Näke, R.; Hartmann, M. Development of a SOFC Power Generator for the Indian Market. Fuel Cells2017,17, 550–561. [CrossRef]
48. Sturm, G.S.J.; Muñoz, A.N.; Aravind, P.V.; Stefanidis, G.D. Microwave-Driven Plasma Gasification for Biomass Waste Treatment at Miniature Scale.IEEE Trans. Plasma Sci.2016,44, 670–678. [CrossRef]
c
![Figure 1. Flow of the integrated plasma gasifier-gas cleanup-solid oxide fuel cell (SOFC) system.Reproduced with permission from [22], Copyright Elsevier, 2018.](https://thumb-us.123doks.com/thumbv2/123dok_us/144720.21864/4.595.84.509.242.331/figure-integrated-gasier-cleanup-reproduced-permission-copyright-elsevier.webp)


![Table 5. System performance of various stationary SOFC systems. Modified after [37].](https://thumb-us.123doks.com/thumbv2/123dok_us/144720.21864/14.595.125.470.327.493/table-performance-various-stationary-sofc-systems-modied.webp)
