1 Comparison Between SELEX And Single-Step Selection For The Identification Of Bivalent
Aptamers For Thrombin
Robert Wilson,1 Christian Bourne,1 Roy R. Chaudhuri,2 Richard Gregory,1 John Kenny1 and Andrew Cossins.1
1 Institute Of Integrative Biology, Liverpool University, Liverpool, UK.
2 Department Of Molecular Biology And Biotechnology, Sheffield University, Sheffield, UK
E-Mail: [email protected]
The identification of bivalent aptamers for thrombin by SELEX and single-step selection are compared using next generation (massively parallel) sequencing and motif finding informatics. Results show that similar aptamers are identified by both methods.
Nucleic acid aptamers are high affinity binding molecules that have applications in diagnostics, therapy and separation science. They are normally identified by screening combinatorial (randomized) libraries of typically 1012 – 1016 oligonucleotides for sequences that bind to a chosen target molecule by a process called SELEX (Systematic Evolution of Ligands by Exponential Enrichment) that consists of multiple cycles of selection and PCR amplification.1-3 In the selection step oligonucleotides compete for binding sites on the target molecule and in the amplification step the remaining pool of oligonucleotides is enriched with sequences that bind. The stabilities and/or affinities of aptamers based on natural nucleotide bases can be improved by incorporation of chemically modified bases, but these are more difficult to amplify. Aptamers based on locked nucleic acids (LNAs) would be more stable in vivo because they are resistant to nuclease enzymes, but when Vester and colleagues carried out 7 cycles of partitioning and amplification with a library that contained LNA bases they found the ratio of these bases to natural bases decreased in every cycle of amplification.4 Gold and colleagues have used SELEX to identify high affinity aptamers based on chemically modified DNA bases, but these bases must be reformatted onto natural bases for amplification and back onto modified bases for selection.5-7 These complications would be avoided if it was possible to identify aptamers without multiple cycles of selection and amplification.
2 virus particles attached to a solid support. The column was washed to eliminate weakly bound DNA and then physically cut into sections. DNA in the sections was amplified and pyrosequenced. While these methods show that aptamers can be identified by single-step selection they were not carried out in parallel with SELEX and therefore it is not known if they produce comparable results.
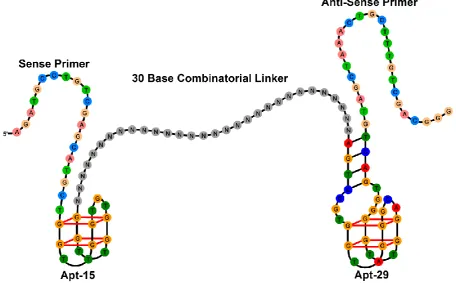
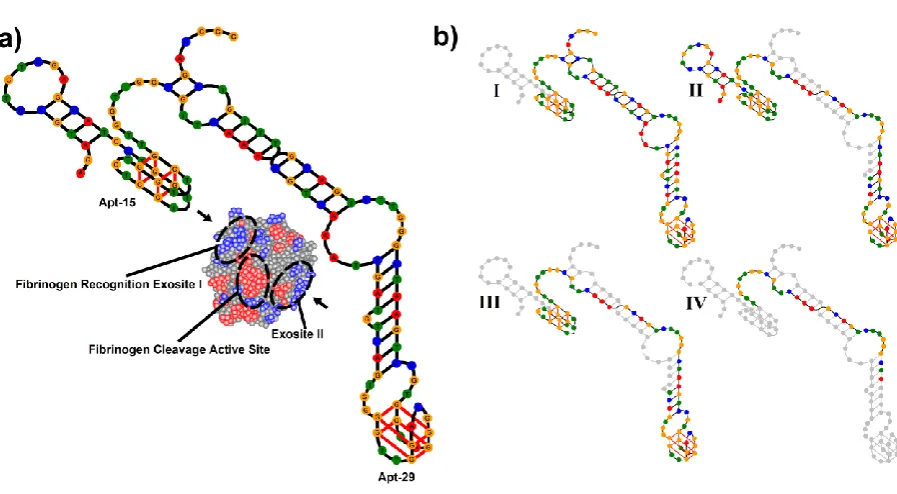
[image:2.595.69.526.430.713.2]In this paper we describe the parallel selection of bivalent aptamers for thrombin by SELEX and single-step selection. Thrombin is a multifunctional serine protease that plays important roles in blood clotting.12,13 The dominant structural feature of the 37 kDa protein is a deep negatively charged active site and adjacent hydrophobic pocket flanked at either-end by positively charged regions known as exosites I and II. Exosite I is the binding site for multiple macromolecular and low molecular weight ligands including fibrinogen, thrombomodulin, hiridin and heparin cofactor II, and exosite II is the binding site for heparin and platelet receptor GPIb-IX-V. Interactions between all three sites mediate blood clotting. DNA aptamers that bind to both exosites are known.14 Apt-15 (5’-GGTTGGTGTGGTTGG) binds to exosite I and inhibits the conversion of soluble fibrinogen to insoluble fibrin,15 and Apt-29 (5’-AGTCCGTGGTAGGGCAGGTTGGGGTGACT) binds to exosite II but only has a moderate effect on the conversion of fibrinogen.16 Mayer and colleagues have shown that the inhibition of blood clotting is enhanced when APT-15 is connected to higher affinity APT-29 by a 15 base poly-dA linker,17 and Soh and colleagues have shown that linkers identified by selection are superior to designed linkers.18
3 The structure of the DNA library screened for bivalent aptamers is shown in Figure 1. Individual oligonucleotides consist of a 30 base combinatorial (randomized) sequence bracketed by APT-15 and Apt-29, and primer sequences for PCR. The PCR primers used by us are the same as those used by Tassett and colleagues in the original selection of APT-29.16 Selection was carried out with magnetic beads coated with thrombin conjugated to biotin polyethylene glycol (biotin-PEG). Before conjugation thrombin was characterized with antibodies and aptamers, and by MS, electrophoresis and western blotting as described previously.14 PEG is a flexible linear polymer with low non-specific binding properties for biological molecules. The PEG used in this work had an extended length of approximately 3 nm; for comparison thrombin has dimensions of 4.5 x 4.5 x 5.0 nm.13 The conjugation method was designed to minimize the number of biotin-PEG molecules attached to each molecule of thrombin. Counter-selection was carried out with a mixture of beads consisting of equal amounts of uncoated streptavidin beads, beads coated with biotin-PEG and beads coated with human serum albumin (HSA). HSA was characterized and biotinylated in the same way as thrombin.
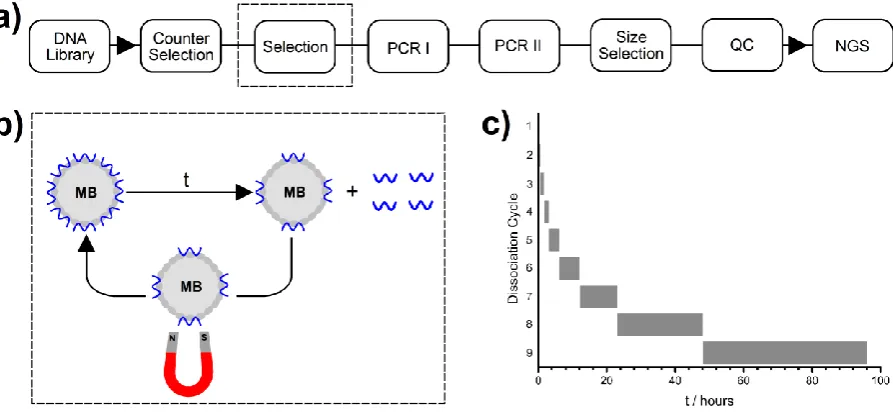
4 Figure 2 a) Scheme of single step selection. Key: size selection = preparative electrophoresis; QC = quality control; NGS = next generation sequencing. b) Detail of one cycle of dissociation. Thrombin-coated magnetic beads (MBs) with bound DNA are incubated for time t and then magnetically precipitated. DNA in the supernatant was extracted and fed into PCR I, and the MBs were re-suspended for a new cycle of dissociation. c) Bar-chart showing durations (t) of dissociation cycles.
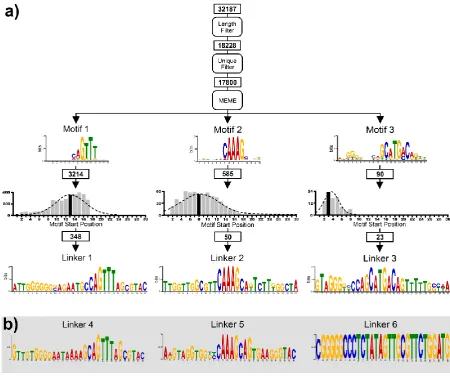
[image:4.595.76.523.74.280.2]5 Figure 3 a) Motif finding informatics as applied to DNA retained on the beads in single-step selection. Key: numbers in rectangles show the number of sequences at each stage in the pipeline. b) Linkers 4 -6 identified in round 5 of SELEX.
[image:5.595.72.523.71.450.2]6 sequences with motif divided by total number of sequences) and then the consensus of sequences with the motif located at the mean position was determined with Clustal Omega.24 Figure 3 shows that consensus sequences based on the two most abundant motifs (linkers 1 and 2) in the single step method are very similar to consensus sequences based on the two most abundant motifs (linkers 4 and 5) in SELEX. The consensus sequence based on the third most abundant motif in the single-step method (linker 3) is a blend of linkers 1 and 2. Figure 4 shows how the abundance of the motifs changed in each cycle of dissociation and each round of SELEX. In the single-step method most of the enrichment occurred in the last 4 cycles, but no peak was reached suggesting that further enrichment could be achieved by additional cycles. The initial increase of motifs 4 and 5 followed by a plateau is typical of SELEX,25 and shows that enrichment was complete after three or four rounds. Linker 6 is different; it was first detected at low (0.01%) abundance in Round 4 and then increased more rapidly than any other motif in Round 5.
Figure 4 Bar graphs showing enrichment of motifs in each cycle of single-step selection and each round of SELEX.
7 conditioned and incubated with 1 nM thrombin for one hour at 25oC. Then fibrinogen was added to a final concentration of 1 mg ml-1 and the increase in optical density (OD) was monitored at 340 nm. The increase had a sigmoid profile where the duration of the initial lag-phase is dependent on the concentration of the inhibitor (Figure S11; see supporting information). Plots of lag-phase against inhibitor concentration are shown in Figures S12-14 (see supporting information) and the aptamer concentrations required to produce half-maximal inhibition of thrombin (IC50 concentrations) are listed in Table 1. Thrombin inhibition assays are an indirect measure of binding to thrombin and therefore aptamers were also investigated in affinity assays. Thrombin was adsorbed on the walls of a multiwall plate and incubated with thermally conditioned aptamers modified at the 5’-end with biotin. After washing away unbound aptamers, the plate was incubated with streptavidin peroxidase for one hour and then with and tetramethylbenzidine/H2O2 solution. Color development was stopped after 10 minutes with 1M H2SO4 and the absorbance at 450 nm was determined. All aptamers except Apt-15 had affinities that were similar to their IC50 values as shown in Table 1. The lower affinity of APT-15 is probably because the inhibition assays were homogenous, but the affinity assays involved a series of incubations and washing steps. Apt-15 is known to have a faster dissociation rate constant than Apt-29,20-22 and therefore more dissociation during washing and incubation steps is expected.
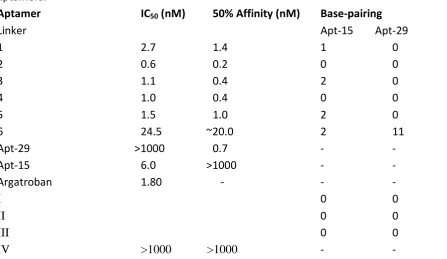
[image:7.595.73.522.416.663.2]8 Table 1 IC50 values, affinities and base pairing between scaffold and linker in bivalent aptamers.
Aptamer IC50 (nM) 50% Affinity (nM) Base-pairing
Linker Apt-15 Apt-29
1 2.7 1.4 1 0
2 0.6 0.2 0 0
3 1.1 0.4 2 0
4 1.0 0.4 0 0
5 1.5 1.0 2 0
6 24.5 ~20.0 2 11
Apt-29 >1000 0.7 - -
Apt-15 6.0 >1000 - -
Argatroban 1.80 - - -
I 0 0
II 0 0
III 0 0
IV >1000 >1000 - -
[image:8.595.75.523.100.359.2]9 double-stranded regions in the bivalent aptamers stabilize the stem of APT-29 and we suggest that this protects it from disruption during selection. Thus the two main properties selected are absence of internal conflict between the linker and the aptamers, and cooperation between the linker and APT-29 to protect the latter from inter-strand conflict during selection.
Our results show that single-step selection can produce similar results to SELEX. Further confirmation is provided by comparison with recent work by Soh and colleagues who started with a combinatorial library with the same general structure as in Figure 1, except that the combinatorial sequence had a length of 35 bases and the priming sequences were different.18 After 5 rounds of high-stringency SELEX they Sanger-sequenced 10 clones. They were unable to identify any consensus motifs (we would have reached the same conclusion if we had used Sanger sequencing instead of NGS) but like us they observed extensive base pairing between the scaffold We investigated the highest affinity bivalent aptamer identified by them (TBV-08) and found that it had an IC50 value of 0.64 nM, which is almost identical to the IC50 value of the bivalent aptamer based on linker 2 (see Table 2). When SELEX was discovered in 1990 the most effective way to determine which sequences had been selected was to clone them in bacteria and then sequence DNA from individual clones using first generation sequencing (Sanger sequencing), but it is now possible to sequence large numbers of DNA molecules in parallel using NGS. When combined with motif finding informatics this allows aptamers to be identified after fewer rounds of selection27 or even, as we have shown here, after a single selection step. We anticipate that in future this will make it easier to select aptamers with improved properties based on chemically modified nucleic acids.
References
[1] R. Stoltenburg, C. Reinemann, B. Strehlitz, Biomol. Eng. 2007, 24, 381–403.
[2] M. Famulok, J.S. Hartig, G Mayer, G, Chem. Revs. 2007, 107, 3715-3743.
[3] G. Mayer, Angew. Chem. Int. Ed. 2009, 48, 2672–2689.
[4] H. Doessing, L.H. Hansen, R.N. Veedu, J. Wengel, B. Vester, Molecules 2012, 17, 13087-13097.
[5] L. Gold, D. Ayres, J. Bertino et al. Plos One 2010, 5, art no. e15004.
10
P. Natl. Acad. Sci. USA 2012, 109, 19971-19976.
[7] R. Wilson, J. Proteomics 2011, 74, 1852-1854.
[8] M. Berezowski, M. Musheev, A. Drabovich, S.N. Krylov, J. Am. Chem. Soc. 2006, 128, 1410-1411.
[9] A. Nitsche, A. Kurth, A. Dunkhorst, O. Pänke, H. Sielaff, W. Junge, D. Muth, F. Scheller, W. Stöcklëin, C. Dahmens, G. Pauli, A. Kage, BMC Biotechnol. 2007, 7, art. no. 48.
[10] S. Arnold, G. Pampalakis, K. Kantiotou, D. Silva, C. Cortez, S. Missailidis, G. Soitroupoulou, Biol. Chem. 2012, 393, 243-353.
[11] L.H. Laurisden, H.A. Shamaileh, S.L. Edwards. E. Taran, R.N. Veedu, Plos One 2012, 7, art. no. e41702.
[12] W. Bode, Blood Cell. Mol. Dis. 2006, 36, 122–130
[13] M.T. Stubbs, W. Bode, Thromb. Res. 1993, 69, 1-58.
[14] R. Wilson, A. Cossins, D.V. Nicolau, S. Missailidis, Nucleic Acid. Ther. 2013, 23, 88-92.
[15] L.C. Bock, L.C. Griffin, J.A. Latham, E.H. Vermaas, J.J. Toole, Nature 1992, 355, 564-566.
[16] D.M. Tasset, M.F. Kubik and W. Steiner, J. Mol. Biol. 1997, 272, 688-698.
[17] J. Müller, B. Wulffen, B. Pötzsch, G. Mayer, Chembiochem 2007, 8, 2223-2226.
[18] K.M. Ahmad, Y. Xiao, H.T. Soh, Nucleic Acid. Res. 2012, 40, 11777-11783.
[19] R. Wilson, Nucleic Acid Ther. 2011, 21, 437-440.
[20] H. Hasegawa, K.I. Taira, K. Sode, K. Ikebukero, Sensors 2008, 8, 1090-1098.
[21] J. Müller, D. Freitag, G. Mayer, B. Pötzsch, J. Thromb. Hameostasis 2008, 6, 2105-2112.
[22] A. Pinto PhD Thesis - Universitat Rovira i Virgili 2012, p44.
[23] T.L. Bailey, C. Elkan, Proceedings of the Second International Conference on Intelligent Systems for Molecular Biology, 1994, 28-36, AAAI Press, Menlo Park, California.
[24] F. Sievers, A. Wilm, D. Dineen, T.J. Gibson, K. Karplus, W. Li, R. Lopez, H. McWilliam, M. Remmert, J. Söding, J.D. Thompson, D.G. Higgins, Mol. Syst. Biol. 2011, 7, art. no. 539.
11 [26] M. Zuker, Nucleic Acid. Res. 2003, 31, 3406-3415.
[27] M. Cho, Y. Xiao, J. Nie, R. Stewart, A.T. Csordas, S.S. Oh, J.A. Thomson, H.T. Soh, P. Natl. Acad. Sci. USA 2010, 107, 15373-15378.
Acknowledgment
Financial support for this work was provided by the United Kingdom's Biotechnology and
12 Supporting Information
Materials
Oligonucleotides (all HPLC purified), avidin, Type 1 Gel Loading Solution, 4-hydroxyazobenzene-2-carboxylic acid (HABA), human serum albumin (HSA), fibrinogen, salmon sperm DNA, poly(deoxyinosinic-deoxycytidilic) acid (poly-IC), 10 x TBE buffer and tetramethylbenzidine (TMB) solution containing 0.006 % H2O2 were from Sigma. All as-supplied oligonucleotides were characterized by UV/vis spectroscopy using ODs returned by OligoCalc (http://www.basic.northwestern.edu/biotools/OligoCalc.html)S1 and PAGE. In general short oligos had concentrations that were in agreement with the supplier’s data sheet, but long oligos were typically 10% less concentrated. PAGE with silver-staining of aptamers showed single bands of the correct size. 4-(2-hydroxyethyl)piperazine-1-ethanesulfonic acid (HEPES), NaCl, NaHCO3, NaOH, NaHPO4, KCl, MgCl2, CaCl2, sodium citrate, bovine serum albumin (BSA), water and Tween-20 (all molecular biology grade) were also from Sigma. Thrombin (3068 NIH units mg-1) was from Enzyme Research Laboratories, Swansea, UK.S2 MyOne streptavidin magnetic beads and Charge Switch magnetic beads were from Life Technologies. MyTaq HS DNA Polymerase and Reaction Buffer were from Bioline. The MinElute PCR Purification Kit was from Qiagen. EZ-Link NHS-PEG12-Biotin (biotin-PEG-NHS) and 7k MWCO Zeba Spin Desalting Columns were from Thermo Scientific. 1.5 ml DNA Lo-Bind tubes were from Fisher Scientific. Streptavidin Peroxidase was from Abcam, Cambridge, UK. Mini-PROTEAN TGX Precast gels were from Bio-Rad. The PlusOneTM DNA Silver Staining Kit was from GE Healthcare.
Equipment
UV/vis spectra were recorded on a Hewlett Packard 8452A Diode Array Spectrophotometer. Magnetic separations were carried out with either DynaMagTM-50 magnet or a DynaMagTM -2 magnet (both Life Technologies), and slow-tilt rotation was carried out with an MX-2 sample mixer (Life Technologies). DNA of defined length was extracted from PCR products with a Pippin Prep preparative electrophoresis platform (Sage Science). Extracted DNA was characterized with a Qubit 2.0 Fluorometer (Life Technologies) and Bioanalyzer 2100 (Agilent). Thrombin affinity and inhibition assays were carried with a Benchmark microplate reader (Biorad).
Biotin-PEG-Thrombin
13 solution increases the pH to 8.0 and initiates aminolysis of the NHS when the solution is homogenous. After gentle mixing for 1 hour, biotinylated thrombin was purified on a Zeba spin-column with water as the eluant. The concentration of thrombin in the eluate was determined using an extinction coefficient of E280 1% = 18.3. HSA was biotinylated in the same way (E280 1% = 5.31).
Biotin Assay
HABA was dissolved in 10 mM NaOH to a final concentration of 2.42 mg ml-1. Avidin was dissolved in 50 mM sodium phosphate buffer, pH 6.0, containing 0.15 M NaCl to a final concentration of 0.5 mg ml-1. A 50 µM solution of biotin was prepared in 50 mM sodium phosphate buffer. A calibrator solution was prepared by adding 61.52 µl of HABA solution to 2.4 ml of avidin solution. A calibration graph was prepared by measuring the absorbance at 500 nm 10 minutes after adding 2 µl increments of biotin solution to 100 µl of calibrator solution. The concentration of biotin in biotinylated thrombin was determined by measuring the decrease in absorbance at 500 nm 10 minutes after adding 5 µl of purified biotin– thrombin to 100 µl of calibrator solution.
Magnetic Beads For Selection And Counter Selection
MyOne streptavidin magnetic beads (Invitrogen) were washed in HEPES buffer (40mM HEPES, 125 mM NaCl, 5 mM KCl, 1 mM, MgCl2, 1 mM CaCl2, 0.05% Tween-20, pH 7.5) and slow-tilt rotated for 1 hour with biotin-PEG-thrombin in HEPES buffer at a concentration of 40 μg of thrombin per mg of beads. Then the beads were washed with 4 x 1 ml of HEPES. HSA beads were prepared by rotating beads with biotin-PEG-HSA in the same way. PEG beads were prepared by rotating beads with biotin-PEG-COO- (biotin-PEG-NHS that had previously been incubated in 1 M sodium bicarbonate solution overnight to hydrolyze the NHS ester.
Single-Step: Counter Selection And Selection
14 beads were precipitated with a DynaMagTM-50 magnet and transferred to a DNA Lo-Bind tube in 1 ml of HEPES buffer and immediately precipitated with a DynaMagTM-2 magnet. The supernatant was discarded and the beads were washed with 3 x 1 ml of HEPES. The beads were them suspended in beads 1 ml of HEPES and immediately precipitated with the supernatant retained as Supernatant 1. Other supernatants were obtained in the same way at the times listed in Table S1. After removing Supernatant 9 the beads were suspended in 400 µl of water and retained.
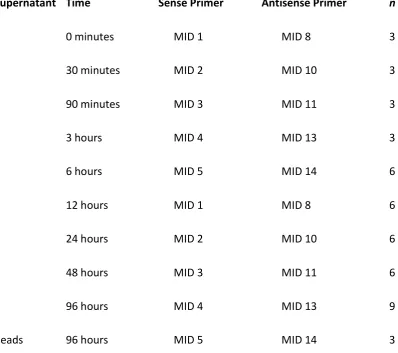
Table S1 Times at which supernatants were collected in single-step selection, barcodes of sequencing primers (see Table 4) that were used to amplify DNA from these supernatants, and number of nested PCR cycles (n) used to attach primers (see Table S3 for sequences of primers) for sequencing.
Supernatant Time Sense Primer Antisense Primer n
1 0 minutes MID 1 MID 8 3
2 30 minutes MID 2 MID 10 3
3 90 minutes MID 3 MID 11 3
4 3 hours MID 4 MID 13 3
5 6 hours MID 5 MID 14 6
6 12 hours MID 1 MID 8 6
7 24 hours MID 2 MID 10 6
8 48 hours MID 3 MID 11 6
9 96 hours MID 4 MID 13 9
Beads 96 hours MID 5 MID 14 3
Single-Step: Extraction Of DNA From Supernatants
[image:14.595.78.477.296.649.2]15 Single-Step: PCR Amplification Of DNA From Supernatants
20 µl aliquots of Tris buffer from charge-switch beads were mixed with 50 µl of PCR solution I containing primers and Reaction Buffer, and 30 µl polymerase solution containing 5 units of DNA Polymerase in molecular grade water to give final concentrations of 1 x Reaction Buffer (1 mM dNTPs, 3 mM MgCl2) and 1 µM primers (sense primer: 5’-AGATGCCTGTCGAGCATGCT; antisense primer: biotin-5’-CCCGTCGACAAAGCAGTTTAGCTAC). The mixture was then amplified (60s at 95oC; 20 cycles of 95oC for 15 seconds, 60oC for 15 seconds, 72oC for 10 seconds; final extension at 72oC for 60s). PCR products were characterized by mixing 4:1 with loading buffer followed by electrophoresis of 10 μl aliquots on 15% polyacrylamide gels in TBE buffer for one hour at 200V, and silver-staining with a PlusOneTM DNA Silver Staining Kit according to the supplier’s instructions.
Single-Step: PCR Amplification Of DNA Retained On Magnetic Beads
20 µl aliquots of beads in water were mixed with 50 µl of PCR solution I. The mixture was heated to 95oC for 15 minutes and then cooled to 50oC for five minutes. Then the solution was mixed with 30 µl of polymerase solution and amplified (60s at 95oC; 15 cycles of 95oC for 15 seconds, 60oC for 15 seconds, 72oC for 10 seconds; final extension at 72oC for 60s). Products were characterized by electrophoresis.
SELEX: First Round Selection
5 nanomoles of thermally conditioned library template in 0.5 ml of HEPES buffer was added to 49.5 ml of selection buffer containing 200 µg of thrombin beads and rotated for one hour at room temperature. The beads were then precipitated for one hour on a DynaMagTM-50 magnetic separator and washed with 4 x 1 ml HEPES buffer on a DynaMagTM-2 magnetic separator. The beads were then re-suspended in 340 µl of molecular grade water.
SELEX: PCR Amplification Of DNA Retained On Magnetic Beads In First Round Selection Step
20 µl aliquots of beads in water were mixed with 50 µl of PCR solution I. The mixture was heated to 95oC for 15 minutes and cooled to 50oC for 5 minutes. Then 30 µl of polymerase solution was added and the mixture amplified (60s at 95oC; 20 cycles of 95oC for 15 seconds, 60oC for 15 seconds, 72oC for 10 seconds; final extension at 72oC for 60s).
SELEX: Strand Separation Of PCR Products
16 described previously.S3 The yield of single-stranded DNA was estimated using an OD of 1.0 for 0.786 µM solution.
SELEX: Second And Fourth Round Selection Steps
Thermally conditioned ssDNA was mixed with B µg of thrombin beads in selection buffer; the amounts of beads in mg and concentrations of DNA are listed in Table S2. The mixture was rotated for one hour and then the beads were precipitated and washed with 4 x 1 ml HEPES on a DynaMagTM-2 magnetic separator. The beads were then re-suspended in 2B µl of molecular grade water.
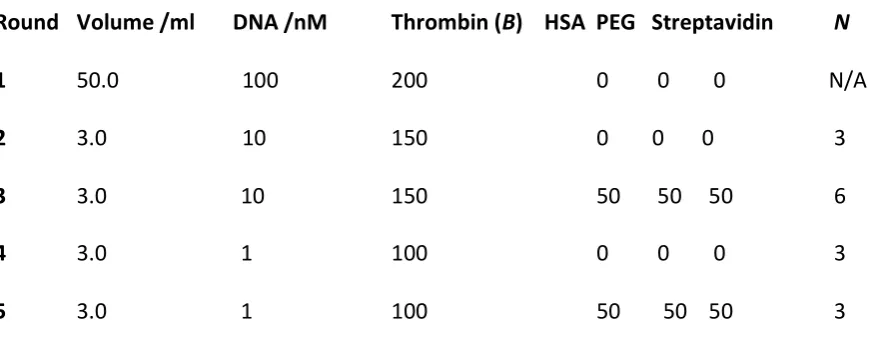
Table S2 SELEX: Concentrations of DNA, magnetic beads and number of additional PCR cycles. ……… Beads / μg ………
Round Volume /ml DNA /nM Thrombin (B) HSA PEG Streptavidin N 1 50.0 100 200 0 0 0 N/A
2 3.0 10 150 0 0 0 3
3 3.0 10 150 50 50 50 6
4 3.0 1 100 0 0 0 3
5 3.0 1 100 50 50 50 3
SELEX: Third And Fifth Round Selection Steps
The method was identical to even numbered selection rounds except that single-stranded DNA was first rotated with a counter-selection mixture of HSA beads, PEG beads and streptavidin beads; the amounts of beads are listed in Table S2. After one hour counter-selection beads were removed by magnetic precipitation and the supernatant was mixed with thrombin beads and rotated for one hour.
SELEX: PCR Amplification Of DNA Retained On Magnetic Beads In Second And Subsequent Selection Rounds
PCR amplification was carried out in two stages. In the first stage 20 µl aliquots of thrombin beads in water from the selection step were mixed with 50 µl of PCR solution I, heated to 95oC for 15 minutes and cooled to 50oC for 5 minutes. Then 30 µl polymerase solution was added and the mixture was amplified (60s at 95oC; 10 cycles of 95oC for 15 seconds, 60oC for 15 seconds, 72oC for 10 seconds; final extension at 72oC for 60s). PCR products were pooled and in the second stage 20 µl aliquots were added to 50 µl of PCR solution I and 30 µl polymerase solution and amplified (95oC for 60s; N cycles (Table S2): 95oC for 15s, 60oC for 15s, 72oC for 10s; final extension at 72oC for 60s.
[image:16.595.75.511.257.437.2]17 20 µl aliquots of PCR I products were mixed with 50 µl of PCR solution II containing 454 sequencing primers (Table S3) and Reaction Buffer, and 30 µl polymerase solution containing 5 units of DNA Polymerase in molecular grade water to give final concentrations of 1 x Reaction buffer and 1 µM primers. The mixture was then amplified (60s at 95oC; n cycles (Tables S1 [single-step] and S5 [SELEX]) of 95oC for 15 seconds, 60oC for 15 seconds, 72oC for 10 seconds; final extension at 72oC for 60s). PCR products were transferred to 10 mM Tris buffer using a MinElute PCR Purification Kit and 189 bp DNA was isolated with a Pippin Prep running a 2% agarose cassette. Isolated DNA was transferred back into 20 µl of 10 mM Tris buffer using the MinElute kit, and characterized for size by micro-electrophoresis on a Bioanalyzer 2100, and concentration with a Qubit Fluorometer.
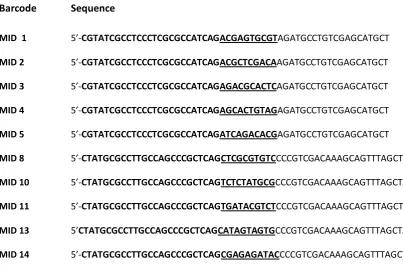
Table S3 Primers for nested PCR; 454 sequencing primers in bold type with MID sequences (barcodes) underlined.
Barcode Sequence
MID 1 5’-CGTATCGCCTCCCTCGCGCCATCAGACGAGTGCGTAGATGCCTGTCGAGCATGCT
MID 2 5’-CGTATCGCCTCCCTCGCGCCATCAGACGCTCGACAAGATGCCTGTCGAGCATGCT
MID 3 5’-CGTATCGCCTCCCTCGCGCCATCAGAGACGCACTCAGATGCCTGTCGAGCATGCT
MID 4 5’-CGTATCGCCTCCCTCGCGCCATCAGAGCACTGTAGAGATGCCTGTCGAGCATGCT
MID 5 5’-CGTATCGCCTCCCTCGCGCCATCAGATCAGACACGAGATGCCTGTCGAGCATGCT
MID 8 5’-CTATGCGCCTTGCCAGCCCGCTCAGCTCGCGTGTCCCCGTCGACAAAGCAGTTTAGCTAC
MID 10 5’-CTATGCGCCTTGCCAGCCCGCTCAGTCTCTATGCGCCCGTCGACAAAGCAGTTTAGCTAC
MID 11 5’-CTATGCGCCTTGCCAGCCCGCTCAGTGATACGTCTCCCGTCGACAAAGCAGTTTAGCTAC
MID 13 5’CTATGCGCCTTGCCAGCCCGCTCAGCATAGTAGTGCCCGTCGACAAAGCAGTTTAGCTAC
MID 14 5’-CTATGCGCCTTGCCAGCCCGCTCAGCGAGAGATACCCCGTCGACAAAGCAGTTTAGCTAC
Table 4 SELEX: barcodes of sequencing primers (see Table S3) and numbers of nested PCR cycles used to attach sequencing primers.
Round Sense Primer Antisense Primer n
1 MID 1 MID 8 3
2 MID 2 MID 10 3
18
4 MID 4 MID 13 6
5 MID 5 MID 14 6
Motif Finding Informatics
Sequencing reads were sorted into sets by barcode and then processed by removing the 5’ and 3’ aptamer sequences using cutadapt.S4 Any trimmed sequences that were not 30 bases long were discarded. Duplicate sequences were also discarded in the single-step method, but not in SELEX. The remaining sequences were searched with MEME using the command line: meme ../file.txt -dna -maxsize 600000 -mod zoops -nmotifs 10 -minw 4 -maxw 40, where file.txt is a Plain Text file containing the sequences to be searched in numbered fasta format. MEME is a computational tool for discovering motifs in a group of related DNA or protein sequences. The on-line version imposes a ceiling of <2000 on the maximum number of 30 base sequences that can be searched and therefore it was downloaded onto a Linux machine. There is no upper limit to the number of sequences that can be searched locally with the downloaded version of MEME, but the computational cost of analyzing a complete set of sequences (all sequences from one cycle of single step selection, or one round of SELEX) with MEME is prohibitive and therefore sets of they were divided into sub-sets of ≤10,000 sequences to derive intermediate motifs. Each search of a sub-set produced slightly different but highly similar intermediate motifs. Sequences with similar motifs were extracted and merged in a single file that was searched to identify final motifs. The position of the final motifs in the 30 base sequence was plotted against abundance (number of sequences with motifs divided by the total number of sequences in the set) and then sequences with the motif located at the Gaussian mean were extracted. The consensus of the extracted sequences was found with Clustal Omega, and secondary structures were determined with mfold applying the conditions: 25oC, 125 mM NaCl and 1 mM MgCl.
Thrombin Inhibition Assays
Thermally conditioned aptamers (Table S5) in HEPES buffer were mixed with thrombin in HEPES buffer to a final concentration of 1 nM thrombin and allowed to stand for one hour at 25oC. 225 µl of this solution was added to the wells of a plate in triplicate and then 25 µl of fibrinogen in HEPES (centrifuged for 10 minutes at 10,000 x g immediately before addition) was added to each well to a final concentration of 1mg ml-1. Conversion of fibrinogen to fibrin at 25oC was monitored by measuring the increase in optical density at 350 nm.
Table S5 Sequences of aptamers investigated in affinity and inhibition assays; the sequences of APT-15 and APT-29 in bivalent aptamers are underlined.
19 5’-
AGATGCCTGTCGAGCATGCTGGTTGGTGTGGTTGGATTGGGGGGCAGAATGCCAGTTTAGCGTACA GTCCGTGGTAGGGCAGGTTGGGGTGACTGTAGCTAAACTGCTTTGTCGACGGG
Bivalent aptamer based on linker 2
5’-AGATGCCTGTCGAGCATGCTGGTTGGTGTGGTTGGTTGGTTGGCGTTCAAAGCAGTCTTGGGCTAA GTCCGTGGTAGGGCAGGTTGGGGTGACTGTAGCTAAACTGCTTTGTCGACGGG
Bivalent aptamer based on linker 3
5-AGATGCCTGTCGAGCATGCTGGTTGGTGTGGTTGGGTAGGGGCCCAGCATGACAGTTTTTGCCAAA GTCCGTGGTAGGGCAGGTTGGGGTGACTGTAGCTAAACTGCTTTGTCGACGGG
Bivalent aptamer based on linker 4
5’-AGATGCCTGTCGAGCATGCTGGTTGGTGTGGTTGGGTTGTGGGGAATAAAAGCAGTTTAGCGTACA GTCCGTGGTAGGGCAGGTTGGGGTGACTGTAGCTAAACTGCTTTGTCGACGGG
Bivalent aptamer based on linker 5
5’-AGATGCCTGTCGAGCATGCTGGTTGGTGTGGTTGGAAGTAGGTGGTTCAAAGCAGTGAAGGGTAC AGTCCGTGGTAGGGCAGGTTGGGGTGACTGTAGCTAAACTGCTTTGTCGACGGG
Bivalent aptamer based on linker 6
5’-AGATGCCTGTCGAGCATGCTGGTTGGTGTGGTTGGCGGGGGCCCTCTATAGTTGCGTTCTGGATGA GTCCGTGGTAGGGCAGGTTGGGGTGACTGTAGCTAAACTGCTTTGTCGACGGG
TBV-08
5’-AGCAGCACAGAGGTCAGATGGGTTGGTGTGGTTGGTGAGACCTTGCATGCGACTTGGTGAGCACGT GAGAAGTCCGTGGTAGGGCAGGTTGGGGTGACTCCTATGCGTGCTACCGTGAA
Apt-15
5’-GGTTGGTGTGGTTGG
Apt-29
5’-AGTCCGTGGTAGGGCAGGTTGGGGTGACT
20
5’-GGTTGGTGTGGTTGGTTGGTTGGCGTTCAAAGCAGTCTTGGGCTAAGTCCGTGGTAGGGCAGGTTG GGGTGACTGTAGCTAAACTGCTTTGTCGACGGG
Bivalent aptamer based on linker 2 minus antisense primer
5’-AGATGCCTGTCGAGCATGCTGGTTGGTGTGGTTGGTTGGTTGGCGTTCAAAGCAGTCTTGGGCTAA GTCCGTGGTAGGGCAGGTTGGGGTGACT
Bivalent aptamer based on linker 2 minus sense and antisense primers
5’-GGTTGGTGTGGTTGGTTGGTTGGCGTTCAAAGCAGTCTTGGGCTAAGTCCGTGGTAGGGCAGGTTG GGGTGACT
Linker 2
5’-TTGGTTGGCGTTCAAAGCAGTCTTGGGCTA
Aptamer Affinity Assays
Multiwell plates (Nunc Maxisorp) were coated overnight at 4oC with 100 µl per well of 0.5 µg ml-1 thrombin in PBS. Wells were washed with 3 x 250 µl of 40 mM HEPES, pH 7.5, containing 0.05% Tween-20 (HEPES-Tween) and blocked for one hour at 25oC by gentle shaking with 250 µl per well HEPES-Tween containing 1 mg ml-1 BSA and 0.1 mg ml-1 salmon sperm DNA. Wells were washed with 3 x 250 µl of HEPES-Tween and then 100 µl of thermally conditioned 5’-biotin aptamer (Table S5) in HEPES buffer was incubated in the wells for one hour with shaking. Wells were washed with 3 x 250 µl of HEPES-Tween and then 100 µl of streptavidin peroxidase diluted 1:100 in HEPES-Tween was incubated in the wells for one hour with shaking. Wells were washed with 4 x 250 µl HEPES-Tween and then 200 µl of TMB solution was incubated in the wells with shaking for 10 minutes (20 minutes for Apt-15). The enzyme reaction was stopped by addition of 50 µl per well of 1M H2SO4 and the absorbance was measured at 450 nm.
Supplementary Results
Biotin-Thrombin
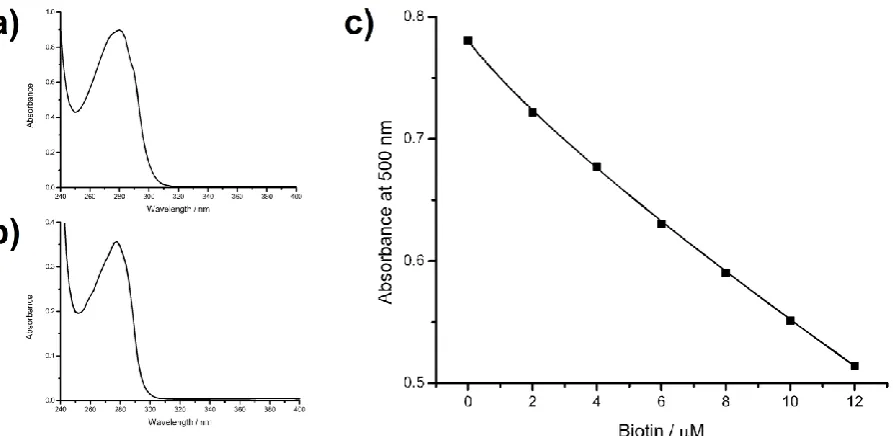
21 Figure S1 a) UV/vis spectrum of biotin-PEG-thrombin. b) UV/vis spectrum of biotin-PEG-HSA. c) Calibration curve for HABA-avidin with biotin.
Biotin Assay
The calibration curve for biotin with avidin and HABA is shown in Figure S1c; addition of 10 µl of undiluted biotin-PEG-thrombin to 100 µl of HABA-avidin solution produced a 4.8 µM solution of thrombin and absorbances at 500 nm of: 1) 0.689; 2) 0.692. Reading from the calibration curve the decrease in absorbance corresponds to a biotin concentration of 3.3 µM and therefore the molar ratio of biotin to thrombin was 0.69:1. Therefore some molecules of thrombin were not conjugated to biotin, but the remaining molecules were conjugated to a low ratio of biotin-PEG. Addition of biotin-PEG-HSA to HABA-avidin solution showed that the ratio of biotin to HSA was 0.84:1.
Single-Step Selection
[image:21.595.78.525.71.289.2]22 Figure S2 15% poly-acrylamide gel developed at 200 V for one hour and stained with silver. Key: Lanes 1-9 show PCR products from supernatants 1–9; Lane 10 shows PCR products from DNA retained on beads.
SELEX
The workflow for SELEX is shown in Figure S3. PCR of combinatorial libraries occurs in two phases.S5 In the first phase products of the correct length are produced and in the second phase these products disappear accompanied by the formation of longer products that appear as a smear in PAGE.
Figure S3 Scheme of SELEX. Key: size selection = preparative electrophoresis; QC = quality control; NGS = next generation sequencing.
[image:22.595.70.525.580.738.2]23 Figure S4 a) 15% poly-acrylamide gel developed at 100 V for two hours and stained with silver showing PCR products from Round 2 of SELEX; products produced by +3 cycles of PCR (red rectangle) were selected for preparative electrophoresis. Key: L = 20 bp ladder; white numerals = number PCR cycles where 10 is the product of the first stage PCR, and +3, +6, +9, +12 and +15 are the products of the second stage PCR. b) Results of preparative electrophoresis showing band centered on 119 bp that was extracted surrounded by white rectangles. Key: white numerals indicate lane numbers (lane 5 has calibrator DNA of lengths 20, 75, 150, 300 and 600 bp); screen E shows ethidium bromide fluorescence versus time; screen G shows a fluoresce image of the developed agarose gel.
Preparation Of Single-Step And SELEX Samples For Sequencing
454 sequencing primers were attached by nested PCR of as shown in Figure S5a. PCR trials were carried out to determine the number of cycles that produced a band at 189 bp with minimal non-specific products as shown in Figure S5b. PCR products amplified for this number of cycles were transferred into Tris buffer and then a band centered on 189 bp was extracted by preparative electrophoresis as shown in Figure S5c. The concentrations of extracted products are shown in Table S6 (single-step) and S7 (SELEX) and size profiles of extracted products are show in Figure S6 (single-step) and Figure S7 (SELEX).
[image:23.595.72.524.394.675.2]24 rectangle were selected for preparative electrophoresis. Key: L = 20 bp ladder; white numerals = number of nested PCR cycles. c) Preparative electrophoresis on lanes 1 – 4 with extraction of a band centered on 189 bp (enclosed in white rectangle). Key: white numerals indicate lane numbers (lane 5 has calibrator DNA of lengths 20, 75, 150, 300 and 600 bp); screen E shows ethidium bromide fluorescence versus time; screen G shows a fluoresce image of the developed agarose gel.
Table S6 Concentrations of DNA in sequencing samples from single-step selection.
Cycle ng/µl Cycle ng/ µl
1 56.4 6 59.9
2 53.9 7 18.4
3 31.7 8 44.6
4 30.5 9 72.6
5 13.4 Beads 73.2
Table S7 Concentrations of DNA in sequencing samples from SELEX.
Round ng/ µl
1 81.0
2 48.6
3 23.7
4 85.8
25 Cycle 6
35 bp
10350 bp
Cycle 8
35 bp 10350 bp
Beads
3 5 b p 1 0 3 5 0 b p
Cycle 4
35 bp 10350 bp
Cycle 1
35 bp
10350 bp
Cycle 3
Cycle 5
35 bp
10350 bp
Cycle 7
35 bp
10350 bp
Cycle 9
35 bp
10350 bp Cycle 2
35 bp 10350 bp
189 bp 189 bp 189 bp
189 bp 189 bp 189 bp
189 bp 189 bp 189 bp
1 8 9 b p
35 bp
[image:25.595.73.528.63.629.2]10350 bp
26 Round 1
35 bp
10350 bp
Round 2
35 bp 10350 bp
Round 3
35 bp
10350 bp
35 bp
10350 bp Round 4
35 bp
10350 bp
Round 5
35 bp
10350 bp
189 bp 189 bp 189 bp
189 bp 189 bp
Figure S7 Micro-electrophoresis size-profiles of samples from SELEX that were sequenced. Peaks at 35 bp and 10,350 are internal calibrators.
Lowest Energy Secondary Structures
[image:26.595.74.520.67.350.2]29 Figure S10 Lowest energy secondary structures of bivalent aptamers based on linkers 4 and 5. Nucleotides of Apt-15 are shown in red font and nucleotides of Apt-29 are shown in blue font.
Thrombin Inhibition Assays
30 Figure S11 a) Traces showing effect of Apt-15 on increase in OD at 350 nm due to thrombin-catalyzed conversion of fibrinogen to fibrin. Key to Apt-15 concentrations from shortest to longest lag phase: 1 nM; 10 nM; 13.3 nM; 100 nM; 1000 nM. b) Trace for thrombin in the presence of 13.3 nM Apt-15 showing how the duration of the lag-phase was determined by projecting the intersection of the base-line OD and the slope of the exponential phase onto the X-axis (red arrow). c) Inhibition curve of Apt-15 showing how IC50 was determined by projecting 50% inhibition onto the X-axis (red arrow)
[image:30.595.299.524.357.514.2]
32 Figure S14 Inhibition curves of bivalent aptamer TBV-08 and argatroban.
Figure S15 Inhibition curves of truncated derivatives of the bivalent aptamer based on linker 2.
Aptamer Affinity Assays
The scheme of a competed assay is shown in Figure S16a. Absorbance values due to color development at 450 nm were plotted against the log10 of the aptamer concentrations as shown for Apt-29 in Figure S16b. Concentrations corresponding to 50% affinity were determined by projecting 50% absorbance onto the X-axis as shown for Apt-29 in Figure S16b. Affinity curves for Apt-29 and Apt-15 are shown in Figure S17. Affinity curves for bivalent aptamers based on linkers 1–6 are shown in Fig S18. Affinity curves for truncated derivatives of the bivalent aptamer based on linker 2 are shown in Figure S19.
[image:32.595.80.525.487.641.2]34 Figure S18 Affinity curves of bivalent aptamers.
Figure S19 Affinity curves of truncated derivatives of the bivalent aptamer based on linker 2.
Supplementary References
[S1] W.A. Kibbe, Nucleic Acids Res. 2007, 35 (Suppl. 2), W43-W46
[S2] R. Wilson, A. Cossins, D.V. Nicolau, S. Missailidis, Nucleic Acid. Ther. 2013, 23, 88-92.
35 [S4] M. Martin, EMBnet.journal 2011, 17.1, 10-12.