This is a repository copy of Identifying Traffic Problems in a Heavily Trafficked Urban Environment– Reference to Sowerby Bridge.
White Rose Research Online URL for this paper: http://eprints.whiterose.ac.uk/2295/
Monograph:
Hopkinson, P.G., May, A.D., Berrett, B. et al. (1 more author) (1987) Identifying Traffic Problems in a Heavily Trafficked Urban Environment– Reference to Sowerby Bridge. Working Paper. Institute of Transport Studies, University of Leeds , Leeds, UK. Working Paper 263
[email protected] https://eprints.whiterose.ac.uk/
Reuse See Attached Takedown
If you consider content in White Rose Research Online to be in breach of UK law, please notify us by
White Rose Research Online
http://eprints.whiterose.ac.uk/
Institute of Transport Studies University of Leeds
This is an ITS Working Paper produced and published by the University of Leeds. ITS Working Papers are intended to provide information and encourage discussion on a topic in advance of formal publication. They represent only the views of the authors, and do not necessarily reflect the views or approval of the sponsors.
White Rose Repository URL for this paper:
http://eprints.whiterose.ac.uk/2295/
Published paper
Hopkinson, P.G., May, A.D., Berrett, B., Leake, G.R. (1987) Identifying Traffic
Problems in a Heavily Trafficked Urban Environment– Reference to Sowerby Bridge. Institute of Transport Studies, University of Leeds. Working Paper 263
Working Paper 263
May
1987
IDENTIFYING TRAFFIC PROBLEMS
IN A HEAVILY TRAFFICKED
URBAN
ENVIRONMENT
-
REFERENCE TO SOWERBY BRIDGE
P
G
Hopkinson,
A
D
May,
B Berrett, G R Leake
ITS Working Papers are intended to provide information and encourage discussion on a topic in advance of formal publication. They represent only the views of the authors, and do not necessarily reflect the views or approval of the sponsors.
C O N T E N T S
1. IDENTIFICATION OF PROBLEMS
1.1 Background
1.2 Introduction
1.3 Study Boundary
2. APPROACH TO STUDY
2.1 Introduction
2.2 Targeted Groups
2.3 viewpoints
2.4 Method of Elicitation
3. SURVEY DESIGN
3.1 Pedestrians
3.2 Retailers/Businesses
3.3 Workers
3.4 Road Users
3.5 Interest Groups
4. PHYSICAL DATA COLLECTION
4.1 Introduction
4.2 Traffic Flow Movements
4.3 Traffic Movements Through Town
4.4 Parking Data
5. SURVEY FINDINGS
5.1 Pedestrians
5.1.1 Sample Characteristics
5.1.2 Perceived Likes/Dislikes About Sowerby Bridge
5.1.3 Pedestrians Assessment of Road Crossing Conditions
5.1.4 Pedestrians Assessment of Overall Street Conditions
5.2 Retailers
5.2.1 Perceived Likes/Dislikes About Sowerby Bridge
5.2.2 Parking
5.2.3 servicing of shops
5.2.4 Journeys as Part of Work
5.2.5 Pedestrians Access
5.2.6 Nuisance Indoors
5.3 Workers
5.3.1 Perceived Likes and Dislikes
5.3.2 Journeys To/From Work
5.3.3 Journeys-from Buildings on Foot
5.4 Road Users
5.4.1 Journey Purpose
5.4.2 Origins and Destinations
5.4.3 Problems Driving Through Sowerby Bridge
5.4.4 Alternative Routes
6. INTERPRETING MAIN STATED PROBLEMS
6.1 Main Problems Identified
6.2 Methodological Conclusions
6.2.1 Introduction
6.2.2 Methods Used to Elicit Viewpoints
6.2.3 On-Street Interviews
6.2.4 Self-completion Questionnaires
6.2.5 Household Interviews
6.3 Problem Structuring
6.3.1 Final Comments
7. PHYSICAL MEASURES OF PROBLEMS
7.1 Origin-Destination Results
7.2 Traffic Flow Characteristics
7.2.1 conclusions
7.3 Traffic Turning Movements
7.4 Pedestrian Activity in Sowerby Bridge
7.4.1 Pavement Flow
7.4.2 Pavement Widths
7.4.3 Crossing Flows
7.4.4 Conclusions
7.5 Parking in Sowerby Bridge
7.5.1 Off-Street Parking
-
Demand forparking spaces
7.5.2 On-Street Parking
1.1 BACKGROUND
This study was commissioned by the Civic Trust to identify new approaches to traffic management solutions for Sowerby Bridge. The objective of the overall study was to identify low cost, innovative solutions to problems created by high volumes of traffic using the A58. This road is the main shopping street in
Sowerby Bridge. In our brief it was stressed that any new road
construction such as a by-pass was not a feasible or acceptable solution due to the severe vertical gradients surrounding Sowerby Bridge.
Further, the town is on the brink of a major programme of
regeneration. A nationally important canoe slalom has been
created; the riverside mill area fronting onto the River Calder is being developed for commercial and leisure use and there is a proposal to reopen the Rochdale Canal. In view of this it is essential to ensure that traffic on the A58 is managed so as to minimise its effect on the environment and trade, without adversely affecting local access. In writing our report we have
separated the problem and solution identification stages. The
solution identification stage is reported in a companion report (Hopkinson et all 198833). A further stage of our study which involves presenting our final solutions back to the users of Sowerby Bridge for comment is to be reported in a forthcoming report, WP 265 (Hopkinson et al, 1988~).
1.2 INTRODUCTION
This Working Paper describes the methods used and findings from the first stage of our study carried out during October and November 1987 to identify the problems experienced by the users of Sowerby Bridge. Here it is intended to draw conclusions about
the approach adopted to elicit people's impressions about
problems, the way in which this information was interpreted and the applicability of the method to other situations.
1.3 STUDY BOUNDARY
The boundary for identifying problems was set between Watson Mill Lane and the junction of Bolton Brow/Wakefield Road (see Figure
1). Our main concern was with traffic-related conditions along
the A58 and in buildings fronting onto the A58. Where problems were perceived particularly related to parking away from the A58 these were noted and included in our assessment. The definition of Sowerby Bridge for classifying the catchment area of the town
and local people is shown on Figure 1. Other towns and
settlements which generate through traffic are also shown.
2. APPROACH TO STUDY
2.1 INTRODUCTION
Figure 1: Studv Area and Important Surroundins Towns
To obtain the views of local people it was therefore necesseary to establish:
a) who to talk to;
b) the views to be elicited; c) the method of elicitation.
2.2 TARGETED GROUPS
It is a truism to state that the situation in which people experience 'trafficr will be an important factor on the concept of problems. A person driving through a street will perceive and experience different types of problems from a pedestrian for example. In order to capture as full a range of problems as possible in the first stage of our study it was necessary to consider which groups to target for obtaining views. A number of different target groups were initially drawn up. It was decided that our main concern was with groups who directly experience traffic conditions along the A58 either as pedestrians, in buildings or in vehicles.
It was therefore decided to approach the following for their views :
1) pedestrians 2) retailers
3) employees
4) interest groups
5) road-users
The first three categories were relatively straight-forward. A
decision to capture the views of car and commercial vehicle drivers only in the fourth category was made since it was felt that public transport users would be captured within the first three groups.
No specific targeting of sub-classes within each group was made although recording of potentially important characteristics in exploring differences in viewpoint, such as age, presence of children, home address was made when surveying.
2.3 PROBLEM IDENTIFICATION
Whilst various sources, including our own observations, had indicated to us the broad range of traffic-related problems in the town, it was decided that we should approach the survey design as if we were virtual strangers to Sowerby Bridge and with no pre-conceived ideas about 'problemsr and 'issuesr. Accordingly, the objective of the survey design was to allow people to describe to us the aspects of Sowerby Bridge they liked and disliked before moving into discussions about a range of broad problem areas that were likely to be relevant to our study. Under these broad topics it was decided to ask a range of specific factual questions requiring people to rate their opinions on a measured scale to denote their stength of feeling, but also to provide scope for general comments about any aspect of the issue which the respondent felt to be important.
-
similar term in the different methods adopted since we .wanted people to think about the town in their own terms rather than in terms of possible 'problemsf. A decision was also made to keep the structured questions as brief and as simple as possible and not to ask people to rank or rate the importance of the issues they identified or were presented with. This decision had major implications for the interpretation by the research team of the relative importance of different problems and the way in which information was summarised (see Section 2.6 and Methodological Conclusions). Having made these decisions the next stage of the study involved the design of the actual methods to elicit peoplefs views.
2.4 METHOD OF ELICITATION
Two methods of eliciting views from the different groups were possible within the time constraints of the first stage of the study: interviews and questionnaires. The most important considerations in selecting a method for a particular group were the feasibility of the method and the time constraints for completing the first stage of the study.
The methods and sampling approach for each group approach are discussed below.
3. SURVEY DESIGN
3.1 PEDESTRIANS
Initial consideration was given to using self-completion questionnaires to obtain pedestrians' views about conditions in Sowerby Bridge. To our knowledge this approach has not been used for this type of study. However such an approach requires considerably more time in design and organisation than an on- street interview. The Institute had just completed an extensive period of on-street interviewing of pedestrians and for this reason, as well as the shortage of time for developing a self- completion questionnaire for this group, an on-street interview approach was adopted.
The information which was considered to be relevant to the identification of problems experienced by pedestrians in Sowerby Bridge was:
(1) positive and negative impressions and overall assessment of the main shopping street
(2) locations where people crossed the A58 and assessment of the ease of crossing
( 3 ) assessment of times or days when conditions are worse
(4) reasons for and frequency of visiting Sowerby Bridge.
A sample size of 200 pedestrians was targeted. This was felt
likely to produce a reasonable cross-section of views.
Interviews were carried out at a range of locations along both
sides of the A58 to ensure that individuals who were unable or
chose not to visit different parts of the town would be included in the sample. Clearly by this approach we would not obtain the views of people who for whatever reason were unable or chose not to visit the town centre at all because of traffic related
conditions. A decision to carry out household interviews with
people registered as disabled was made to include the views of people who would be most likely to be discouraged or unable to visit the town centre (see interest groups).
On-street interviews were carried out with pedestrians at
different locations along the A58 between Bolton Brow and West
Street/Sowerby New Road. These interviews took place between
October 16th-27th. In total 213 interviews were achieved.
Interviews were carried out on both sides of the A58 to minimise
A self-completion questionnaire was designed for obtaining the views of people involved in retailing and businesses fronting onto the A58. This method was selected firstly because of the time constraints imposed on people in business during a normal working day and secondly because we wanted to establish the relative merits of this approach compared to a face to face interview. The information which was considered to be relevant to the identification of problems experienced by retailers/business in Sowerby Bridge was:
(1) positive and negative impressions and overall assessment of the main shopping strategy
(2) assessment of conditions for: servicing; customer access; parking; journeys as part of work
(3) times and days when premises most busy
(4) background information on the respondent such as method of travel to work etc.
Appendix 1 provides the self-completion questionnaire. The survey form was piloted at 5 premises. The piloting produced additions to the number and form of questions included in the questionnaire.
Self-completion questionnaires were delivered on 17th-24th October. A return visit was made on up to 3 occasions to collect the questionnaires. 54 questionnaires were completed.
Questionnaires were deposited at virtually every business address fronting onto the A58. Those responding to the questionnaire were made up of the following categories: Retail Outlets (food, clothes, hardware) 21; Services (Banks, Travel Agents, Estate Agents, Insurance Brokers) 14; Restaurants (including cafes, pubs) 9; Manufacturers/Engineering 6; Newsagents/Confectioners 5; Hairdressers 2. It was felt that this distribution provided a representative cross section of the businesses fronting onto the A58. There was no reason to indicate that non-completed questionnaires distorted the sample in any way.
In view of the relatively small scale of Sowerby Bridge a decision to try and deposit questionnaires at all premises fronting onto the A58 between Foundry Street and Bolton Brow was made, as well as a random selection of premises on side streets off the A58. These questionnaires were then left with the manager/owner or most senior staff member at the premises with a letter indicating the purpose of the study and the arrangements for picking up the completed questionnaires.
In practise a total of 37 out of 115 premises called at were not open, or could not be contacted during the two afternoon periods allocated to delivering the questionnaires. Of these 54 premises completed and returned a questionnaire.
3.3 WORKERS
As well as obtaining the views of people who own or run businesses in Sowerby Bridge the views of other people who work in buildings fronting onto the A58 and who might be expected to have different interests and perspectives on issues were obtained. These we termed workers. Hopefully, this will not be interpreted as derogatory of those people included in the previous group. For reasons similar to those explained under retailers a self-completion questionnaire was designed for obtaining workers' views. This was similar in many respects to the questionnaire used for retailers/businesses although obviously questions about servicing/customer access were excluded. A copy of the questionnaire is provided in Appendix 3.
A total of 60 questionnaires were deposited randomly at the same businesses and premises along and adjacent to the A58 as for the previous group. The questionnaire was given to the first "workertv met upon entering the premises or where the owner/manager was met then a request to speak to a full-time worker was made. Often in the smaller premises the owner/manager was the sole vvworker*l or else employed part-time workers. Hence the lower number of questionnaires distributed. Again a letter explaining the purpose of the survey and the arrangements for picking up the completed questionnaire was given out.
Workers at addresses fronting onto the following locations were included in the sample.
West Street
-
Station Road 6County Bridge
-
Town Hall Street 10Hollin Mill Lane 2
Tower Hill
-
Wharf Street 10Tuel Lane
-
Bolton Brow 43.4 ROAD USERS
In order to obtain the views of road users about conditions for driving through Sowerby Bridge three options were considered:
(1) to give drivers self completion questionnaires at stop lines
i.e. traffic signals
(2) to interview drivers who parked in Sowerby Bridge
(3) to have a kerb-side interview with drivers whilst still in their vehicles.
The first approach was considered too dangerous for survey staff considering traffic conditions in Sowerby Bridge. The second approach would have only obtained the views of people who actually stopped in Sowerby Bridge as opposed to driving through without stopping to visit. The third approach was considered most satisfactory. An arrangement with West Yorkshire Police to establish an interview station at which a sample of vehicles would be stopped for interviews.
The information which was considered relevant to i&entify problems experienced by drivers travelling through Sowerby Bridge was :
(1) any difficulties experienced driving through Sowerby Bridge prior to the interview or in general
(2) the driver's journey origin and destination and whether any alternative routes could have been taken
(3) the purpose and frequency of travelling through Sowerby Bridge.
A copy of the interview form is shown in Appendix 3. The interview point was set up opposite the Moorings area at a point where vehicles could pull into the roadside without impeding other vehicles. The interview was timed to last no more than 3
minutes.
The interview point was set up to capture vehicles travelling eastbound on Friday 6/11/87 between 1300-1700 and was designed to allow two interviews to be carried out at a time. Vehicles were signalled into the interview bay by the police officer whenever a gap of more than 3 0 metres appeared in the traffic. The first two vehicles at the head of the following platoon were interviewed. When the two interviews were completed the next two vehicles following a gap in traffic were pulled in. This was
felt to provide an adequate sample.
3.5 INTEREST GROUPS
From the various discussions with people around Sowerby Bridge and with members of the Steering Committee there were a number of specific people and interest groups who it was felt ought to be specifically included in the identification of problems and who had not appeared in any of the groups previously described. These people/groups included the following:
(1) Project Officer for the Riverside Development (1) (2) Sowerby Bridge Traffic Sargeant (1)
(3) Owners of major tourist attractions (6) (4) People who were registered disabled (4)
(5) Freight Manager of 88Brewliners11 Haulage Company (1)
each person was asked to identify a solution to the problem or a
way in which the 'problemf could be minimised. Here therefore
each person was presented with a series of problem-solving tasks unlike the previous groups who had been asked to identify
8problemsf only. A copy of the questionnaire is given in
Appendix 1 of this report.
Apart from the members of the disabled group the individuals in the other groups were self-selecting. A local disabled driver register (orange badge stickers) was used to draw at random
individuals who were disabled. In total 13 interviews were
4. PHYSICAL DATA COLLECTION
4.1 INTRODUCTION
The second strand to the identification of problems involved quantifying as far as possible measures of those problems which had been covered in the interviews. This was undertaken to establish the extent to which physical measures might be used to
identify *problemsf as well as indicating the scope and
limitations for solving the perceived problems. Those issues
which it was felt could be measured in a quantified form were:
1) traffic flow characteristics;
2) pedestrian activities; _
3) on-street parking;
4) off-street parking;
5) the pattern of traffic movements through the town.
The first three could be measured relatively easily using video cameras mounted at different points around the town. Such video recordings also served to provide evidence of the detailed way in which lengths of street were used, so that stated problems could be investigated in more detail later. The demand for off-street parking and the measurement of vehicle origins and destinations required different methods. The method of these and the video recording are described below.
4.2 TRAFFIC FLOW CHARACTERISTICS
Five video cameras were set up at different positions along the A58 to record traffic flow conditions throughout Friday 2/10/87
and Saturday 3/10/87. The actual positions of these cameras,
the recording period and the data captured are shown below:
LOCATION DATE DATA CAPTURED
Tall Chimney Inn 2/10/87 0900-1100 Traffic and Pedestrian
(West Street) 3/10/87 1100-1300 movement character-
istics West Street/ Sowerby Street/Railway Bridge Junction
Accountants 2/10/87 0900-1650 Traffic and Pedestrian
(Corner of characteristics in
Hollins Mill/ Town Hall Street
Town Hall St)
Bulls Head Hotel 2/10/87 0730-1830 Traffic and Pedestrian
(Town Hall St) 3/10/87 0800-1745 flow characteristics
between Tower Hill and Kwik Save pelican
crossing
Commercial Inn 2/10/87 0845-1800 Traffic and Pedestrian
(Tuel Lane) 3/10/87 0900-1730 flow characteristics
Tuel Lane Junction
LOCATION DATE
TIME
DATA CAPTUREDProspect 2/10/87 0830-1800 Traffic turning
Veterinary 3/10/87 0900-1745 characteristics
Surgery Wakefield Road/Bolton
(Bolton Brow/ Brow
Wakefield Road 3/10/87 0900-1745 Pedestrian Traffic
Junction) characteristics
Bolton Brow/Wharf St
Limited data was collected at Tall Chimney Inn due to a camera
fault. Further filming at this site was conducted on 25/10/87
between 1000-1600. In addition 5 minute manual counts every 30 minutes of pedestrian flows over County Bridge were made during Friday and Saturday lunchtime and afternoon off-peak period.
4.3 TRAFFIC MOVEMENTS THROUGH THE TOWN
Vehicle number plates and observation times were recorded
manually at 6 different points for 45 minute periods on both 2
and 3/10/87. These observation points were Bolton Brow (A58);
Wakefield Road; Tuel Lane/Beech Road; A58 (200m west of Watson Mill Lane); A672 (Oldham Road) and A58 (junction with A672).
On each day observations began at 0830 (10 minutes earlier at last 2 sites) recording traffic flows in one direction only. The direction of flow recorded was changed at specified times of the
day. On 2/10/87 we recorded 4 periods for traffic travelling
westbound and 4 periods for traffic travelling eastbound. On
3/10/87 we recorded 4 periods for traffic travelling westbound
and 3 period for traffic travelling eastbound. Altogether 11.5
hours of data per observation site over the two days were collected.
4.4 PARKING DATA
The number of cars parking at the following off-street car parks were recorded on a 20 minute cycle on 2/10/87 (0830-1120; 1300- 1640) and Saturday 3/10/87 (0900-1120; 1300-1640).
-
Hollin Mill Lane-
Wharf Street-
Kwik SaveIn addition vehicles parked on-street in Corporation Street/Tower Hill were recorded on the same basis.
The number of vehicles parked in Station Road, Victoria Road and West Street car park were recorded on an hourly cycle on both days. The video data provides information on a continuous basis of vehicles parked in Town Hall Street (Friday); Wharf Street
specific features of the town which are a source of -visual disamenity.
6.2 METHODOLOGICAL CONCLUSIONS
6.2.1 Introduction
The main objective of this stage of the study was to examine ways
of identifying traffic problems in Sowerby Bridge. The
identification of problems reported in this section involved inputs from a wide range of different groups of users of Sowerby
Bridge as well as observation and recording of physical
conditions in the town at different locations. A distinction
needs to be made between the methods used to elicit people's views and record physical conditions in Sowerby Bridge and the
interpretation of the importance of these problems. The first
stage can properly be called problem identification. The second stage needs to be regarded as a distinct though logically
connected stage which can be termed problem structuring. Most
attention is usually given to the first stage since this involves the actual capture of data. It is often forgotten however that
data capture is followed by analysis interpretation and
transformation of the original information and can lead to many hidden values and assumptions entering the conclusions drawn. Equal attention has been given to this second stage and the values and assumptions which enter the analysis are made explicit as far as possible since it is this structuring process which produces the information and conceptual model for thinking about
solutions. Comment and conclusions about both stages is given
below.
6.2.2 Methods Used to Elicit Viemoints
Three methods were used to elicit people's views about problems
in Sowerby Bridge. These were outdoor interviews; self
completion questionnaires and household interviews. The form and content of the individual methods varied depending upon the groups approached. In each method however two types of question were used:
(1) Those which asked for general impressions about conditions in Sowerby Bridge.
(2) Those which referred to specific activities and issues which we considered likely to be perceived as problems and involved structured measurement techniques.
The term 'problem' did not appear in any of the methods used. People were asked only to consider conditions in Sowerby Bridge as they experienced them and not to consider future conditions or solutions to those conditions. In supplying views about the town however some people naturally provided comment about what could or should be done to improve conditions.
The conclusions which have been reached about the methods used to identify problems are based upon the views and comments of those
who had to use the meth~ds, the type of views and information
6.2.3 On-Street Interviews
The on-street interviews with pedestrians produced a diverse set of impressions about Sowerby Bridge and a range of assessments about the relative difficulty of crossing the road. The time available for an on-street interview means that there is a limited number of questions that could be asked. Since we were interested primarily in people8s views about Sowerby Bridge as users, different ways of eliciting these views or more time on those questions included would have produced more revealing opinions. Questions asking people where they had visited or were likely to visit on their journey needed more time for discussion within the interview since both the interviewer and respondent were found to have difficulty in recalling and recording routes taken and likely to be taken. Ideally, this question should have been part of a separate study with more time to explore the issues. Questions asking people about the characteristics of their journey were useful in that they provided background information about the respondents familiarity with Sowerby Bridge and a relatively uncomplicated set of questions which helped to put the respondent in a frame of mind for more thoughtful questions.
The three major difficulties which were experienced with the on- street questionnaire are related. Firstly, the on-street interview involved interviewing people alongside a busy main road. Not only is this unpleasant but stopping for 10 minutes or so on a cold day is not an ideal situation for getting people to relax and think about what they like/dislike about Sowerby Bridge. Secondly, many people are not easily able to articulate their feelings when suddenly confronted by a direct question about their likes/dislikes of a town or a street. This may be because some people are less confident or less able to articulate their views; or because the actual question itself is remote from people's everyday thinking or activities. Thus approximately half of the sample interviewed could not supply a single like or dislike about Sowerby Bridge. Thirdly, where people did express their likes and dislikes it was found that they had great difficulty in expanding or articulating upon why they liked or disliked the particular feature. This may have been due to the conditions under which the interview took place and the time constraint or the form of question.
It is recommended therefore that, if similar studies are to be carried out in future:
(1) on-street interviews are kept brief (2-3 minutes) and focus entirely either on people8s impressions about a street or route choices; Questions asking about assessment of two or three likely key problems/issues should be pursued.
which people are familiar with and likely to have time to think and express themselves.
(3) methods which present information to people other than in the form of questions/answers and give people the opportunity to express themselves in ways other than merely verbally should be considered; attention should be given to the recording and assessment of non-verbal behaviour as well as verbal responses with any of the methods adopted.
6.2.4 Self-Comvletion Ouestionnaires
The small scale of Sowerby Bridge meant that delivery and collection of questionnaires could be completed in a short period. Furthermore, identification of the premises included in the sample was relatively straightforward. People were generally willing to take part in the study. The self-completion questionnaire allowed people to provide their views in their own time and to their own level of detail. Observation of the completed forms shows however that people tend to write their views, where a written response was required, in a short-hand style; some people were more succinct than others using often only single words to describe a ltproblerntt. No adverse comments were received about either the form or content of the questions. In general it was felt that the self completion questionnaire produced a more detailed set of problems than the on-street
interviews. This may have been due to the survey method or the type of person.
Where delivery and collection of questionnaires is relatively easy this method is used. Comparison of interview and self completion methods needs to be carried out, not only in terms of information produced but in terms of resources.
6.2.5 Household Interviews
Household interviews or interviews in the workplace offer the potential for more detailed investigation of issues in a controlled setting. This approach can therefore provide detailed commentaries and opinions on problems as well as offering the scope for examining initially at least solutions to the problems. In the approach adopted pre-structured problems, taken from the other survey methods, were used to focus on the interview. Respondents generally liked this method to assessing problems and gave people an issue either to reject or else elaborate upon.
Providing people with a set list of problems may mean that issues which the individual had not previously considered may thereafter be regarded as problems or else that respondents state that something is a problem in order to influence solutions or recommendations (policy-bias).
to interview in this part of the study. We regard this approach to be most useful and appropriate following the more loosely structured interview methods used for the pedestrian group and where specific individuals' views are considered important. A limited number of these interviews with key 81community81 figures or people with specific responsibilities in the town should therefore form part of any methodology adopted in other studies.
6.3 PROBLEM STRUCTURING
The views of people who use Sowerby Bridge for different reasons and physical data were collected in order to identify those problems caused by traffic in Sowerby Bridge and for which solutions would be required to make Sowerby Bridge a better place to work, live and visit. We then took this information in order to produce a structure of the problems facing the town overall and their importance. In terms of the development of a methodology which could be applied in other locations several questions need consideration.
(1) Did we need to obtain any more or less information and type than we did to structure the problems?
(2) Is our summary and representation of the problems in Sowerby
Bridge in this section in agreement with what people in Sowerby Bridge consider to be the problems?
(3) Was the separation of problem and solution identification necessary?
We talked to nearly 400 people who live, work and/or drive through Sowerby Bridge which itself has a population of about 10,000 inhabitants. We approached most of those people on a random basis as well as talking to a number of specific people who we considered might have specific interest in our study. We collected a large amount of physical data on video which provides a permanent and detailed record of conditions in Sowerby Bridge over two days, which could be analysed in many different ways and be used to test the likely effects of any solutions we put forward. We could not talk to everyone who might have had an opinion about the problems of Sowerby Bridge. Similarly there was a limit to the location for filming and amount of recording which could be undertaken. Not all the information which we collected has been analysed or useful to the determination of 'problems'. A particularly difficult area is the attempt to relate individuals' perspective of problems to physical conditions.
On the second point our summary and interpretation of problems inevitably involves making judgements about the information from the survey methods. People were not asked to assess how important they considered different problems to be. We produced a list which represented the most frequently mentioned and severely rated problem areas. This representation is a reflection of some of the tlproblemslt which are perceived by some of the local people. Further, many of the issues are location specific. We found that it was possible to group the problems into four types and within these categories to provide a list of locations where these problems were found. These headings and locational analysis were presented to respondents at the group discussions to identify solutions reported in Appendix 2 for comment. No adverse comments were produced. We conclude therefore that representation of problems is broadly consistent with that of the people who work, live or use Sowerby Bridge.
The third and potentially most important consideration is the way in which our study separated ltproblemstt and ltsolutionstt. Separation of these terms has many advantages for the organisation and construction of survey methods. In retrospect however the separation of the terms appears to be unnecessary.
Our approach of collecting and structuring problems, and then identifying solutions adds a separate stage. From our work people who perceive ttproblemstl also perceive ways of overcoming these llproblemstt. These may be poorly thought out suggestions but they exist. There is no reason, therefore, why these should not be gathered at the same time as the problems are identified. The main advantage of collecting problems separately from ltsolutionslt is that it means that individuals can be asked to consider not only problems they perceive but problems perceived by other people also. This advantage however is relevant only where an interview involves a one-to-one contact.
Group discussions allow the identification of problems; the collation and structuring of problems and identification of solutions in a single session. A considerable advantage of this style of survey is that people who do not perceive problems in the existing situation may perceive problems arising from the solutions suggested. The opportunity for involving people and linking the current situation to future situations is more direct than in the one-to-one situation.
7. PHYSICAL MEASURES OF PROBLEMS
7.1 ORIGIN-DESTINATION RESULTS
As a first stage in the analysis of physical data the amount of traffic travelling through the town was estimated. Initially registration plate observations were analysed for two time periods 0820-0915 (eastbound) and 0930-1015 (westbound). Table 5
During the period 0820-0905 it can be seen that of 207 vehicles observed at the A672 site, travelling eastbound, 52% travelled through to Watson Mill Lane taking on average 10 minutes; 29%
travelled on through Bolton Brow and 6% travelled through to Wakefield Road. In total therefore 35% or 72 vehicles observed at the A672 travelled through Sowerby Bridge taking on average between 13-15 minutes to complete that part of the journey. Assuming an eastbound flow along Bolton Brow immediately east of Tuel Lane of around 700 vph means that about 10% of this flow has its origin beyond the observation point on the A672.
Of the 384 vehicles recorded at the Watson Mill Lane site 43%
travelled through Sowerby Bridge to Bolton Brow taking on average approximately 7 minutes and 6% travelled through to Wakefield Road taking on average approximately 6.5 minutes for those journeys
.
For the period 0930-1015 of the 331 vehicles observed at Bolton Brow travelling westbound 26% travelled through to Watson Mill Lane (mean journey time 4 minutes); 3% travelled through to Tuel Lane (mean journey time 2.5 minutes); 2% travelled through to A58
(mean journey time 9 minutes) and 16% (52 vehicles) travelled through to A672 (mean journey time 8 minutes).
Of the 158 vehicles observed at Wakefield Road 7% travelled through to Tuel Lane (mean travel time 2.5 minutes). 80%
travelled through to Watson Mill Lane and 4% (only 6 vehicles) through to the A672 (mean travel time 10 minutes). Less than 1%
of vehicles observed at the Wakefield Road site travelled through to the A58 (Rochdale Road) observation site. Assuming a westbound flow of around 600 vph along Bolton Brow immediately to the west of Wakefield Road junction, mean that again about 10% of this flow travel through to a point beyond the A672 observation point.
Table 5
Oriain and Destination Studv of Vehicles Usina Ryburn Valley
Upstream Downstream Upstream Downstream Mean Site Site Observations Observations Travel
Time
...
A672 Watson Mill Lane 207 5 2 590
A672 Bolton Brow 207 2 9 922
A672 Wakefield Road 207 6 756
Watson Mill
Lane Wakefield Road 384 6 404
Watson Hill
Lane Bolton Brow 384 43 421
...
...
Upstream Downstream Upstream Downstream Mean Site Site Observations Observations Travel
Time
...
Wakefield Rd Tuel Lane* 158 7 141
Bolton Brow Tuel Lane* 331 3 141
Bolton Brow Watson Mill Lane 331 2 6 233
Wakefield Rd Watson Mill Lane 158 8 288
Wakef ield Rd A58 158 < 1 568
Bolton Brow A58 331 2 555
Watson Mill
Lane A58 213 4 302
Wakefield Rd A672 158 4 598
Bolton Brow A672 331 16 483
Watson Mill
Lane A672 213 3 1 233
...
*
Suspected incorrect procedure for recording number plates.In terms of traffic travelling between the motorway and destination east of Sowerby Bridge it appears that only about 10%
of the total traffic flow during the periods analysed is likely to be using the A58 as a through route. The perception of some people in Sowerby Bridge that the 'traffic problem1 in Sowerby Bridge is caused by traffic travelling to and from the motorway and would be solved by banning or diverting those vehicles is not borne out. The fact that a number of heavy goods vehicles are particularly noticeable and intrusive when they travel through the town and are using the A58 to travel between Halifax and the motorway appears to have led many people to think that a large percentage of traffic is doing the same.
times of the year (other than infrequent periods when the motorway is closed down due to extreme weather conditions) or on different days. Therefore whilst some diversion and signposting of traffic away from Sowerby Bridge is possible, it is evident that about 90% of the existing traffic travelling through Sowerby Bridge would remain.
7.2 TRAFFIC FLOW CHARACTERISTICS
Having identified the problems experienced by a sample of people in Sowerby Bridge the second stage of the analysis of problems
involved measuring physical indicators of those problems. As
people refer in many different ways to traffic conditions
-
delays, congestion, chaotic, busy, noisy, and because for many of these terms there is no obvious single physical correlate to assess these different terms it was decided to measure a broad set of indicators which covered a large number of types of problems perceived:
(a) Traffic flow and vehicle classification for different
periods of the day.
(b) Number of vehicles turning across opposing traffic streams at key junctions.
(c) Percentage of traffic travelling through Sowerby Bridge to and from the motorway.
By measuring (a) it would also be possible to make an assessment of kerbside and indoor noise levels using standard predictive expressions.
Traffic flow characteristics were measured from the video for 5 minute intervals over 1 hour periods for the following time bands 0830-0930; 1200-1300; 1615-1715 at different points along the
A58. Table 8 shows the peak 5 minute and half hourly flow in
either direction, the percentage of buses and goods vehicles and the start of the analysis period for four locations. These are:
(A) Bolton Brow north of Wakefield Road junction; (B) Wharf Street east of Tuel Lane junction;
(C) Wharf Street west of Tuel Lane junction; and (D) West Street west of Sowerby Street junction.
Apart from flows measured at site (B) during the afternoon peak the half hourly flows are higher in the eastbound direction than the westbound direction. Flows are at sites A, B (westbound) and D the morning and afternoon peaks five minute flows are higher than during the lunchtime peak. At the other observation points the lunchtime flows are higher than the morning and afternoon peak flows. The peak half hourly flows at each site in either directions are higher than the peak half hourly flows at the lunchtime period. The peak five minute flow measured at any site
was 93 vehicles travelling westbound at between 1700-1705
The lower flows measured at West Street (D) are probably partly explained by the fact that due to camera breakdown the video recorded only between 0900-1615 and thereby missed the early morning and evening peak period. It should be noted however that a considerable volume of traffic enters and leaves the main flow of traffic at Sowerby Street and does not travel along West Street (see turning movements).
In terms of traffic travelling between the motorway and destination east of Sowerby Bridge it appears that only about 10% of the total traffic flow during the periods analysed is likely to be using the A58 as a through route. The perception of some people in Sowerby Bridge that the 'traffic problem' in Sowerby Bridge is caused by traffic travelling to and from the motorway and would be solved by banning or diverting those vehicles is not borne out. The fact that a number of heavy goods vehicles
-
particularly the 'brewliner' company, are particularly noticeable and intrusive when they travel through the town and are using the A58 to travel between Halifax and the motorway appears to have led many people to think that a large percentage of traffic is doing the same.These findings must be treated with some caution however since they represent analysis for only two time periods on one day and for specific locations.
Table 8
site
Peak Five Minute and Half Hourlv Traffic Flows
bv Location and Time of Day
(Friday 2/10/87)
Maximum 5 Minute Flow Maximum Half Hourly Flow
...
Start Total Start Total
Time Time
...
0830-0930
From these figures the volume of traffic travelling through Sowerby Bridge reaches around 1600 vph in the centre of the town. These volumes are well above the design capacity of the road and clearly indicates why the amount of traffic is perceived as a major problem in the town. The formation of solutions to traffic problems in Sowerby Bridge therefore needs to take into account peak two way flows of around 1600 vph and flows that average between 1000-1300 vph throughout the day (0900-1700).
7.3 TRAFFIC TURNING MOWMENTS
A major likely cause of traffic congestion in West Street/Town
Hall Street and Wharf Street is vehicles turning into and out of
junctions. Right turning movements in particular are likely to
cause delays and congestion due to the high flows of on-coming
vehicles. A number of junctions were identified as leading to
delays and congestion to other vehicles. These were:
(1) Sowerby New Street/West Street
(2) Station Road/West Street
(3) Hollins Mill Lane/Town Hall Street
(4) Tower Hill/Town Hall Street
(5) Tuel Lane/Wharf Street
(6) Wakefield Road/Bolton Brow
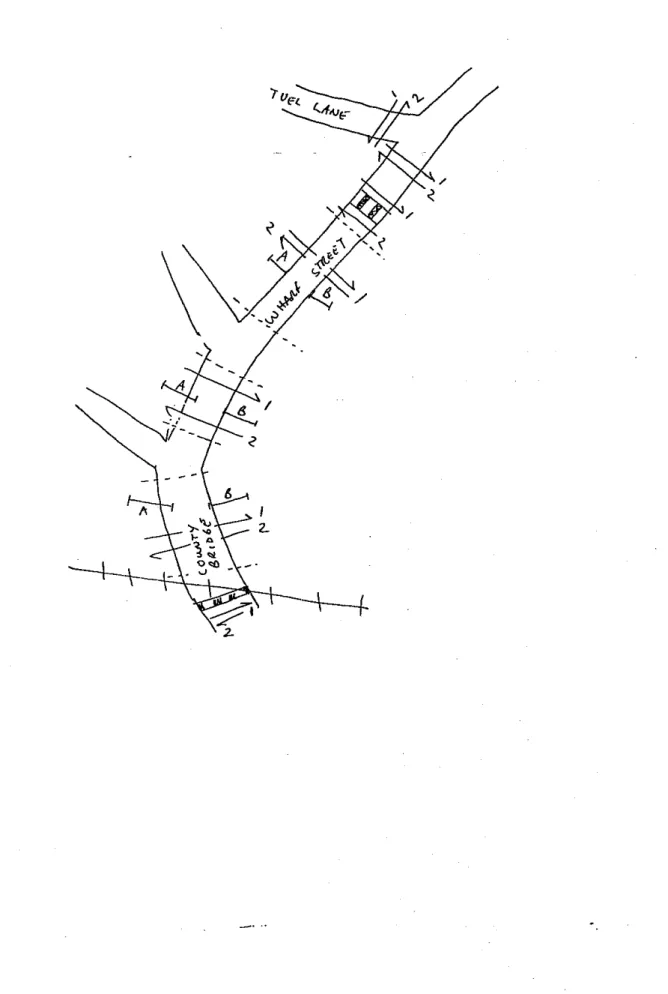
Table 9 shows the average hourly flow of traffic turning at these
junctions for specified time periods. Figure 3 shows the
direction of the turning movement.
Table 9
Traffic Turnins at Different Junctions
Five Minute Half Hour
Start Peak Start Peak
Time Flow Time Flow
...
Wakefield Road
-
Bolton Brow 1645 449 1640 2 19
...
Bolton Brow
-
Wakefield Road 1640 3 4 0835 159
...
Bolton Brow/Wharf Street
-
Tuel Lane 1700 36 1645 168
...
Tuel Lane
-
Bolton Brow/Wharf Street 0855 4 6 0840 227
...
Tower Hill
-
Wharf Street
...
Wharf Street
-
Tower Hill 1220 12 1215 50
...
Hollins Mill Lane
-
Town Hall Street 0930 4 0910 18
...
Town Hall Street
-
Hollins Mill Lane 1215 5 1215 2 3
...
Station Road
-
West Street 0930 20 0910 9 7
...
West Street
-
Station Road 0925 20 0910 107
...
West Street
-
Sowerby Street 0930 4 5 0910 152
...
Sowerby Street
-
West Street 1630 2 3 0910 111
-.
7.4 PEDESTRIAN ACTIVITY IN SOWERBY BRIDGE
Pedestrian flow counts both along pavements and crossing the road were taken from the video and from manual counts. Figure 2 shows
the locations where counts were taken. In addition pavement
widths were measured in Town Hall Street and Wharf Street.
7.4.1 Pavement Flow
Sample 20-minute counts of the numbers of people walking along pavements on either side of Wharf Street, Town Hall Street and County Bridge were taken from the video recording during two time periods 1030-1345 and 1630-1650. These two time periods had from other work been found to experience peak levels of pedestrian
activity (May et al, 1987). These counts included all
pedestrians crossing in both directions an imaginary screen line
across a pavement at a specified location. The locations of
these screen lines are shown in figure 4.
In addition to the video counts, manual counts of pedestrian numbers crossing over County Bridge on either side of the roadway
were taken for three twenty minute periods through the day. All
counts shown in Table 6 are for Friday 2/10/87. Table 6 shows
for each pavement the twenty minute two-way pedestrian flow counts for each pavement. An average hourly two-way flow for the period 1100-1400 for both pavements combined has been calculated for Town Hall Street and Wharf Street. The average hourly two way flow for County Bridge is for the time period 1200-1600.
Average hourly pavement flows are between 559-764 throughout the study area. Pedestrian flows are highest in Wharf Street.
The number of pedestrians on the north side (A) of the A58 in Town hall Street and Wharf Street is generally greater than on the south side (B). This is probably due to the presence of the supermarket and main residential areas. Pavement flows across
County Bridge are heavier on the south side (B) indicating that
pedestrians cross from the north side of Town Hall Street/Wharf Street prior to County Bridge.
7.4.2 Pavement Widths
Pavement widths along the south side of Town Hall Street and Wharf Street range between 1-2 metres, although at one location
the pavement width narrows to 0.5m. The pavement area to the
area overlooking the Riverside area is generally wider 2-3 metres although a bus stop here creates greater numbers of pedestrian
movement. Whilst pedestrian flows along the south side of the
T a b l e 1 0
P a v e m e n t F l o u A l o n g Toun H a l l S t r e e t . U h a r f S t r e e t a n d C o u n t v B r i d s e
1 0 3 0 - 1 1 3 0 - 1 2 3 0 - 1 3 2 5 - 1 6 3 0 - A v e r a g e H o u r l y
1 0 5 0 1 1 5 0 1 2 5 0 1 3 4 5 1 6 5 0 F l o u
. . .
C o u n t y B r i d g e A 4 5 7 7 9 3 1 0 4 ) 6 2 3 ( 1 2 0 0 -
B 9 0 1 3 9 115 95 ) 1 6 0 0 )
Toun H a l l S t A - 1 0 7 9 9 1 4 0 1 3 6 ) 6 1 2 ( 1 1 0 0
B
-
1 0 0 1 1 6 5 0 1 0 2 ) 1 4 0 0 )U h a r f S t r e e t A - 1 7 8 2 2 2 171 9 2 7 6 4 ( 1 1 0 0
B
-
5 4 5 7 8 2 4 4 1 4 0 0 ) ,Pavement widths to the northside of Town Hall Street are
generally wider than on the south side 1.5-2.0m. Pavement widths
to the north side of Wharf Street are approximately twice the width of those to the south side and in the area between the Centre for Adult Education and the entrance to the Kwik Save Car Park are between 3-4m in width.
In spite of these wider pavements, the higher pedestrian flows on the north side of Town Hall Street/Wharf Street produces similar problems wherever groups of pedestrians converge from different directions. This is particularly so in the area to the immediate east/west of Tower Hill. Overall the pavement width in Town Hall Street and Wharf Street, especially to the south side, create difficulties even for the number of pedestrians who use them now.
7.4.3 Crossinq Flow
Sample 20 minute counts of the number of people crossing at the controlled crossings at Tuel Lane, Wharf Street and the Railway Bridge and unassisted in Town Hall Street and Wharf Street were taken from the video recording for the time periods 1100-1400 and 1600-1700. The boundary of the area for the unassisted crossing counts are shown below in figure 4. In addition manual counts of pedestrians crossing the A58 in the area of County Bridge were recorded.
Table 11 shows for each crossing location the twenty minut two- way crossing flow. An average hourly two way flow for the period 1100-1400 for each crossing location has been calculated.
The greatest level of pedestrian activity occurs at the Railway
ridge pedestrian crossing with an estimated peak crossing flow
of 336 pedestrians per hour. Crossing flows across Wharf Street at the traffic signal control immediately to the East of the Tuel
Lane junction are extremely low. Surprisingly the rate of
crossing across Tuel Lane immediately to the north of Wharf Street is very low with an average around 30 pedestrians per hour. On average the hourly rate of crossing Wharf Street at the controlled crossing (opposite the entrance to the Kwik Save car
park) is higher (181) than at the signal control at the junction
with Tuel Lane (82). The average hourly rate of crossing in a 70m length of Wharf Street (unassisted) is slightly lower (147) than at the controlled crossing opposite the Kwik Save car park
entrance. Unassisted crossings in Wharf Street are an average
greater than unassisted crossings in an equivalent length than in Town Hall Street (114). Finally there is a relatively constant flow, considering the considerable difficulties and danger in crossing, across County Bridge (44 pedestrians per hour).
Whilst there is no way of quantifying without more detailed study the number of pedestrians who do not cross or would like to cross the A58 but for the road traffic conditions there was sufficient evidence from the on-street interviews, anecdotal information and observation to suggest that there are likely to be a considerable number of supressed crossing trips. This does not include people
who do not visit Sowerby Bridge because of the existing
Table 11
Pedestrian Rate of Crossins at Different Locations in Sowerbv Bridae
1130- 1230- 1325- 1610- Average 2-way
1150 1250 1345 1620 crossing flow
...
Tuel Lane/ Dir 1 0 1 0 1 3
Wharf Street Dir 2 0 0 2 2
Tuel Lane Dir 1 1 3 11 10 3 0
Dir 2 7 5 3 5
Wharf Street Dir 1 21 2 2 12 2 4 8 2
Dir 2 12 5 10 9
Kwik Save D i r l 35 2 8 26 33 181
D i r 2 36 32 24 2 7
Wharf Street D i r l 30 24 17 16 147
Dir 2 20 3 4 22 2 4
Town Hall Street Dir 1 18 25 18 17 114
Dir 2 17 23 13 10
County Bridge Dir 1 6 7 13 4 4 4
Dir 2 6 4 8 7
Railway Bridge* Dir 1 66
-
-
57 336*Dir 2 49
-
-
50*
Hourly crossing flow based on two twenty minute observations7.4.4 Conclusions
Pedestrian activity along the A58 is concentrated in an area between the Railway Bridge and the Tuel Lane/Wharf Street junction. Pedestrian movements along pavements are higher on the northside pavements particularly in the area between Tower Hill/Town Hall Street and the entrance to the Kwik Save car park. The Railway Bridge zebra crossing experiences the highest flows
of pedestrians. The pavement widths in Town Hall Street and
Wharf Street particularly the south side of the A58 are generally
inadequate for the number of existing pedestrians. Further
increases as a result of tourist development will inevitably make conditions for passing more difficult.
7.5 PARKING IN SOWERBY BRIDGE
Figure 3 shows the locations and boundaries of the areas for
counting off-street and on-street parked vehicles.
7.5.1 Off-Street Parkins
-
Demand for parkina m a c eThe number of cars parked in three off-street parking areas; Kwik Save; Stanley Street; Hollins Mill Lane; were counted on a twenty minute cycle between 0840-1140 and 1300-1700 on Friday 2/10/87
and between 0900-1140 and 1300-1700 on Saturday 3/10/87. Less
frequent counts every hour were taken in the car park on West
Street. Table 11 shows the number of vehicles parked and
percentage of the capacity of the car park for those observed
periods. On Friday 2/10/87 the Kwik Save car park was at least
two-thirds of capacity on 17 of the 21 observation counts. During the period 1000-1120 82% or more of the available parking
space was taken with virtual capacity being reach at 1020. It
would appear that during the afternoon period there is about 25% (approximately 20 vehicles) available parking spaces. During the morning period there is generally less parking spaces available. In the Stanley Street car park demand exceeded during the observation periods 80% of capacity on one occasion and 60% of capacity on another four occasions. These occasions were all during the afternoon time period. During the morning period demand for spaces at the Stanley Street car park was about 50% or
below. During the afternoon period demand was at its highest
between 1300-1420 thereafter returning to the morning demand levels.
Examining both the Kwik Save and Stanley Street car parks together as the main parking areas in the east side of the town there would appear to be during the morning period 0940-1120 between 22-42 car parking spaces available, the majority of these in the Stanley Street car park. During the afternoon period 1300-1600 there are 35-60 car spaces available at any one time, these being located in both car parks fairly evenly. The Hollins Mill Lane car park next to the Fire Station is virtually at capacity throughout the day. The West Street car park is under 50% capacity throughout the day. Demand for off-street car parking on Saturday (3/10/87) is generally lower than on the
Friday (see Table 13). Peak demand in the Kwik Save car park on
Table 11
Number of Vehicles and Percentase of Ca~acitv
at Four Off-Street Car Parks (Friday 2/10/87)
...
KWIK SAVE STANLEY STREET HOLLINS MILL WEST STREET
LANE
Number % Number % Number % Number %
Time Vehicles Cap Vehicles Cap Vehicles Cap Vehicles Cap
...
0840 34 40 5 15 15 100
0900 4 5 54 10 2 9 13 8 6 10 43
0920 5 6 6 6 13 3 8 13 86
0940 6 3 7 5 14 41 14 9 3
1000 7 7 92 14 4 1 15 100 9 21
1020 83 98 14 41 15 100
1040 7 6 90 18 53 15 100
1100 7 4 88 19 5 6 15 100 8 35
Table 1%
Number of Vehicles and Percentaae of C a ~ a c i t v
at Four Off-Street Car Parks (Saturday 2/10/87)
KWIK SAVE STANLEY STREET HOLLINS MILL WEST STREET
LANE
Number % Number % Number % Number %