S
IMULTANEOUS
COD R
EMOVAL
AND
PHA P
RODUCTION
IN AN
A
CTIVATED
S
LUDGE
S
YSTEM
UNDER
D
IFFERENT
T
EMPERATURES
Sopa Chinwetkitvanich
1*,2, Clifford W. Randall
3and
Thongchai Panswad
11
Department of Environmental Engineering, Faculty of Engineering,
Chulalongkorn University, Bangkok, Thailand 10330
2
Department of Sanitary Engineering, Faculty of Public Health,
Mahidol University, Bangkok, Thailand 10400
3
Department of Civil and Environmental Engineering,
Virginia Polytechnic Institute and State University, Blacksburg, U.S.A. 24061
E-mail : [email protected]
1*, [email protected]
2,
[email protected]
1and [email protected]
3ABSTRACT
The purpose of this study was to investigate PHA production by activated
sludge biomass under different temperatures. The two-step approach, i.e.
utilizing a growth phase followed by a nutrient(s) limitation phase, was applied
to stimulate PHA accumulation. Each of three intended temperatures, 10
oC,
20
oC and 30
oC, was investigated with combined N&P limitation. Four liter (L)
fully aerobic SBRs were used for all experiments, and operated with a 6 h
cycle time, a 10 h HRT and a 10 day SRT. The maximum PHA cellular
contents and total concentrations achieved during the N&P limitation periods
in the 10 and 20
oC systems were very similar, i.e. 45 and 43 % of the TSS and
2133 and 2239 mg/l, respectively, whereas the 30
oC results were lower at
33 % of TSS and 1476 mg/l. The biomass temperature clearly had a strong
inverse effect upon PHA productivity. It decreased from 427 and 204 to 148
mg/l-day as reactor temperature increased from 10 to 20 and 30
oC,
respectively. As well, the PHA yields decreased from 0.38 to 0.16 and 0.11
mg PHA/mg COD
u, respectively. The results strongly indicate that activated
sludge PHA accumulation stimulated by combined N and P limitation is
inversely correlated with temperature.
KEYWORDS
I . Introduction
Polyhydroxyalkanoates (PHAs) are stored by several types of bacteria as a carbon and energy reserve when the cells are subjected to nutritional stress. The conditions that most effectively stimulate bacterial PHA accumulation appears to be those that impose growth limiting conditions on the cells, such as the deprivation of oxygen, nitrogen, phosphate, sulfur, magnesium or potassium in the presence of excess carbon [1], [2].
Unfortunately, the production price of biodegradable PHA plastics is still not competitive with the conventional plastics manufactured by the petrochemical industry. Lee [3] and Braunegg et al.[4] have reported that the price of BIOPOL™, a commercially marketed PHA plastic, is currently about 16-17 times higher than those of conventional plastics. BIOPOL™ is produced using aseptic pure culture conditions and purchased short-chain volatile fatty acids (VFAs), such as acetic, propionic, etc. There have been several efforts to decrease the cost of PHA production, including using mixed cultures such as activated sludge biomass [2], [5], [6] that can store high concentrations of PHA while utilizing an inexpensive carbon source [7] - [10]. These studies have demonstrated that there is considerable potential for the utilization of mixed cultures and industrial (carbon-based) wastewater organics to produce PHAs for the production of fully biodegradable, yet versatile, plastics. Therefore, it is time to consider how wastewater treatment systems can be modified to permit utilization of activated sludge and organic wastewaters for PHA production, so that much less expensive plastics can be produced and reduce the widespread use of disposable, but poorly biodegradable, conventional plastics. If successfully applied, the financial liability of wastewater treatment could be reduced through the production of a commercially marketable by-product. This could prove to be especially attractive to industries that discharge a high strength organic carbon-based wastewater.
A review of the published literature indicates that the knowledge of effects of temperature on PHA storage by activated sludge has been rare. The main objective of this study was to investigate the effects of temperature on PHA production by activated sludge cultures utilizing a synthetic organic industrial wastewater as the growth substrate and subjected to nitrogen and phosphorus limitation.
II. Materials and Methods
A fully aerobic SBR system was used for all experiments as Punrattanasin [2] has shown that fully aerobic conditions stimulate higher PHA productivity than typically achieved in Anaerobic/Aerobic (An/Ae) and Microaerophilic/Aerobic (MA/A) cycling systems. Three different temperatures were selected for this study, i.e., 10, 20 and 30oC. Both 10 and 20oC experiments were conducted in temperature control rooms of the laboratory of Civil and Environmental Engineering Department, Virginia Polytechnic Institute and State University in United States of America. While the 30oC reactors were setup in modified water bath equipped with fishing tank heater. Water temperature in every reactor was monitored daily with only +1.5oC fluctuation was allowed. The limitation of both nitrogen (N) and phosphorus (P) were investigated for each temperature. The SBR systems with a working volume of 4 liters as illustrated in Figure 1 were operated with a hydraulic retention time (HRT) of 10 hours, a sludge age of 10 days and a 6-hour operating cycle. Each cycle consisted of 15 min influent feeding time, 4 hr aeration period, and 1.5 hr settling with the last 15 min of effluent withdrawal. The volume in the reactor after effluent discharge was 1.6 l, resulting in a discharge volume of 2.4 l per cycle. For SRT of 10 days, excess sludge was drained approximately 400 ml per day or 100 ml per cycle, which was subjected to be adjusted depending on suspended solid contained in effluent.
consecutive cycles would enrich the PHA accumulating bacteria, reduce the production time, and produce higher PHA content within the cells. PHA accumulation by the sludge was monitored by frequent analysis so that the maximum PHA accumulation and the time required to obtain it could be determined. The systems were inoculated with excessive activated sludge from the UCT/VIP configuration Integrated Fixed Film Activated Sludge (IFAS) pilot plant system operated by Sriwiriyarat [12].
Figure 1
Experimental setup
Air
Pump Pump
Reactor
Influent Tank Effluent Tank
Timer
2.1 Synthetic wastewater
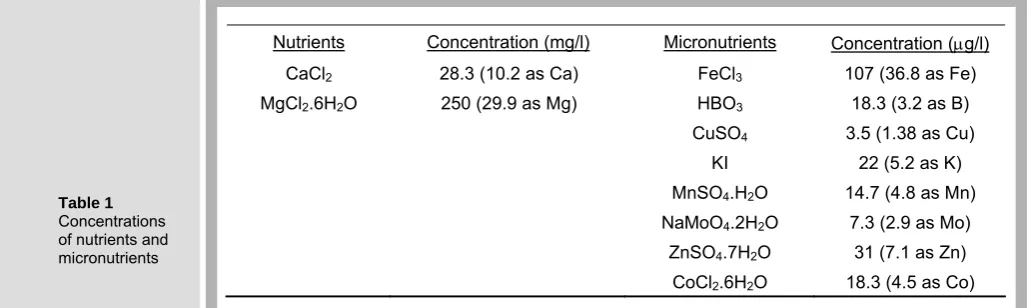
The synthetic wastewater was composed of sodium acetate (330 mg/l as COD) and sodium propionate (330 mg/l as COD) as the sole carbon sources. When the system was operated during the growth phase, (NH4)2SO4 of 33 mg N/l and KH2PO4 of 17 mg P/l were added as the N & P nutrients. Other nutrients and micronutrients used in this experiment are shown in Table 1. The synthetic wastewater was prepared daily with tap water.
Table 1 Concentrations of nutrients and micronutrients
Nutrients Concentration (mg/l) Micronutrients Concentration (μg/l) CaCl2 28.3 (10.2 as Ca) FeCl3 107 (36.8 as Fe)
MgCl2.6H2O 250 (29.9 as Mg) HBO3 18.3 (3.2 as B)
CuSO4 3.5 (1.38 as Cu)
KI 22 (5.2 as K) MnSO4.H2O 14.7 (4.8 as Mn)
NaMoO4.2H2O 7.3 (2.9 as Mo)
ZnSO4.7H2O 31 (7.1 as Zn)
CoCl2.6H2O 18.3 (4.5 as Co)
2.2 Analytical methods
[image:3.595.43.560.471.625.2]and 1 µl from the chloroform layer (bottom layer) was injected into a Hewlett-Packard Model 5890 GC equipped with a Stabilwax capillary column (0.25 x 3 mm inner diameter) attached to an FID detector. The oven temperature program used was: 4 min at 90oC, increase from 90 (initially hold to 4 min) to 130oC at the rate of 20oC /min, while the temperatures of injector and detector were 160 and 200oC, respectively. PHA content (%TSS) was defined as the percentage of PHA mass in the dry cell mass. PHA concentration and residual biomass were calculated using equations (1) and (2), respectively.
PHA concentration (mg/l) = PHA content x MLSS (1)
Residual biomass (mg/l) = MLVSS – PHA concentration (2)
III. Results and Discussions
3.1 PHA production
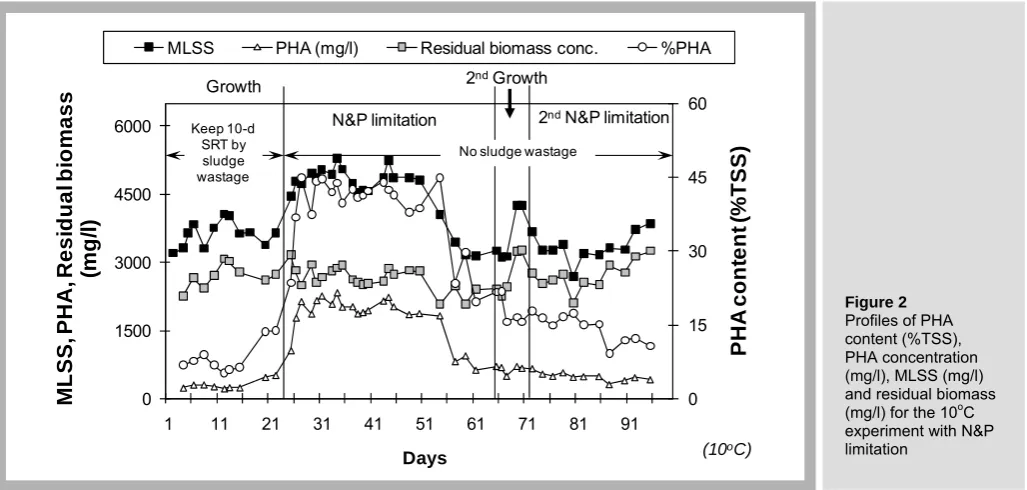
In this study, the duration of the growth phases for the three systems were not the same, depending on how fast steady-state was achieved, e.g. the 10oC and 20oC systems required 2 and 3 sludge ages, respectively, and the 30oC system was operated for 4 sludge ages before starting nutrient limitation conditions because of a sludge bulking problem. Figure 2 shows the profiles of MLSS (mg/l), PHA content (%TSS) and PHA concentration (mg/l) during the experiments at 10oC with combined N and P limitation. The system was operated for 22 days with sufficient N and P added to the influent for biomass growth. The SRT was maintained at 10 days over the 22 days of the growth period by wasting a calculated amount of mixed liquor after accounting for the SS wasted during supernatant withdrawal. After N&P limitation was started, mixed liquor wastage was terminated in order to maximize biomass concentration, and therefore PHA accumulation, in the system.
MLSS PHA (mg/l) Residual biomass conc. %PHA
[image:4.595.41.555.421.666.2]After N&P was eliminated from the influent, PHA accumulation clearly happened as PHA content increased rapidly and reached the maximum content of 45%TSS on day 5 after N&P limitation was started. Surprisingly, the PHA content remained nearly constant above 40%TSS for almost a month after reaching the maximum percentage, before decreasing simultaneously with the biomass concentration.
Figure 2 Profiles of PHA content (%TSS), PHA concentration (mg/l), MLSS (mg/l) and residual biomass
(mg/l) for the 10oC
experiment with N&P limitation
0 15 30 45 60
1 21 31 41 51 61 71 81 91
PH
A
cont
ent
(
%
TS
S)
0 1500 3000 4500 6000
1 1
(m
g
/l
)
Days
Growth 2ndGrowth
2ndN&P limitation
N&P limitation
M
L
S
S
, P
H
A
, R
esi
dual
bi
om
ass Keep 10-d SRT by sludge wastage
No sludge wastage
Next, nutrient addition was resumed and the system was operated under growth conditions again for approximately 5 days, and then both N and P were limited for a second time. During the second N&P limitation period, both the PHA content and the MLSS concentration were nearly the same as during the first growth period. That was inconsistent with the study by Punrattanasin [2], in which the author reported that two consecutive periods of growth and nutrient limitation would typically result in higher PHA content during the second limitation period. However, the operating days during the first N&P limitation of this study totaled 43 days. It is possible the biomass lost its ability to accumulate PHA because it lacked both nitrogen and phosphorus over this long period of time
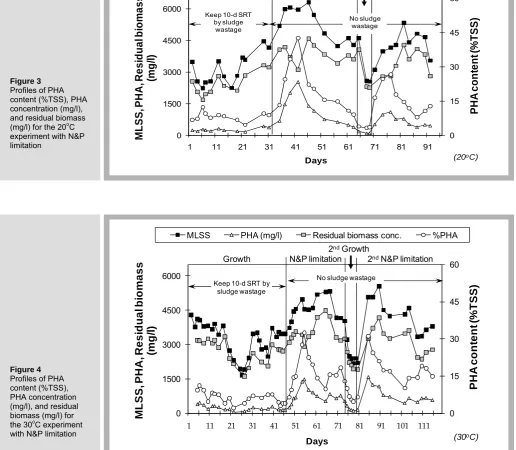
Figure 3 Profiles of PHA content (%TSS), PHA concentration (mg/l), and residual biomass
(mg/l) for the 20oC
experiment with N&P limitation 0 15 30 45 60 0 1500 3000 4500 6000
1 11 21 31 41 51 61 71 81 91
P H A co nt en t ( % T S S) MLS S, P HA, Re si d u a l b iom a s s (m g /l) Days
MLSS PHA (mg/l) Residual biomass conc. %PHA
Growth N&P limitation2ndGrowth2ndN&P limitation
(20oC)
No sludge wastage Keep 10-d SRT
by sludge wastage
Figure 4 Profiles of PHA content (%TSS), PHA concentration (mg/l), and residual biomass (mg/l) for
the 30oC experiment
with N&P limitation
0 15 30 45 60 0 1500 3000 4500 6000
1 11 21 31 41 51 61 71 81 91 101 111
PHA c o n te n t (% T SS) M LS S , P H A , R esi dual b iom ass (m g /l) Days
MLSS PHA (mg/l) Residual biomass conc. %PHA
Growth
2ndGrowth
N&P limitation 2ndN&P limitation
(30oC)
Keep 10-d SRT by sludge wastage
[image:5.595.42.559.229.679.2]Figures 3 and 4 show the profiles of MLSS (mg/l), PHA content (%TSS) and PHA concentration (mg/l) during the experiments at 20 and 30oC, respectively, with combined N&P limitations. Similarly to the 10oC experiment, the systems were operated for 2 SRTs for the normal growth phase. The PHA contents during both experiments increased slower than during the experiment of 10oC. The maximum PHA contents of 43%TSS in the experiment at 20oC and 33%TSS at 30oC were obtained 11 and 10 days after N&P limitations, respectively. Unlike the 10oC experimental results, the PHA contents in both the 20 and 30oC experiments decreased almost immediately after reaching the maximum value. After the second period of N&P limitation conditions were applied, the PHA contents in both experiments reached the maximum values faster than during the first N&P limitations period. The values reached 27%TSS in the 20oC experiment and 31%TSS in the 30oC, after 8 and 6 days, respectively. The peak PHA accumulations occurred during the second nutrient limitation period at a faster rate than the first limitation period similarly to Punrattanasin [2]. The author explained this operating condition (two consecutive cycles of growth & nutrient limitation) would probably enrich the population of PHA accumulating bacteria. But the maximum PHA amounts accumulated were all less than the fractional contents obtained during the first limitations period. The reason of this inconsistency is still unknown.
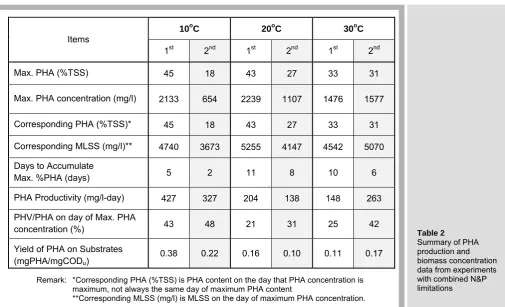
The PHA concentrations (mg/l), PHA productivities (mg/l-day) and PHA yields (mg PHA/mg CODu) obtained during the N&P limitation periods are summarized in Table 2. The PHA productivities and yields clearly decreased as temperature increased, i.e., declining from 427 to 204 to 148 mg/l-day, and from 0.38 to 0.16 to 0.11 mg PHA/mg CODu at the temperatures of 10, 20 and 30oC, respectively. The PHA productivities in this study were significantly less than those reported in several papers using pure cultures. This is because the concentrations of activated sludge biomass and substrate used in these experiments were much lower, based on the intention to use wastewaters as carbon source in subsequent research. However, the above PHA yields were quite promising, especially at 10oC (0.38 mg PHA/mg CODu) when compared to the theoretical yield of 0.48 mg PHA/mg acetic acid, (equivalent to 0.45 mg PHA/mg CODu), calculated by Yamane et al. [15], or the yields obtained using pure cultures, e.g., a yield of 0.46 g PHB/g glucose with Alcaligenes eutrophus DSM 545 [16] and a yield of 0.36 g PHB/g glucose with Ralstonia eutropha [11].
10oC 20oC 30oC
Items
1st 2nd 1st 2nd 1st 2nd
Max. PHA (%TSS) 45 18 43 27 33 31
Max. PHA concentration (mg/l) 2133 654 2239 1107 1476 1577
Corresponding PHA (%TSS)* 45 18 43 27 33 31
Corresponding MLSS (mg/l)** 4740 3673 5255 4147 4542 5070
Days to Accumulate
Max. %PHA (days) 5 2 11 8 10 6
PHA Productivity (mg/l-day) 427 327 204 138 148 263
PHV/PHA on day of Max. PHA
concentration (%) 43 48 21 31 25 42
Yield of PHA on Substrates (mgPHA/mgCODu)
[image:6.595.44.550.452.759.2]0.38 0.22 0.16 0.10 0.11 0.17
Table 2
Summary of PHA production and biomass concentration data from experiments with combined N&P limitations
Remark: *Corresponding PHA (%TSS) is PHA content on the day that PHA concentration is maximum, not always the same day of maximum PHA content
3.2 Substrate utilization
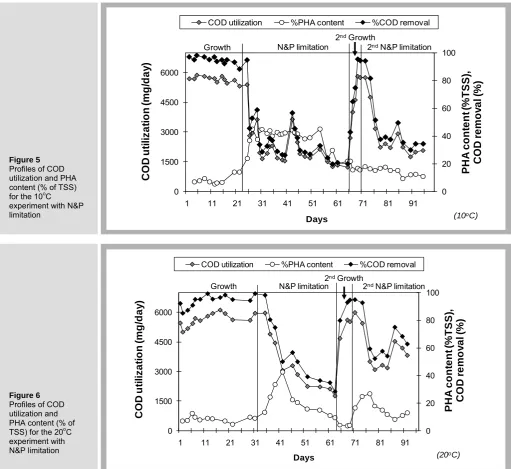
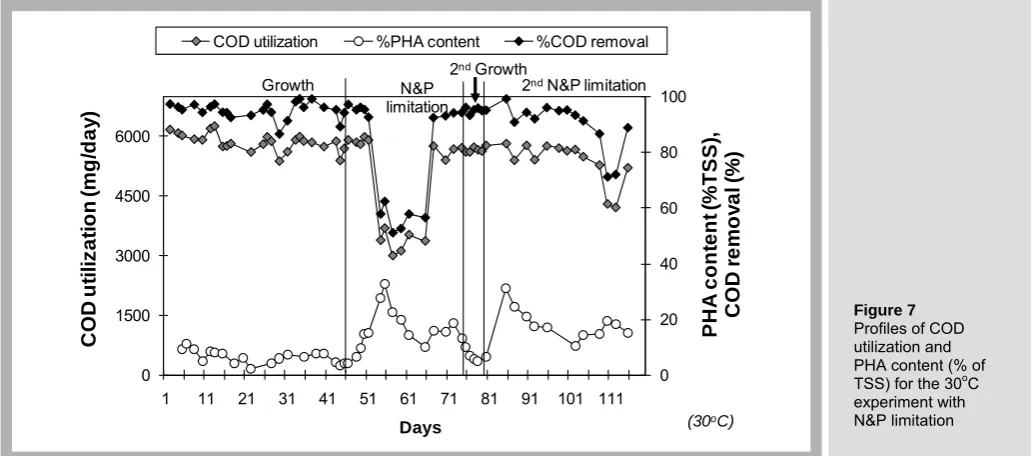
If wastewaters are used as the organic carbon provider, high COD or substrate utilization is preferred. Figures 5 to 7 show the profiles of COD utilization, COD removal efficiency and PHA content during the experiments. The results indicate that there is a relationship between these two parameters during N&P limitation conditions, and a similar relationship was observed when only nitrogen was limited, as reported by Chinwetkitvanich et al. [17]. The data plots of the experiments at 10, 20 and 30oC show that COD utilization and COD removal efficiency decreased rapidly while the PHA fraction increased to peak values.
[image:7.595.45.557.328.797.2]During the second N&P limitation periods, the decrease of COD utilization and increase of PHA content at 10oC and 20oC occurred concurrently, while COD utilization in the 30oC system was maintained at a surprisingly high level. Regarding the residual biomass curve of the 30oC system, shown in Figures 4, there was cell growth during the second PHA accumulation. It was observed that the 30oC biomass utilized COD for both PHA storage and cell growth, while the biomass maintained at the two lower temperatures utilized COD mostly for PHA accumulation. However, this study had not yet considered another intracellular storage such as glycogen. It is possible that the residual biomass would not represent only cell growth, but also glycogen storage. If glycogen storage significantly involved with COD utilization, the explanation of temperature effect on PHA accumulation would be more complicated. For COD removal efficiencies, they were mostly lower than 50% during PHA accumulation, especially in the 10oC system (only 20% left).
Figure 5 Profiles of COD utilization and PHA content (% of TSS)
for the 10oC
experiment with N&P limitation 0 20 40 60 80 100 0 1500 3000 4500 6000
1 11 21 31 41 51 61 71 81 91
PHA cont ent (% TSS) , COD r e mo v a l ( % ) C O D u ti li z at ion (m g/ day ) Days
COD utilization %PHA content %COD removal
Growth N&P limitation 2ndN&P limitation
2ndGrowth
(10oC)
Figure 6 Profiles of COD utilization and PHA content (% of
TSS) for the 20oC
experiment with N&P limitation 0 20 40 60 80 100 0 1500 3000 4500 6000
1 11 21 31 41 51 61 71 81 91
P H A c o n te n t (% T S S ), COD r e m o v a l ( % ) C O D ut il izat ion ( m g/ day ) Days
COD utilization %PHA content %COD removal
2ndGrowth
2ndN&P limitation
N&P limitation Growth
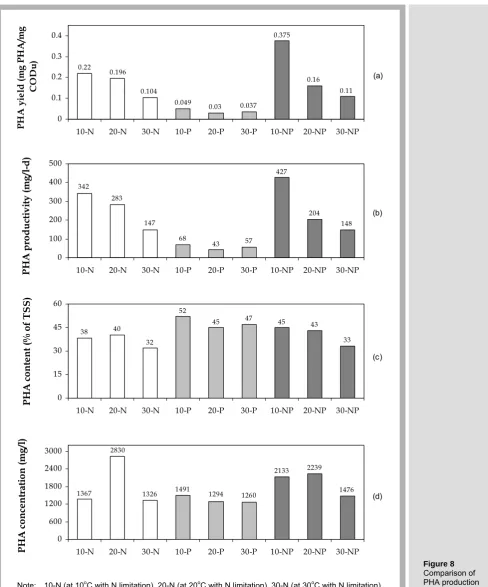
3.3 Comparison of PHA productions with different nutrient limitation
scenarios
The production of PHA with nitrogen limitation [17], phosphorus limitation [18] and combined N&P limitation from this study were comparatively summarized in Figure 8.
The best PHA yield of 0.38 mg PHA/mg CODu (Figure 8a) was obtained in the
experiment at 10oC with N&P limitation. This yield was quite close to the theoretical yield of 0.45 mg PHA/mg CODu [15], and the observed yield of 0.42 mg PHA/mg sucrose (equivalent to 0.37 mg PHA/mg CODu) accumulated by Alcaligenes latus [19]. In the case of P limitation, PHA yields ranged from 0.03 to 0.05 mg PHA/mg COD, which are very much lower due to the longer time of PHA accumulation required. Therefore, P limitation is not recommended for PHA accumulation with activated sludge biomass. However, not only nutrient limitation, but also temperature influences the observed PHA yield, i.e., higher temperatures result in lower PHA yields.
Krishna and Van Loosdrecht [20] have explained that under famine phase (or unbalanced growth conditions), cell maintenance played a more important role than cell growth. As well, the authors stated that cell maintenance and decay rates increased with higher temperature, resulting in decreased biomass formation. Therefore, at higher temperatures, some of accumulated PHA may also be oxidized to obtain enough energy for anabolic metabolism, resulting in lower observed PHA yield.
Phosphorus-accumulating organisms (PAOs), the important microorganisms in anaerobic-aerobic activated sludge processing, have been widely recognized for their ability to accumulate PHA. Panswad et al. [21] concluded that PAOs are lower-range mesophiles or psychrophiles. Thus, at higher temperatures there would be an increased requirement for cell maintenance energy, and less energy availability for cell production; hence, the presence of PAOs in the biomass would be reduced as the system temperature decreases. Therefore, though N&P limitation seems to stimulate PHA production better than other nutrient limitations, PHA production with N&P limitation at high temperature is not likely to be economical.
The PHA productivities obtained in this study (Figure 8b) were significantly lower than those reported by Wang and Lee [19] and Choi and Lee [22], whose studies were based on using pure cultures and high concentration carbon sources, because of a lower biomass concentration in this study. In commercial production studies with pure cultures, the biomass concentrations used for cultivation were substantially higher, e.g., a final biomass concentration of 164 g/l was obtained by Kim et al. [23] and 143 g/l by Yamane et al. [24], whereas the biomass concentrations in the activated sludge systems operated during these experiments were always lower than 5 g/l during the growth phase and never exceeded 8 g/l. Also, the concentrations of carbon substrate fed during this study were only about 0.66 g/l COD while others [23] - [25] fed glucose concentrations of 10-20 g/l. Nevertheless, the experiment at 10oC with N&P limitation
0 20 40 60 80 100
1 21 31 41 51 61 71 81 91 101 111
PH
A
cont
ent
(
%
TSS)
,
COD r
e
m
o
v
a
l (
%
)
Days
0 1500 3000 4500 6000
1 1
C
O
D
ut
il
iz
at
ion
(m
g/
day
)
COD utilization %PHA content %COD removal
2ndN&P limitation
2ndGrowth
Growth N&P
limitation
[image:8.595.38.555.51.279.2](30oC)
Figure 7 Profiles of COD utilization and PHA content (% of
TSS) for the 30oC
provided the best PHA productivity of 427 mg/l-d and PHA yields of 0.38 mg PHA/mg CODu. This PHA yield was only 15% less than those theorized by Yamane [15] and slightly greater than the 0.37 mg PHA/mgCODu obtained by Wang and Lee [19]. However, the low PHA productivities obtained from the experiments with P limitation confirmed that P limitation was not suitable for PHA accumulation utilizing activated sludge biomass. Of course, increases in temperature above 10oC reduced both PHA yield and the resulting PHA concentration.
Figure 8c illustrated that the PHA contents obtained from the experiment with P limitation were somewhat higher than others, especially, from the experiment at 10oC, 52% of TSS, which was quite similar to the value of 53% of TSS obtained from activated sludge biomass with P limitation [2]. However, the PHA accumulation, till the highest PHA content (52% of TSS) was obtained, took quite longer time than other experiments. During the PHA accumulation, the problem of sludge bulking severely occurred and caused the massive loss of biomass, resulting in the lowest yield and the lowest productivity of PHA in this experiment (P limitation). Still, these PHA contents were very much lower in comparison with PHA content of 80% of cell dry weight obtained by pure culture, Alcaligenes eutrophus, with P limitation [26].
The experiments with N&P limitation produced even lower PHA contents (the highest content was 45% of TSS in the experiment at 10oC). On the other hand, in the case of PHA content, effects due to different nutrient limitations and temperature were not so distinct.
The PHA concentrations obtained during the P limitation experiments, i.e., 1491, 1294 and 1260 mg PHA/l at 10, 20 and 30oC, respectively, were somewhat lower than those obtained during the N&P limitation or nitrogen limitation experiments (Figure 8d). The biomass concentrations were declining throughout the P limitation experiments. The best PHA concentration of 2830 mg PHA/l was obtained from the experiment at 20oC with nitrogen limitation due to its high biomass concentration of 7548 mg/l. Regarding to this PHA content parameter, the setup with N&P limitation and low temperature was still the best among the others.
Figure 8 Comparison of PHA production with various types of nutrient limitation 0.22 0 0.1 0.2 0.3 0.4 10-N PH A y ie ld (m g PH A /m g C ODu ) 0.196 0.104 0.049 0.03 0.037 0.375 0.16 0.11
20-N 30-N 10-P 20-P 30-P 10-NP 20-NP 30-NP
(a) 148 204 427 57 43 68 147 283
20-N 30-N 10-P 20-P 30-P 10-NP 20-NP 30-NP
342 0 100 200 300 400 500 10-N P H A pr oduc ti vi ty (m g/ l-d) (b) 38 0 15 30 45 60 10-N PH A c ont en t ( % o f TS S) 40 33 43 45 47 45 52 32
20-N 30-N 10-P 20-P 30-P 10-NP 20-NP 30-NP
(c) 1476 2239 2133 1260 1294 1491 1326 2830
20-N 30-N 10-P 20-P 30-P 10-NP 20-NP 30-NP
1367 0 600 1200 1800 2400 3000 10-N P H A c on ce n tra tio n (m g/ l) (d)
Note: 10-N (at 10oC with N limitation), 20-N (at 20oC with N limitation), 30-N (at 30oC with N limitation),
10-P (at 10oC with P limitation), 20-P (at 20oC with P limitation), 30-P (at 30oC with P limitation),
10-NP (at 10oC with N&P limitation), 20-NP (at 20oC with N&P limitation), 30-NP (at 30oC with N&P
IV. Conclusions
It is evident from the N&P limitation experimental data that PHA accumulation was better in the 10oC system compared to the two systems operated at the higher temperatures of 20 and 30oC. Although the 20oC system produced the highest MLSS concentration during PHA accumulation, the 10oC biomass stored a higher fraction of PHA content with less production time, resulting in the highest PHA yield (mg PHA/mg CODu). It was also observed that the PHA content during the second N&P limitation period reached the maximum value in shorter time than required during the first limitation period, but greater productions were obtained during the first limitation periods. The experiment with N&P limitation at 10oC produced the higher PHA productivity and yield in comparison with the experiments with either N or P limitations at the same temperature. The P limitation condition provided the lowest PHA productivities and yields at all experimental temperatures and, as a result, is not recommended for further study. Based on the results of these experiments, it is recommended that low temperatures, i.e. 10 to 20oC, be used for PHA production and harvesting for biodegradable plastics production. Anyway, COD removal efficiency (or COD utilization) was reduced during a peak of PHA accumulation and may not satisfy wastewater treatment purpose. The additional process line for biodegradable plastics production (using the same wastewater) may be required in parallel with a conventional process line of wastewater treatment in order to accomplish both benefits.
ACKNOWLEDGEMENT
REFERENCES
[1] S. Y. Lee, "Plastic bacteria? Progress and prospects for polyhydroxyalkanoate production in bacteria," Trends in Biotechnology,
vol. 14, no. 11, pp. 431-438, 1996.
[2] W. Punrattanasin, “Production of polyhydroxyalkanoates for biodegradable plastics using activated sludge biomass: system
development,” Ph.D. dissertation, Virginia Polytechnic Institute and State University, Blacksburg, Virginia, USA, 2001.
[3] S. Y. Lee, "Review bacterial polyhydroxyalkanoates," Biotechnology and Bioengineering, vol. 49, no. 1, pp. 1-14, 1996.
[4] G. Braunegg, G. Lefebvre and K.F. Genser, "Polyhydroxyalkanoates, biopolyesters from renewable resources: physiological and
engineering aspects," Journal of Biotechnology, vol. 65, no. 2-3, pp. 127-161, 1998.
[5] H. Satoh, Y. Iwamoto, T. Mino and T. Matsuo, "Activated sludge as a possible source of biodegradable plastic," Water Science
and Technology, vol. 38, no. 2, pp. 103-108, 1998.
[6] H. Takabatake, H. Satoh, T. Mino and T. Matsuo, "Recovery of biodegradable plastics from activated sludge process," in
Proceedings. 7th IAWQ Asia-Pacific Regional Conference: Asian Waterqual’99, Conference Preprint, Taipei, 1999, pp. 1175-1180.
[7] D. Rusendi and J. D. Sheppard, "Hydrolysis of potato processing waste for the production of poly-β-hydroxybutyrate," Bioresource
Technology, vol. 54, no. 2, pp. 191-196, 1995.
[8] F. Liu, W. Li, D. Ridgway and T. Gu, "Production of poly-β-hydroxybutyrate on molasses by recommbinant Escherichia coli,"
Biotechnology Letters, vol. 20, no.4, pp. 345-348, 1998.
[9] D.K. Wendlandt, M. Jechorek, J. Helm and U. Stottmeister, "Producing poly-3-hydroxybutyrate with a high molecular mass from
methane," Journal of Biotechnology, vol. 86, no. 2, pp. 127-133, 2001.
[10] J. Yu, "Production of PHA from starchy wastewater via organic acids," Journal of Biotechnology, vol. 86, no. 2, pp. 105-112, 2001.
[11] G. Du, J. Chen, J. Yu and S. Lun, "Continuous production of poly-3-hydroxybutyrate by Ralstonia eutropha in a two-stage culture
system," Journal of Biotechnology, vol. 88, no. 1, pp. 59-65, 2001.
[12] T. Sriwiriyarat, “Mathematical modelling and evaluation of IFAS wastewater treatment processes for biological nitrogen and
phosphorus removal,” Ph.D. dissertation, Virginia Polytechnic Institute and State University, Blacksburg, Virginia, USA, 2002.
[13] American Public Health Association, American Water Works Association and Water Pollution Control, Standard Methods for the
Examination of Water and Wastewater, 21st ed. Washington, DC, American Public Health Association, American Water Works
Association, Water Pollution Control, 2005.
[14] V. S. Hart, “An examination of biological phosphorus removal using bacteria counting and poly-beta-hydroxybutyrate analysis in
batch and continuous flow system,” M.S. thesis, Virginia Polytechnic Institute and State University, Blacksburg, Virginia, USA, 1994.
[15] T. Yamane, "Yield of poly-D(-)-3-hydroxybutyrate from various carbon sources: A theoretical study," Biotechnology and
Bioengineering, vol. 41, no. 1, pp. 165-170, 1993.
[16] P. Marchessault and J. D. Sheppard, "Application of self-cycling fermentation technique to the production of poly-β
-hydroxybutyrate," Biotechnology and Bioengineering, vol. 55, no. 5, pp. 815-820, 1997.
[17] S. Chinwetkitvanich, C. W. Randall and T. Panswad, Temperature effects on PHA production using activated sludge biomass with
nitrogen limitation, presented at the IWA conference on Environmental Biotechnology: Advancements on Water & Wastewater Application in the Tropics, December 9-10, Kuala Lumpur, Malaysia, 2003.
[18] S. Chinwetkitvanich, C. W. Randall and T. Panswad, "Effects of phosphorus limitation and temperature on PHA production in
activated sludge," Water Science and Technology, vol. 50, no.8, pp. 135-143, 2004.
[19] F. Wang and S. Y. Lee, "Poly(3-hydroxybutyrates) production with high productivity and high polymer content by a fed-batch
culture of Alcaligenes latus under nitrogen limitation," Applied Environmental Microbiology, vol. 63, no.9, pp. 3703-3706, 1997.
[20] C. Krishna and Mark C. M. Van Loosdrecht, "Effect of temperature on storage polymers and settleablility of activated sludge,"
Water Research, vol. 33, no. 10, pp. 2374-2382, 1999.
[21] T. Panswad, A. Doungchai and J. Anotai, "Temperature effect on microbial community of enhanced biological phosphorus removal
system," Water Research, vol. 37, no. 2, pp. 409-415, 2003.
[22] J. Choi and S. Y. Lee, "Factors affecting the economics of polyhydroxyalkanoate production by bacterial fermentation," Applied
Microbiology and Biotechnology, vol. 51, no.1, pp. 13-21, 1999.
[23] B. S. Kim, S. C. Lee, S. Y. Lee, H. N. Chang, Y. K. Chang and S. I. Woo, "Production of poly(3-hydroxybutyric acid) by fed-batch
culture of Alcaligenes eutrophus with glucose concentration control," Biotechnology and Bioengineering, vol. 43, no.9, pp.
892-898, 1994.
[24] T. Yamane, M. Fukunaga and Y. W. Lee, "Increased PHB productivity by high-cell-density fed-batch culture of Alcaligenes latus, a
growth-associated PHB producer," Biotechnology and Bioengineering, vol. 50, no. 2, pp. 197-202, 1996.
[25] B. S. Kim, S. C. Lee, S. Y. Lee, H. N. Chang, Y. K. Chang and S. I. Woo, "Production of poly(3-hydroxybutyric-co-3-hydroxyvaleric
acid) by fed-batch culture of Alcaligenes eutrophus with substrate control using on-line glucose analyzer," Enzyme and Microbial
Technology, vol. 16, no. 7, pp. 556-561, 1994.
[26] H. W. Ryu, S. K. Hahn, Y. K. Chang and H. N. Chang, "Production of poly(3-hydroxybutyrate) by high cell density fed-batch culture