This is a repository copy of The contribution of urbanization to non-communicable diseases : evidence from 173 countries from 1980 to 2008.
White Rose Research Online URL for this paper: http://eprints.whiterose.ac.uk/114610/
Version: Accepted Version
Article:
Goryakin, Yevgeniy, Rocco, Lorenzo and Suhrcke, Marc Eckart
orcid.org/0000-0001-7263-8626 (2017) The contribution of urbanization to
non-communicable diseases : evidence from 173 countries from 1980 to 2008. Economics and Human Biology. 151–163. ISSN 1570-677X
https://doi.org/10.1016/j.ehb.2017.03.004
[email protected] https://eprints.whiterose.ac.uk/ Reuse
Items deposited in White Rose Research Online are protected by copyright, with all rights reserved unless indicated otherwise. They may be downloaded and/or printed for private study, or other acts as permitted by national copyright laws. The publisher or other rights holders may allow further reproduction and re-use of the full text version. This is indicated by the licence information on the White Rose Research Online record for the item.
Takedown
If you consider content in White Rose Research Online to be in breach of UK law, please notify us by
The contribution of urbanization to non-communicable diseases: evidence from 173
countries from 1980 to 2008
Yevgeniy Goryakin a*, Lorenzo Roccob, Marc Suhrcke c
a The Organisation for Economic Co-operation and Development, Paris, France
bDepartment of Economics and Management, University of Padova, Padova, Italy
c Centre for Health Economics, University of York, York, United Kingdom
Abstract
It is widely believed that the expanding burden of non-communicable diseases (NCDs) is in
no small part the result of major macro-level determinants. We use a large amount of new
data, to explore in particular the role played by urbanization – the process of the population
shifting from rural to urban areas within countries – in affecting four important drivers of
NCDs world-wide: diabetes prevalence, as well as average body mass index (BMI), total
cholesterol level and systolic blood pressure. Urbanization is seen by many as a double-edged
sword: while its beneficial economic effects are widely acknowledged, it is commonly
alleged to produce adverse side effects for NCD-related health outcomes. In this paper we
submit this hypothesis to extensive empirical scrutiny, covering a global set of countries from
1980-2008, and applying a range of estimation procedures. Our results indicate that
urbanization appears to have contributed to an increase in average BMI and cholesterol
levels: the implied difference in average total cholesterol between the most and the least
urbanized countries is 0.40 mmol/L, while people living in the least urbanized countries are
also expected to have an up to 2.3 kg/m2 lower BMI than in the most urbanized ones.
Moreover, the least urbanized countries are expected to have an up to 3.2 p.p. lower
prevalence of diabetes among women. This association is also much stronger in the low and
middle-income countries, and is likely to be mediated by energy intake-related variables,
such as calorie and fat supply per capita.
1. Introduction
There is abundant evidence on the substantial disease burden caused by
non-communicable diseases (NCDs) and risk factors (Danaei et al., 2006; Ezzati et al., 2002; S
Lewington et al., 2002; Sarah Lewington et al., 2007), not only in high- but also in low- and
middle-income countries (LMICs). According to recent WHO estimates, NCDs were
responsible for 68% of the world’s deaths in 2012, with more than 40% of those considered
as ‘premature’, i.e. occurring before the age of 70. Almost three quarters of all NCD deaths
and the vast majority (82%) of premature deaths occur in LMICs (WHO, 2014). NCDs and
related risk factors, including hypertension, obesity, hypercholesterolemia and diabetes may
also lead to complications impairing people’s ability to live active and productive lives
(Suhrcke et al., 2006).
It is widely believed that the expanding burden of NCDs is in no small part the result
of major macro-level drivers (Hanefeld, 2015). In this paper we make use of a large amount
of new data to explore in particular the role played by urbanization – the process of the
population shifting from rural to urban areas within countries (Allender et al., 2008).
Urbanization is a factor that is commonly viewed as double-edged sword: while otherwise
known to promote higher living standards (Cochrane, 1983), or economic growth – at least up
to a point (Henderson, 2003)– some public health researchers and advocates have emphasised
the allegedly negative side-effects that urbanization may have in terms of enhancing the
prevalence of NCD-related risk factors (Allender et al., 2011). Should these claims stand up
to further empirical scrutiny – which is what we seek to provide here – then there may be a
more informed case for policy to seek ways to confront the challenge of harnessing the
benefits of this major macro process while at the same time avoiding its potential collateral
Why might urbanization contribute to the spread of NCD-related risk factors? First,
urbanization may be related to the nutritional transition towards diets high in saturated fats,
sugar and calories (Popkin, 1999), thereby contributing to the spread of obesity, diabetes and
high blood pressure. Such diets can also contribute to higher total blood cholesterol levels
(Howell et al., 1997; Sacks & Katan, 2002; Schaefer et al., 2009). Second, urbanization may
be related to the reduction in energy expenditure because of the structural economic transition
from agriculture to less physically demanding service employment (Popkin, 1999).
Urbanization may also lead to less energy expenditure for a number of other reasons, for
example because of greater car use and lower level of physical exercise (Monda et al., 2007).
Owing to the efforts of the Global Burden of Metabolic Risk Factors of the Chronic
Diseases Collaborating Group, we are now in a position to explore quantitatively how four
major NCD-related risk factors – average body mass index (BMI), average total cholesterol
(TC), mean systolic blood pressure (SBP) and the prevalence of diabetes – respond to
urbanization in a large, global set of countries, using annual data from 1980 to 2008,
separately by gender. We also explore two potential pathways through which urbanization
may be linked to these risk factors.
The contribution of our paper is in bringing together several unique datasets, in order
to rigorously examine, for the first time to our knowledge, the role of urbanization (defined as
the proportion of people living in urban areas, as per national statistical offices), using data
from 173 countries, spanning 29 years (1980-2008). Crucially, the longitudinal nature of the
data makes it possible to control for country fixed effects, reinforcing the causal
2. Study data and methods
2.1 Data Source and Measures
We combine data from several sources, for the period 1980-2008, over which our
outcome variables of interest are available. Data on NCD risk factors are taken from the
Global Burden of Metabolic Risk Factors Project of the Chronic Diseases Collaborating
Group at Imperial College London (2014). In particular we use age-standardized
country-level average BMI, TC and SBP country-levels and diabetes prevalence, for adults aged 20 years and
older. Briefly, the data have been estimated on the basis of a large number of surveys, articles
and epidemiological studies (Danaei et al., 2011a; Danaei et al., 2011b; Finucane et al.,
2011). Although as much effort as possible was made to obtain the actual estimates from the
epidemiological literature, in a minority of cases the data was unavailable. Such missing data
was modelled as a function of time-varying, country-level economic, demographic and
epidemiological characteristics. Furthermore, in order to reduce the impact of short-term
fluctuations in the predictor variables over time, their weighted averages were used, with
decreasing weights for observation more distant in the past. The prediction Bayesian models
were fit using Markov Chain Monte Carlo algorithm.
This dataset was recently used to study, for example, the association between market
deregulation, fast food consumption and BMI (De Vogli et al., 2014a), and to estimate the
"ideal" GDP per capita level at which the economic activity is sustainable in terms of CO2
emissions, and healthy BMI levels (Egger et al., 2012). The data was also recently used to
estimate population-level associations between nutrient intake and average BMI, glucose and
cholesterol levels (Dave et al., 2016). Using these data, Doytch et al (2016) found that both
caloric intake and physical inactivity can partly explain the impact of GDP per capita and
Data on the proportion of people living in urban areas (i.e. the urbanization rate) are
from the World Bank’s World Development Indicators (WDI)1. This data is originally
collected by the national statistical offices, but is further smoothed by the United Nations
Populations Division. Specifically, "percentages urban are the numbers of persons residing in
an area defined as ''urban'' per 100 total population"2
. Additional control variables are from
the WDI (population growth rate (annual, %); population density (per square km of land
area); services value added (as a % of GDP); logarithm of the GDP per capita (constant 2005
US$); proportion of the population aged 16-64 years; proportion of the population who are
female), FAOSTAT3
(food supply, kcal/capita/day; fat supply, g/capita/day).
2.2 Analytic Methods
In our empirical analysis we include control variables that account for countries’
differential propensities to urbanize, and which also influence NCD risk factors and
conditions. First, we control for both the population growth rate and population density, as
they may be associated with both urbanization (Canning, 2011) and average population
health (Hinrichsen & Robey, 2000). We also control for two other potential correlates of
urbanization- proportion of population who are female, as well as proportion of population of
working age (aged 15-64 years). We also control for the level of economic development,
either by splitting countries into income groups (as described below), or by controlling for the
gross domestic product (GDP) per capita in the pooled models. In addition, following Glaeser
(2014), we control for agricultural productivity measured as cereal yield in kilograms per
hectare times hectares per capita, as this was shown to be a driver of urbanization, both
theoretically and empirically (Glaeser, 2014). Second, we account for all relevant
time-invariant, country-level factors that may affect both NCDs and urbanization, such as - among
1 http://data.worldbank.org/data-catalog/world-development-indicators 2http://data.worldbank.org/indicator/SP.URB.TOTL.IN.ZS
others - geographical and institutional characteristics, by controlling for country fixed effects.
Third, we include a general time trend, as well as ten region-specific4 time trends to control
for any common regional factors that may be changing over time. Forth, to account for the
possibility that the outcome variable may simultaneously affect the independent variable of
interest, we lag urbanization by one period in all specifications.
More formally, our main equation is as follows:
it i 2 1
it 1 j
it X '
Y Zit (1)
Where Yitjis one of the four outcome variables j associated with country i at time t;
Xit-1 is lagged urbanization; Zit is the vector of control variables as described above, including
general and region-specific time trends, with the associated parameter vector 2; i are
country fixed effects, possibly correlated with X and Z, and it is an error term. Due to the
fact that it might exhibit serial correlation, even conditional on time trends, we estimate
cluster-robust standard errors (clustered at the country level).
We estimate model (1) by means of a panel fixed-effect estimator that is consistent
(although not necessarily the most efficient), conditional on the assumption of strict
exogeneity of it . Our main focus is on the urbanization parameter 1.
In the analysis by income level, countries are split into two groups: 1) high income
countries (HICs), and 2) low and middle income countries (LMICs), using year-specific
thresholds applied to Gross National Income per capita (current Atlas US$), estimated by the
World Bank Atlas method5.
Urbanization does not only influence lifestyles, but also supports economic
development and accompanies the structural change from agriculture to manufacturing. For
4
The regions are: Sub-Saharan Africa; Latin America and Caribbean; East Asia; Mediterranean and North Africa; Eastern and Southern Europe; Former Soviet Union; North America; Pacific; South Asia; Western Europe.
5
most – though by no means for all – individuals the latter imply a significant increase in
income that, in turn, stimulates greater investment in education. Since income and education
have been shown to be key determinants of health (Pritchett & Summers, 1996), it turns out
that urbanization can influence health both directly, e.g. by means of its influence on
lifestyles, and indirectly, via its effect on economic development, as well as through a range
of other potential channels. In this paper we estimate both the total effect of urbanization (i.e.
the combination of the direct and the indirect effects), as well as account for its impact
through two potential mediators, trying to shed light on the current debate on the relative
importance of energy-expending vs energy-consuming factors in explaining the growing
obesity burden around the world (Cutler et al., 2003; Finkelstein et al., 2005). Specifically, as
urbanization may be linked with health through its effect on diets (Popkin, 1999), we estimate
the effect of urbanization on total calorie supply per capita, as well as on fat supply per
capita.
3. Results
3.1 Descriptive statistics
We start by describing trends in the NCD risk factors/conditions of interest, by
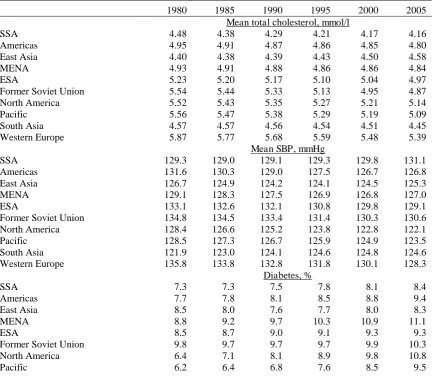
geographical regions (with regional averages weighted by country population size)6. Table 1
shows that average TC levels have been decreasing in almost all regions (except East Asia), if
to varying degrees. Over most of the observation period, Western Europe and North America
had the highest and SSA the lowest level, as expected. Similarly, in most regions, especially
those composed of mostly richer countries, mean SBP has declined, with the notable
exception of Africa and South Asia. In the late 1990s, the SBP trend flattened out in the
former Soviet Union (FSU), following a period of sustained decline. In contrast, diabetes
6
prevalence has increased in all regions throughout the observation period. North America and
Middle East and North Africa (MENA) had the highest mean prevalence, while SSA and East
Asia displayed lower levels. Western Europe had the lowest diabetes prevalence of all
regions.
On the other hand, average BMI has been increasing in all regions, if to varying
degrees. By the mid-1990s, North America had already reached the highest average BMI
value, although the Middle East and North Africa (MENA) region has been catching up
gradually. Finally, the proportion of people living in urban areas increased in all but two
regions – the FSU and the Pacific. East Asia stands out as the region with the fastest
[image:10.595.77.512.389.765.2]urbanization growth rate.
Table 1: Trends in outcome and main explanatory variables, by region
1980 1985 1990 1995 2000 2005
Mean total cholesterol, mmol/l
SSA 4.48 4.38 4.29 4.21 4.17 4.16
Americas 4.95 4.91 4.87 4.86 4.85 4.80
East Asia 4.40 4.38 4.39 4.43 4.50 4.58
MENA 4.93 4.91 4.88 4.86 4.86 4.84
ESA 5.23 5.20 5.17 5.10 5.04 4.97
Former Soviet Union 5.54 5.44 5.33 5.13 4.95 4.87
North America 5.52 5.43 5.35 5.27 5.21 5.14
Pacific 5.56 5.47 5.38 5.29 5.19 5.09
South Asia 4.57 4.57 4.56 4.54 4.51 4.45
Western Europe 5.87 5.77 5.68 5.59 5.48 5.39
Mean SBP, mmHg
SSA 129.3 129.0 129.1 129.3 129.8 131.1
Americas 131.6 130.3 129.0 127.5 126.7 126.8
East Asia 126.7 124.9 124.2 124.1 124.5 125.3
MENA 129.1 128.3 127.5 126.9 126.8 127.0
ESA 133.1 132.6 132.1 130.8 129.8 129.1
Former Soviet Union 134.8 134.5 133.4 131.4 130.3 130.6
North America 128.4 126.6 125.2 123.8 122.8 122.1
Pacific 128.5 127.3 126.7 125.9 124.9 123.5
South Asia 121.9 123.0 124.1 124.6 124.8 124.6
Western Europe 135.8 133.8 132.8 131.8 130.1 128.3
Diabetes, %
SSA 7.3 7.3 7.5 7.8 8.1 8.4
Americas 7.7 7.8 8.1 8.5 8.8 9.4
East Asia 8.5 8.0 7.6 7.7 8.0 8.3
MENA 8.8 9.2 9.7 10.3 10.9 11.1
ESA 8.5 8.7 9.0 9.1 9.3 9.3
Former Soviet Union 9.8 9.7 9.7 9.7 9.9 10.3
North America 6.4 7.1 8.1 8.9 9.8 10.8
South Asia 7.6 7.8 8.1 8.5 9.6 10.5
Western Europe 6.5 6.2 6.2 6.4 6.5 6.9
Mean BMI, kg/m2
SSA 21.07 21.26 21.48 21.74 22.05 22.45
Americas 23.59 23.98 24.39 24.85 25.34 25.84
East Asia 21.37 21.53 21.74 22.04 22.36 22.61
MENA 24.18 24.70 25.13 25.61 26.19 26.75
ESA 25.25 25.39 25.61 25.71 26.00 26.37
Former Soviet Union 25.65 25.64 25.63 25.50 25.44 25.85
North America 25.05 25.67 26.25 26.86 27.41 27.96
Pacific 23.79 24.30 24.89 25.47 25.99 26.53
South Asia 20.75 20.69 20.68 20.71 20.96 21.14
Western Europe 24.82 24.97 25.20 25.46 25.74 26.03
Urban, %
SSA 22.3 24.6 27.1 29.1 30.9 33.0
Americas 63.8 67.2 70.3 72.9 75.4 77.1
East Asia 26.6 29.7 32.9 36.6 40.6 46.0
MENA 49.6 52.6 54.8 56.6 58.5 60.6
ESA 53.3 56.9 59.6 60.9 61.9 63.4
Former Soviet Union 62.7 64.6 65.6 65.0 64.6 64.3
North America 72.3 73.4 74.5 76.3 78.0 79.0
Pacific 70.0 69.3 69.2 69.1 69.1 69.1
South Asia 22.3 23.7 25.0 26.2 27.4 29.1
Western Europe 72.1 72.6 73.2 73.9 74.5 75.5
Note: for each country, an average value for each of our three outcome variables is estimated for total
population (taking into account information on % of males/females in the population), which is then averaged to give the NCD risk factor prevalence by region, weighted by country population sizes. SSA: Sub-Saharan Africa; ESA: Eastern and Southern Europe; MENA: Middle East and North Africa.
The next set of figures provides an initial glance at the shape of the bivariate
relationships between urbanization and each of the outcome variables by income group, as
well as showing how this relationship has changed over time. What is quite striking is that in
figures 1 and 2, and to a smaller extent in figure 3, the relationship between urbanization and
the NCD risk factors has been clearly positive in LMICs. On the other hand, the direction of
the association was much less pronounced in the sample of HICs. This was not the case for
SBP- the association was equally ambiguous in both HICs and LMICs (Figure 4). Also,
average BMI levels and diabetes prevalence have tended to increase over time for a given
Figure 1. Average BMI (kg/m2) by % living in urban areas, time period and income group
Figure 2. Average total cholesterol (mmol/l) by % living in urban areas, time period and income group
20
22
24
26
28
0 20 40 60 80 100
% urban, HICs
0 20 40 60 80 100
% urban, LMICs
1980s 1990s
2000s
4
4
.5
5
5
.5
6
0 20 40 60 80 100
% urban, HICs
0 20 40 60 80 100
% urban, LMICs
1980s 1990s
[image:12.595.76.423.403.651.2]Figure 3. Average diabetes prevalence by % living in urban areas, time period and income group
Figure 4. Average SBP (mmHg) by % living in urban areas, time period and income group
6
8
10
12
14
0 20 40 60 80 100
% urban, HICs
0 20 40 60 80 100
% urban, LMICs
1980s 1990s
2000s
126
128
130
132
134
0 20 40 60 80 100
% urban, HICs
0 20 40 60 80 100
% urban, LMICs
1980s 1990s
[image:13.595.76.415.412.658.2]3.2 Regression results
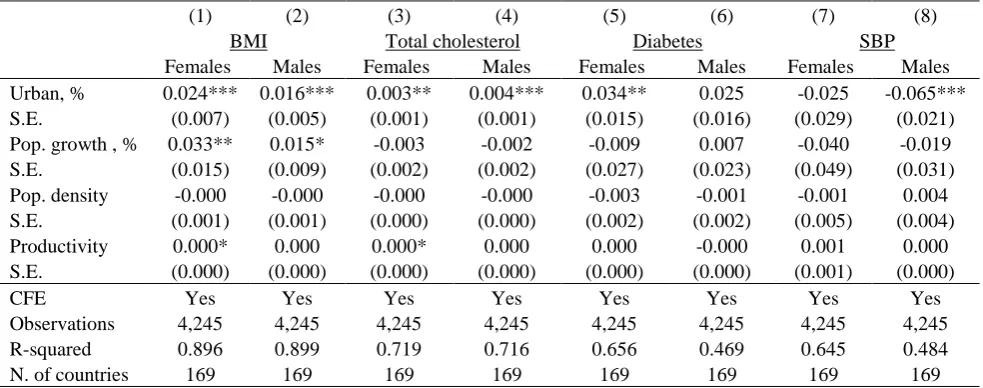
Results are reported separately for each outcome variable and by gender (Table 2). All
models include controls, country fixed effects, general and region-specific time trends. In the
pooled sample including all countries, urbanization is significantly positively related to mean
BMI and average total cholesterol. In addition, it is significantly positively related to diabetes
prevalence among women, and negatively- to average SBP among men. . While the
association with BMI is positive and significant for both men and women, it is somewhat
stronger for the latter: each p.p. increase in the proportion of people living in urban areas is
related to an increase in BMI of about 0.024 among women, and by 0.016 among men.
Likewise, the association is stronger for women when the outcome is diabetes: each p.p.
increase in the extent of urbanization is predicted to lead to an almost 0.034 p.p. greater
diabetes prevalence in this group. We note that the evidence presented here is consistent with
[image:14.595.72.564.482.676.2]bivariate relationships shown in Figures 1-4.
Table 2: Association between urbanization and NCDs, full sample
(1) (2) (3) (4) (5) (6) (7) (8)
BMI Total cholesterol Diabetes SBP
Females Males Females Males Females Males Females Males
Urban, % 0.024*** 0.016*** 0.003** 0.004*** 0.034** 0.025 -0.025 -0.065***
S.E. (0.007) (0.005) (0.001) (0.001) (0.015) (0.016) (0.029) (0.021)
Pop. growth , % 0.033** 0.015* -0.003 -0.002 -0.009 0.007 -0.040 -0.019
S.E. (0.015) (0.009) (0.002) (0.002) (0.027) (0.023) (0.049) (0.031)
Pop. density -0.000 -0.000 -0.000 -0.000 -0.003 -0.001 -0.001 0.004
S.E. (0.001) (0.001) (0.000) (0.000) (0.002) (0.002) (0.005) (0.004)
Productivity 0.000* 0.000 0.000* 0.000 0.000 -0.000 0.001 0.000
S.E. (0.000) (0.000) (0.000) (0.000) (0.000) (0.000) (0.001) (0.000)
CFE Yes Yes Yes Yes Yes Yes Yes Yes
Observations 4,245 4,245 4,245 4,245 4,245 4,245 4,245 4,245
R-squared 0.896 0.899 0.719 0.716 0.656 0.469 0.645 0.484
N. of countries 169 169 169 169 169 169 169 169
As a robustness check, in the Annex (Tables A2.1-A2.3), we compare regression
estimates between models where the outcome is defined either with the Global Burden of
Diseases, Injuries, and Risk Factors (GBMRF) data, or with the alternative Global Health
Observatory (GHO) repository from the WHO7. GBMRF estimates were prepared as part of
the wider Global Burden of Diseases, Injuries, and Risk Factors study, and as such both are
based on Bayesian meta-regression modelling methodology. The GHO estimates were also
based on Bayesian methodology, though they relied on inputs from a number of other
collaborators and/or data sources. The correlation between GBMRF and GHO measures is
very high for BMI (0.96) and for total cholesterol (0.99) and it is weaker for systolic blood
pressure (0.87). On the whole, regardless of the outcome variable used, there is very little
difference between parameter estimates
Results presented in Table 3 indicate that the association between urbanization and
NCD risk factors is almost totally driven by the LMICs group, which is also consistent with
the bivariate associations shown in Figures 1, 2 and 3. Indeed, it is always insignificant in the
HICs, while the reverse is true for BMI, total cholesterol, diabetes (for both genders) and SBP
(for males) among the LMICs. Interestingly, each p.p. increase in urbanization is related to an
about 0.05% increase in the prevalence of diabetes in LMICs, while in the full sample we
[image:15.595.72.553.595.726.2]found much weaker association.
Table 3. Association between urbanization and NCDs, by country income group
(1) (2) (3) (4) (6) (7) (5) (8)
BMI TC Diabetes SBP
Females Males Females Males Males Females Females Males
High income countries
Urban, % -0.004 0.004 0.001 0.000 -0.013 -0.060 -0.012 -0.049
S.E. (0.018) (0.012) (0.005) (0.005) (0.040) (0.048) (0.055) (0.057)
Country fixed effects Yes Yes Yes Yes Yes Yes Yes Yes
Observations 846 846 846 846 846 846 846 846
R-squared 0.897 0.941 0.877 0.870 0.728 0.689 0.941 0.852
Number of countries 47 47 47 47 47 47 47 47
Low and middle income countries
7
Urban, % 0.026*** 0.020*** 0.003* 0.004*** 0.052*** 0.047*** -0.048 -0.08***
S.E. (0.008) (0.006) (0.002) (0.001) (0.017) (0.018) (0.033) (0.025)
CFE Yes Yes Yes Yes Yes Yes Yes Yes
Observations 3,232 3,232 3,232 3,232 3,232 3,232 3,232 3,232
R-squared 0.899 0.866 0.705 0.624 0.706 0.453 0.601 0.241
Number of countries 146 146 146 146 146 146 146 146
Notes: Robust standard errors in parentheses: *** p<0.01, ** p<0.05, * p<0.1. Standard errors are clustered at country level. In all models, urbanization is lagged by one year. All models also control for population growth rate, population density, productivity, proportion of the population aged 15-64 years, female proportion of the population, time trend, region-specific time trends and country fixed effects.
In the Annex, Table A4, we consider a further subdivision between middle and
low-income countries. Results suggest that the association continues to be strong among the
middle income countries, while becoming slightly weaker in the low income countries
(although it continues to remain significant there for BMI and diabetes, despite large
reduction in the sample size).
To further investigate the potentially heterogeneous urbanization effect, we group
countries according to the intensity of their urbanization process. We find that in the three
regions that underwent the fastest process of urbanization (as per Table 5) - East Asia,
Americas and Sub Saharan Africa - urbanization was related to a greater impact on BMI and
diabetes than in the remaining regions, while the reverse was true for TC. No clear pattern
emerged for SBP (see tables A3.1-A3.4 in the Annex).
Finally, we conduct a tentative pathway analysis of the association between
urbanization and health outcomes. A rather widespread approach to this is to use the baseline
model as a starting point, subsequently adding new potential mediators and thereby assessing
how the association between main variables of interest changes. However, as was shown
elsewhere (Angrist & Pischke, 2008; Bullock & Ha, 2011) and is often under-appreciated,
doing so can produce biased estimates, as the ceteris paribus assumption will be violated.8
Therefore, we will follow a different approach, which despite not providing a definite answer
8
as to how much a certain variable may mediate the association of interest, should at least
provide some indication of whether the variable in question is (or is not) indeed a mediator.
Specifically, we select two potential mediators related to energy availability, based on
the available medical evidence that links them with NCD risk factors: food supply
(kcal/capita/day) and fat supply (g/capita/day)). This choice was based on the literature
showing that both population and individual-level energy intake is positively related to
average BMI and overweight (Dave et al., 2016; Doytch et al., 2016; Goryakin & Suhrcke,
2014) and diabetes (Pan et al., 1997), although its relationship with average total cholesterol
is more nuanced, with "bad" LDL cholesterol levels in the blood being positively related to
only some kinds of fats, e.g. trans fat and saturated fat consumption (Mensink & Katan,
1990). Similarly, total cholesterol levels also appears to be positively related to saturated fat
consumption (Clarke et al., 1997).
We estimate the effect of urbanization on these mediators, denoted Mjit , by regressing
each of them on lagged urbanization (equation 2), the same controls as in equation (1)
including country fixed effects and time trends. The results are shown in Table 4 below.
it i 1
it j
it X
M 1 Zit' 2 (2)
Table 4. The association of urbanization with potential mediators related to energy availability
(1) (2)
Food supply, kcal/capita/day
Fat, g/capita/day
Urban, % 5.784* 0.307**
(3.062) (0.137)
CFE Yes Yes
Observations 3,992 3,992
R-squared 0.324 0.346
Number of countries 159 159
We find that both energy supply-related variables are significantly related to
urbanization. These findings suggest that part of the effect of urbanization on NCDs risk
factors is potentially mediated by the higher calories intake and nutritional habits that are
likely to emerge in urban environments.
The question also remains about whether the effect of urbanization is constant, or
whether it might also depend on the prevalence of a risk factor in a given country. To check
this possibility, we augmented model (1) by the interaction between urbanization and the
initial level of the risk factor Yi0. The initial level of the risk factor Yi0 is predetermined
compared to the current level of urbanization and country fixed effects will capture those
predetermined factors that might have produced the co-evolution of urbanization and risk
factors before and up to time 0. The results (shown in Appendix, Table A5) suggest that the
effect of urbanization on all outcomes (except diabetes) declines with a greater baseline
prevalence of these risk factors.
4. Discussion
In our analysis, urbanization turned out to be a consistent driver of at least two
NCD-related risk factors: BMI and TC. However, its effect is comparatively modest: only if we
hypothetically decreased urbanization from its sample maximum (100 percent) to its
minimum (5 percent), then the implied reduction in the NCD risk factors would be of an
appreciable magnitude. Specifically, the corresponding average reduction in TC would be
0.40 mmol/L, which is about equal to one standard deviation in this variable; the reduction in
BMI of 2.3 kg/m2; and the reduction in diabetes prevalence of 3.2 p.p. (only among women).
The latter two effects would be comparable to those obtainable by means of certain diet and
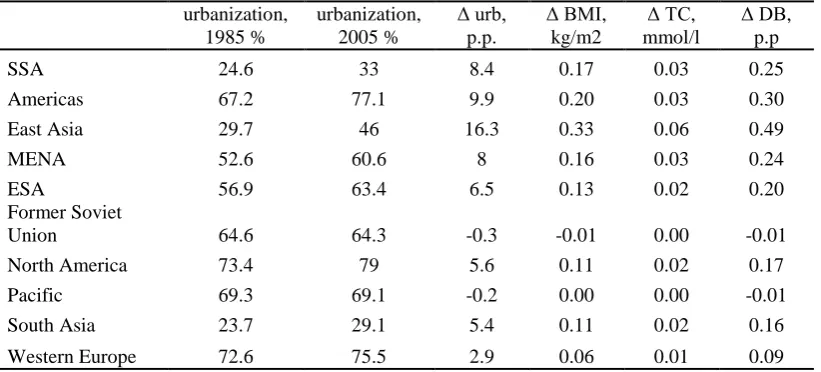
programs9 (Group, 2002). More realistically, if we considered a variation in the urbanization
rate equivalent to that which occurred between 1985 and 2005, then the changes in the risk
[image:19.595.73.484.196.382.2]factors predicted by model (2) is of the magnitudes reported in Table 5, for each region.10
Table 5. Predicted changes in the risk factors explained by a variation in urbanization rates equivalent to that observed between 1985 and 2005. By region.
urbanization, 1985 % urbanization, 2005 % urb, p.p. BMI, kg/m2 TC, mmol/l DB, p.p
SSA 24.6 33 8.4 0.17 0.03 0.25
Americas 67.2 77.1 9.9 0.20 0.03 0.30
East Asia 29.7 46 16.3 0.33 0.06 0.49
MENA 52.6 60.6 8 0.16 0.03 0.24
ESA 56.9 63.4 6.5 0.13 0.02 0.20
Former Soviet
Union 64.6 64.3 -0.3 -0.01 0.00 -0.01
North America 73.4 79 5.6 0.11 0.02 0.17
Pacific 69.3 69.1 -0.2 0.00 0.00 -0.01
South Asia 23.7 29.1 5.4 0.11 0.02 0.16
Western Europe 72.6 75.5 2.9 0.06 0.01 0.09
To illustrate, in the SSA region, the proportion of people living in urban areas
increased by about 8.4 p.p. between 1985 and 2005. Holding everything else constant, and
based on results in Table 2, the implied change in average BMI in that region, if urbanization
increased by the same 8.4 p.p. in the future, would be by about 0.17 kg/m2; the increase in TC
would be 0.03 mmol/l; and the proportion of people living with diabetes would increase by
about 0.25 p.p. That said, an increase in BMI does not necessarily imply worsening health
status, especially in the context of low income countries, where a significant proportion of
people is underweight. Also, note that despite generally increasing urbanization rates in most
regions between 1985 and 2005, a number of regions experienced declines in the risk factors
over the same period (Table 1), suggesting that improvements in health may continue despite
more people moving to live in the cities.
9
In the lifestyle intervention program, participants were expected to achieve a weight reduction of at least 7 percent, through a healthy diet, and at least 150 minutes of moderate intensity exercise per week.
10
Taken together, our findings suggest that potentially desirable effects of urbanization
on selected NCD risk factors (e.g. via improved health services) may be outweighed by
certain adverse ones, possibly including less healthful diets, lack of exercise, higher pollution
and stress levels that could also result from urbanization. It is notable that urbanization is
more strongly (and positively) related to energy-imbalance-related NCD risk factors, i.e. TC,
diabetes and BMI, which suggests that people living in cities may tend to get more exposed
to energy-dense foods, and may develop a greater preference for calorie-rich "Western" diets
(Popkin, 1999, 2001; Popkin et al., 2012; Popkin & Gordon-Larsen, 2004; Yusuf et al., 2001)
or may have reduced opportunities for physical activity (Monda et al., 2007; Popkin, 1999;
Swinburn et al., 2011). Our preliminary pathway analysis in particular indicates that two
variables related to energy intake – total calorie and fat per capita supply – are potentially
mediating the association between urbanization and NCD risk factors.. This finding seems
particularly salient in view of the strong evidence on the steady increase in caloric intake
around the world in the recent decades, and that overweight burden is significantly driven by
growing calorie consumption from energy-dense foods (Cutler et al., 2003; Dave et al., 2016;
Finkelstein et al., 2005).
The question still remains about why the effect of urbanization on SBP may be
weaker than on BMI/TC/diabetes. The main population-level determinants of SBP include
salt intake, fruit and vegetable consumption, exercise, adiposity and antihypertensive
medications use. Although energy imbalances caused by urbanization are likely to lead to
greater diabetes prevalence, BMI and TC levels, they can also affect SBP levels more
ambiguously, for example through an increase in the fruit and vegetable consumption likely
to be more available in urban areas, or through greater take-up of antihypertensive
medications in urbanized health systems. If these behaviours counteract the adverse impact of
priori unclear. In line with this logic, a number of studies have attributed the observed decline
in the SBP levels to more intensive management of hypertension with medications, which
tends to be much more widespread in the richer countries (which coincidentally are more
urbanized) (Danaei et al., 2011a). There has not been much research on the relationship
between living in urban areas and fruit and vegetable consumption, but at least two studies
found evidence of positive association (Goryakin et al., 2015b; Johansson et al., 1999).
It is also notable that the association between urbanization and three NCDs risk
factors is always positive but considerably stronger in the sample of LMICs compared to the
HICs. A similar pattern has also been observed by Goryakin and Suhrcke (2014) and Popkin
et al. (2012) who found that living in urban areas is positively associated with the probability
of being overweight predominantly in the low income countries. We think that such
difference between LMIC and HIC countries may be due to a trade-off between the demand
for calories and the demand for healthy lifestyles whose balance depends on the level of
country income. In the LMICs, living in urban areas is associated with greater demand for
calories compared to rural areas (Neuman et al., 2013) due to the better socio-economic
conditions generally available in urban areas (Monteiro et al. 2004). As countries get richer,
the demand for thinness and for healthier lifestyles increases especially among the urban
residents. The latter may outweigh the demand for calories (Goryakin & Suhrcke, 2014).11
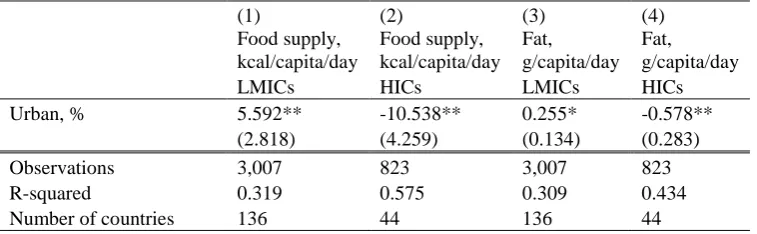
Our data provide an opportunity of testing this hypothesis by estimating whether the
effect of urbanization on the demand for calories is stronger in LMICs compared to HICs. We
thus estimate model (2) separately in the LMICs and the HICs focusing on the two energy
supply outcomes discussed above. Our results suggest that urbanization is positively
associated with equilibrium supply of calories/fats in LMICs but not HICs. This is in line
11
with our expectation that living in urban areas in LMICs should be related to higher SES and,
in turn, higher SES should be related to greater equilibrium supply and demand for calories
there. On the other hand, we should expect that living in urban areas in HICs should lead to
greater demand for healthier diet, if the "Monteiro Hypothesis" is correct, and the results in
[image:22.595.72.451.265.382.2]Table 6 also support this.
Table 6. Association of urbanization with energy intake mediators, by income group
(1) (2) (3) (4)
Food supply, kcal/capita/day
Food supply, kcal/capita/day
Fat, g/capita/day
Fat, g/capita/day
LMICs HICs LMICs HICs
Urban, % 5.592** -10.538** 0.255* -0.578**
(2.818) (4.259) (0.134) (0.283)
Observations 3,007 823 3,007 823
R-squared 0.319 0.575 0.309 0.434
Number of countries 136 44 136 44
Notes: Robust standard errors in parentheses: *** p<0.01, ** p<0.05, * p<0.1. Standard errors are clustered at country level. In all models, urbanization is lagged by one year. All models also control for population growth rate, population density, productivity, proportion of the population aged 15-64 years, female proportion of the population,, time trend, region-specific time trends and country fixed effects.
Several previous studies focussing on LMICs found positive association between
urbanization (or at least living in the city) and BMI, overweight and obesity (Delisle et al.,
2012; Goryakin et al., 2015a; Goryakin & Suhrcke, 2014; Ambady Ramachandran et al.,
2008), consistent with our findings in Figure 1 and Table 3. Likewise, diabetes prevalence
was found to be positively related to the extent of urbanization (or living in the city) in earlier
work, eg in (Ambady Ramachandran et al., 2008; A Ramachandran et al., 1999), consistent
with findings presented in Figure 3 and Table 3. Several studies also found a positive link
between urbanization and abnormal cholesterol levels in LMICs (Delisle et al., 2012;
Snehalatha & Ramachandran, 2009; Vorster et al., 2000), again consistent with our findings
in Figure 2 and Table 3. In a review article, Ibrahim and Damasceno (2012) found that
hypertension prevalence was generally higher in urban compared to rural areas in several
potential confounders. On the other hand, in a study by Delisle et al (2012), average SBP of
those living in a large city was significantly smaller than of those living in rural areas in
Benin, which is consistent with results in Table 3. Likewise, those living in the wealthiest
urban areas in South Africa were also found to have lower mean blood pressure then the
reference group (Vorster et al., 2000). Our paper adds to this body of evidence by providing a
"big picture", based on advanced econometric analysis of several large country level datasets
covering the great majority of world countries.
As far as we are aware, similar data as in our present paper was only used in three
previously published papers. In the first one, Danaei et al (2013) graphically showed positive
bivariate associations between extent of urbanization and average BMI, in 1980 and 2008, for
both men and women. Our paper differs in several important respects: 1) we show graphical
associations by different time periods and different country income levels, including for
average SBP, diabetes and cholesterol levels; 2) we estimate multivariate models, controlling
for a range of potential confounders, time trends and country fixed effects and 3) we test for
the link between urbanization and two potentially important mediators. In the second paper,
(De Vogli et al., 2014b) estimated the impact of market deregulation on average BMI,
controlling for the % of population living in urban areas (and several other variables). In their
study, however, the country sample was limited to only 25 high income OECD countries; the
impact of urbanization was not of primary interest (and therefore their control variables were
different from ours); they did not explore the impact of urbanization on other outcomes. Still,
they found urbanization to be positively and significantly related to average BMI. In the third,
(De Vogli et al., 2014a) estimated the association between country-level economic
globalization and average BMI. Again, the impact of urbanization was not of primary interest
urbanization were not presented in the paper), the sample of countries was smaller, and the
impact on other outcomes of potential interest was not measured.
In interpreting the results, the limitations of our study need to be borne in mind. Thus,
our outcome variables do not always reflect empirically observed data, but instead are often
estimates, if carefully derived ones and arguably the best and most comprehensive available,
as they are based on a large number of surveys, and related direct and indirect
epidemiological evidence (Danaei et al., 2011a; Danaei et al., 2011b; Finucane et al., 2011).
However, most of potential measurement error is likely to be country-specific, and thus is
wiped out in country fixed effects models. Any remaining measurement error is unlikely to
bias the estimates, but will rather reduce their precision. The fact that we still find statistically
significant estimates, particularly in LMICs where measurement error concerns are arguably
stronger, is reassuring. In addition, in our outcome variables validation exercise, we found
that the correlation between GBMRF and GHO indicators was very high, particularly for
BMI and TC outcomes, and that regression parameter estimates differed very little, regardless
of the source of the outcome variables.
We also acknowledge that it is rarely possible to draw strong causal conclusions
based on observational data. However, we at least increase the confidence in the causal nature
of the estimated relationship by controlling for country fixed effects, general and
region-specific time trends, as well as by lagging the main covariate of interest – urbanization – by
one year.
Bearing in mind these caveats, and while the overall magnitude of the effect appears
quite modest, urbanization consistently emerges as a relevant driver of NCD risk factors in
our study. In this sense we provide a useful complement to the previous accounts, which were
largely based on anecdotal or conceptual discussions or more descriptive analysis. In light of
should be targeted towards preventing and mitigating the adverse side effects of urbanization,
in particular in low and middle income countries.
Acknowledgements: Funding from the British Heart Foundation, Cancer Research UK,
Economic and Social Research Council, Medical Research Council, the National Institute for
Health Research, and the Wellcome Trust, under the auspices of the UK Clinical Research
Collaboration, is gratefully acknowledged. 087636/Z/ 08/Z ESRC: ES/G007462/1.
The opinions expressed and arguments employed herein are solely those of the authors and
References
Allender, S., Foster, C., Hutchinson, L., & Arambepola, C. (2008). Quantification of urbanization in relation to chronic diseases in developing countries: a systematic review. Journal of urban health, 85, 938-951.
Allender, S., Wickramasinghe, K., Goldacre, M., Matthews, D., & Katulanda, P. (2011). Quantifying urbanization as a risk factor for noncommunicable disease. Journal of urban health, 88, 906-918.
Angrist, J.D., & Pischke, J.-S. (2008). Mostly harmless econometrics: An empiricist's companion: Princeton university press.
Bullock, J.G., & Ha, S.E. (2011). Mediation analysis is harder than it looks. Cambridge handbook of experimental political science, 508-521.
Canning, D. (2011). The causes and consequences of demographic transition. Population studies, 65, 353-361.
Clarke, R., Frost, C., Collins, R., Appleby, P., & Peto, R. (1997). Dietary lipids and blood cholesterol: quantitative meta-analysis of metabolic ward studies. Bmj, 314, 112. Cochrane, S.H. (1983). Effects of education and urbanization on fertility.
Cutler, D., Glaeser, E., & Shapiro, J. (2003). Why have Americans become more obese? : National Bureau of Economic Research.
Danaei, G., Finucane, M.M., Lin, J.K., Singh, G.M., Paciorek, C.J., Cowan, M.J., et al. (2011a). National, regional, and global trends in systolic blood pressure since 1980: systematic analysis of health examination surveys and epidemiological studies with 786 country-years and 5· 4 million participants. The Lancet, 377, 568-577.
Danaei, G., Finucane, M.M., Lu, Y., Singh, G.M., Cowan, M.J., Paciorek, C.J., et al. (2011b). National, regional, and global trends in fasting plasma glucose and diabetes
prevalence since 1980: systematic analysis of health examination surveys and epidemiological studies with 370 country-years and 2· 7 million participants. The Lancet, 378, 31-40.
Danaei, G., Lawes, C.M., Vander Hoorn, S., Murray, C.J., & Ezzati, M. (2006). Global and regional mortality from ischaemic heart disease and stroke attributable to higher-than-optimum blood glucose concentration: comparative risk assessment. The Lancet, 368, 1651-1659.
Danaei, G., Singh, G.M., Paciorek, C.J., Lin, J.K., Cowan, M.J., Finucane, M.M., et al. (2013). The global cardiovascular risk transition: associations of four metabolic risk factors with macroeconomic variables in 1980 and 2008. Circulation,
CIRCULATIONAHA. 113.001470.
Dave, D., Doytch, N., & Kelly, I.R. (2016). Nutrient intake: A cross-national analysis of trends and economic correlates. Social science & medicine, 158, 158-167.
De Vogli, R., Kouvonen, A., Elovainio, M., & Marmot, M. (2014a). Economic globalization, inequality and body mass index: a cross-national analysis of 127 countries. Critical Public Health, 24, 7-21.
De Vogli, R., Kouvonen, A., & Gimeno, D. (2014b). The influence of market deregulation on fast food consumption and body mass index: a cross-national time series analysis. Bulletin of the World Health Organization, 92, 99-107A.
Delisle, H., Ntandou-Bouzitou, G., Agueh, V., Sodjinou, R., & Fayomi, B. (2012).
Urbanisation, nutrition transition and cardiometabolic risk: the Benin study. British Journal of Nutrition, 107, 1534-1544.
Doytch, N., Dave, D.M., & Kelly, I.R. (2016). Global Evidence on Obesity and Related Outcomes: An Overview of Prevalence, Trends, and Determinants. Eastern Economic Journal, 42, 7-28.
Egger, G., Swinburn, B., & Islam, F.A. (2012). Economic growth and obesity: An interesting relationship with world-wide implications. Economics & Human Biology, 10, 147-153.
Ezzati, M., Lopez, A.D., Rodgers, A., Vander Hoorn, S., & Murray, C.J. (2002). Selected major risk factors and global and regional burden of disease. The Lancet, 360, 1347-1360.
Finkelstein, E.A., Ruhm, C.J., & Kosa, K.M. (2005). Economic causes and consequences of obesity. Annu. Rev. Public Health, 26, 239-257.
Finucane, M., Stevens, G., Cowan, M., Danaei, G., Lin, J., Paciorek, C., et al. (2011). Global Burden of Metabolic Risk Factors of Chronic Diseases Collaborating Group (Body Mass Index) National, regional, and global trends in body-mass index since 1980: systematic analysis of health examination surveys and epidemiological studies with 960 country-years and 9.1 million participants. Lancet, 377, 557-567.
Glaeser, E.L. (2014). A world of cities: the causes and consequences of urbanization in poorer countries. Journal of the European Economic Association, 12, 1154-1199. Global Burden of Metabolic Risk Factors Project (2014).
Goryakin, Y., Lobstein, T., James, W.P.T., & Suhrcke, M. (2015a). The impact of economic, political and social globalization on overweight and obesity in the 56 low and middle income countries. Social science & medicine.
Goryakin, Y., Rocco, L., Suhrcke, M., Roberts, B., & McKee, M. (2015b). Fruit and vegetable consumption in the former Soviet Union: the role of individual-and community-level factors. Public health nutrition, 18, 2825-2835.
Goryakin, Y., & Suhrcke, M. (2014). Economic development, urbanization, technological change and overweight: What do we learn from 244 Demographic and Health Surveys? Economics & Human Biology, 14, 109-127.
Group, D.P.P.R. (2002). Reduction in the incidence of type 2 diabetes with lifestyle intervention or metformin. The New England journal of medicine, 346, 393. Hanefeld, J. (2015). Globalization and Health. Maidenhead, UK: Open University Press. Henderson, V. (2003). The urbanization process and economic growth: The so-what question.
Journal of Economic Growth, 8, 47-71.
Hinrichsen, D., & Robey, B. (2000). Population and the environment: The global challenge: Johns Hopkins University School of Public Health, Center for Communication Programs, Population Information Program.
Howell, W.H., McNamara, D.J., Tosca, M.A., Smith, B.T., & Gaines, J.A. (1997). Plasma lipid and lipoprotein responses to dietary fat and cholesterol: a meta-analysis. The American journal of clinical nutrition, 65, 1747-1764.
Ibrahim, M.M., & Damasceno, A. (2012). Hypertension in developing countries. The Lancet, 380, 611-619.
Johansson, L., Thelle, D.S., Solvoll, K., Bjørneboe, G.-E.A., & Drevon, C.A. (1999). Healthy dietary habits in relation to social determinants and lifestyle factors. British Journal of Nutrition, 81, 211-220.
Lewington, S., Clarke, R., & Qizilbash, N. (2002). Age-specific relevance of usual blood pressure to vascular mortality: a meta-analysis of individual data for one million adults in 61 prospective studies. Lancet, 360, 1903-1913.
meta-analysis of individual data from 61 prospective studies with 55,000 vascular deaths. Lancet, 370, 1829-1839.
Mensink, R.P., & Katan, M.B. (1990). Effect of dietary trans fatty acids on high-density and low-density lipoprotein cholesterol levels in healthy subjects. New England Journal of Medicine, 323, 439-445.
Miller, W.C., Koceja, D., & Hamilton, E. (1997). A meta-analysis of the past 25 years of weight loss research using diet, exercise or diet plus exercise intervention.
International journal of obesity, 21, 941-947.
Monda, K.L., Gordon-Larsen, P., Stevens, J., & Popkin, B.M. (2007). China's transition: the effect of rapid urbanization on adult occupational physical activity. Social science & medicine, 64, 858-870.
Monteiro, C.A., Conde, W.L., Lu, B., & Popkin, B.M. (2004). Obesity and inequities in health in the developing world. International journal of obesity, 28, 1181-1186. Neuman, M., Kawachi, I., Gortmaker, S., & Subramanian, S. (2013). Urban-rural differences
in BMI in low-and middle-income countries: the role of socioeconomic status. The American journal of clinical nutrition, ajcn. 045997.
Pan, X.-R., Li, G.-W., Hu, Y.-H., Wang, J.-X., Yang, W.-Y., An, Z.-X., et al. (1997). Effects of diet and exercise in preventing NIDDM in people with impaired glucose tolerance: the Da Qing IGT and Diabetes Study. Diabetes care, 20, 537-544.
Popkin, B.M. (1999). Urbanization, lifestyle changes and the nutrition transition. World Development, 27, 1905-1916.
Popkin, B.M. (2001). The nutrition transition and obesity in the developing world. The Journal of nutrition, 131, 871S-873S.
Popkin, B.M., Adair, L.S., & Ng, S.W. (2012). Global nutrition transition and the pandemic of obesity in developing countries. Nutrition reviews, 70, 3-21.
Popkin, B.M., & Gordon-Larsen, P. (2004). The nutrition transition: worldwide obesity dynamics and their determinants. International journal of obesity, 28, S2-S9.
Pritchett, L., & Summers, L.H. (1996). Wealthier is healthier. Journal of Human resources, 841-868.
Ramachandran, A., Mary, S., Yamuna, A., Murugesan, N., & Snehalatha, C. (2008). High prevalence of diabetes and cardiovascular risk factors associated with urbanization in India. Diabetes care, 31, 893-898.
Ramachandran, A., Snehalatha, C., Latha, E., Manoharan, M., & Vijay, V. (1999). Impacts of urbanisation on the lifestyle and on the prevalence of diabetes in native Asian Indian population. Diabetes research and clinical practice, 44, 207-213.
Sacks, F.M., & Katan, M. (2002). Randomized clinical trials on the effects of dietary fat and carbohydrate on plasma lipoproteins and cardiovascular disease. The American journal of medicine, 113, 13-24.
Schaefer, E.J., Gleason, J.A., & Dansinger, M.L. (2009). Dietary fructose and glucose differentially affect lipid and glucose homeostasis. The Journal of nutrition, 139, 1257S-1262S.
Snehalatha, C., & Ramachandran, A. (2009). Cardiovascular risk factors in the
normoglycaemic Asian-Indian population—influence of urbanisation. Diabetologia, 52, 596-599.
Suhrcke, M., Nugent, R.A., Stuckler, D., & Rocco, L. (2006). Chronic disease: an economic perspective. London: Oxford Health Alliance, 2006.
Swinburn, B.A., Sacks, G., Hall, K.D., McPherson, K., Finegood, D.T., Moodie, M.L., et al. (2011). The global obesity pandemic: shaped by global drivers and local
Vorster, H., Venter, C., Kruger, H., Kruger, A., Malan, N., Wissing, M., et al. (2000). The impact of urbanization on physical, physiological and mental health of Africans in the North West Province of South Africa: the THUSA study. South African Journal of Science, 96.
WHO (2014). Global status report on noncommunicable diseases 2014: World Health Organization.