variable environments
Tom C. Cameron1,2, Daniel O’Sullivan2, Alan Reynolds2, Joseph P. Hicks2, Stuart B. Piertney3 & Tim G. Benton2
1School of Biological Sciences, University of Essex, Colchester CO43SQ, UK 2School of Biological Sciences, University of Leeds, Leeds LS2 9JT, UK
3Institute of Biological and Environmental Sciences, University of Aberdeen, Aberdeen AB24 2TZ, UK
Keywords
Age-truncation, density dependence, environment, harvesting, microcosm, mortality, population dynamics, predation, seasonality, stage-structure, threshold, variability.
Correspondence
Tom C. Cameron, School of Biological Sciences, University of Essex, Colchester CO43SQ, UK.
Tel: +441206 872552; E-mail: [email protected]
Funding Information
Natural Environment Research Council (Grant/Award Number: ‘NE/C510467/1’)
Received: 7 March 2016; Accepted: 20 March 2016
Ecology and Evolution2016; 6(12): 4179– 4191
doi: 10.1002/ece3.2164
Abstract
The interaction between environmental variation and population dynamics is of major importance, particularly for managed and economically important species, and especially given contemporary changes in climate variability. Recent analyses of exploited animal populations contested whether exploitation or environmental variation has the greatest influence on the stability of population dynamics, with consequences for variation in yield and extinction risk. Theoretical studies how-ever have shown that harvesting can increase or decrease population variability depending on environmental variation, and requested controlled empirical stud-ies to test predictions. Here, we use an invertebrate model specstud-ies in experimental microcosms to explore the interaction between selective harvesting and environ-mental variation in food availability in affecting the variability of stage-structured animal populations over 20 generations. In a constant food environment, harvest-ing adults had negligible impact on population variability or population size, but in the variable food environments, harvesting adults increased population vari-ability and reduced its size. The impact of harvesting on population varivari-ability differed between proportional and threshold harvesting, between randomly and periodically varying environments, and at different points of the time series. Our study suggests that predicting the responses to selective harvesting is sensitive to the demographic structures and processes that emerge in environments with dif-ferent patterns of environmental variation.
Introduction
A central challenge in ecology is to understand popula-tion responses to harvesting in a changing or variable environment (Hsieh et al. 2006; Anderson et al. 2008; Stenseth and Rouyer 2008; Fryxell et al. 2010; Bunnefeld et al. 2011; Shelton and Mangel 2011a; Rouyer et al. 2012). Such insight is a necessary prerequisite for the effective management and conservation of natural resources under long-term environmental change. The developing consensus is that harvesting perturbs age- or stage-structure, largely by causing an age-truncation effect (ATE) through the removal of larger, older, or adult indi-viduals. This reduces competition for resources between survivors and should therefore lead to greater synchrony in key demographic rates, such as somatic growth,
development and maturation size. Relative to unharvested populations, the reduced competition in harvested popu-lations will create more even age- and size- distributions among juveniles, and these new distributions cause differ-ent population responses to environmdiffer-ental perturbations. For example, if food becomes abundant, the more even juvenile age-distribution can allow harvested populations to respond faster as there are more larger juveniles that can grow to adulthood faster and reproduce earlier rela-tive to unharvested populations. Through increasing the likelihood of over-compensatory responses, ATE can cre-ate an increase in population variability in variable envi-ronments (Anderson et al. 2008; Rouyer et al. 2010, 2012; Shelton and Mangel 2011a).
taken one of two approaches (Hsieh et al. 2006; Ottersen et al. 2006; Anderson et al. 2008; Stenseth and Rouyer 2008; Rouyer et al. 2010, 2012; Shelton and Mangel 2011a, 2011b; Sugihara et al. 2011). They either consider compa-rable data from fish species that vary in their harvesting pressures, or focus on detailed time series of well-studied fish stocks and look at their dynamics through periods of low and high adult fishing mortality or climate variation. The conclusions drawn from both approaches arise from statistical analyses to separate the effects of mortality and environmental noise on population variability. The major-ity of studies, despite their different approaches, come to similar conclusions about marine fisheries, namely that harvesting changes the ratio of large or old individuals to small or younger individuals and this leads to stronger non-linear population dynamic responses to environmental variation (Anderson et al. 2008; Shelton and Mangel 2011a; Rouyer et al. 2012). While contentions remain (Shelton and Mangel 2011b; Sugihara et al. 2011), there is increasing evidence to support the view that the driver of over- and under-compensatory responses of harvested populations to environmental variation is that harvesting changes the pop-ulation’s response to environmental changes through alter-ation in demographic structure and abundance (Cameron and Benton 2004; de Roos et al. 2007). These impacts can arise both directly, by mortality changing numbers, and indirectly, by mortality changing the competitive environ-ment leading to changes in the survivors’ intake rates, growth, maturity and fecundity. We would highlight the mechanistic similarity between harvesting and its impacts on fish population dynamics and studies considering the interaction between harvesting and environmental noise on population variance in terrestrial vertebrates (Bunnefeld et al. 2009, 2011; Chapman et al. 2009), and earlier studies with invertebrate model organisms in microcosm (e.g., Benton et al. 2002, 2004; Cameron and Benton 2004).
Despite the increasing evidence of the complexity of animal population dynamics in variable environments, much of its underpinning theory has typically been derived by exploring the consequences of adding stochas-ticity, representing environmental variation, directly to terms in otherwise unstructured deterministic models (e.g. Shelton and Mangel (2011a), and see discussion in Ranta et al. (2000)), or correlating animal abundance with temporal variation in abiotic variables such as tem-perature or the North Atlantic Oscillation (Grenfell et al. 1998). This has led to many different predictions where increasing environmental variation can be shown to either increase or decrease population variability in response to harvesting. A recent theoretical study flagged the need for experimental studies that would help determine under what types of environmental variation harvesting com-pounds or ameliorates population variability in structured
populations living in dynamic environments (Wikstrom et al. 2012).
Experimental manipulation of populations in microcosm is a powerful tool to provide very detailed data that can inform a mechanistic understanding of how populations respond to perturbations, variable environments, and har-vesting regime (Cameron and Benton 2004; Fryxell et al. 2005; Schroder et al. 2009; Nilsson et al. 2010; Strevens and Bonsall 2011). Specifically because field tests are rare and difficult (though possible see Ohlberger et al. (2011)), exper-imental microcosm approaches provide a way to explore the broad responses of live organisms to management-like inter-ventions and ultimately influence field practitioners (Benton et al. 2007). Experimental ecology & evolution, usually undertaken on invertebrates, often capture the complex population and community dynamics that are also seen in higher taxonomic order animals such as delayed feedback or generation cycles (Mittelbach and Persson 1998; Bjornstad et al. 1999; Wearing et al. 2004; Cameron et al. 2007), posi-tive density dependent responses to mortality (Benton et al. 2004; Butler et al. 2009; Schroder et al. 2009) and eco-evo-lutionary dynamics in response to environmental change and size-structured or trophy harvesting (Cameron et al. 2013, 2014; Smallegange and Deere 2014).
Here, we study the interaction between environmental variation and selective harvesting on population parame-ters in a well-studied model system, the soil mite
San-cassania berlesei. We conduct this study with weekly
Here, we focus specifically on addressing how variation in population abundance is influenced by the interaction between selective harvesting and environmental variation in food supply. For clarity we also report concurrent changes in mean population sizes across all treatments, some of which have been summarized previously (Cameron et al. 2013, 2014). We have a detailed under-standing of demographic mechanisms underpinning den-sity dependence in this system and using this we can investigate: (1) population dynamics data arising via fre-quent censuses (Benton et al. 2001b, 2004, 2006; Becker-man et al. 2002; Benton and BeckerBecker-man 2005; Benton 2012); (2) where we have manipulated the environmental variation (Benton et al. 2002; Benton and Beckerman 2005); (3) and where we have also imposed harvesting near the maximum sustainable yield, proportionally (density-independent) and at a threshold (density-dependent) (Ben-ton et al. 2004; Cameron and Ben(Ben-ton 2004). Specifically, we ask whether different harvest strategies create popula-tions that are more or less stable and whether harvested populations show greater responses to environmental vari-ation than nonharvested controls.
Methods
Experimental treatments and population census
Wild soil mites were collected from Chicken manure and compost from Aberdeenshire and horse manure and gar-den soil from West Yorkshire, and reared using standard techniques described elsewhere (Benton et al. 2001a).
Fifty to 100 mites from each location were reared for one generation (4–6 weeks) in excess food before being mixed together for a further generation. Forty-two uni-form small glass tubes (soda glass, 25 mmØ, 50 mm tall, filter paper seal and press on lid) half-filled with experi-mental grade calcium sulfate were each inoculated with 150 males, 150 females, and 1000 juveniles of unknown sex at the start of the experiment (day 1 of week 1). Our main results presented here are from near the end of the experiment beyond any possible ecological transients.
Tubes were assigned to constant (12 replicates), randomly variable (18 replicates), or a 28 day periodically variable (12 replicates) food provision treatment. All treatments received the same average daily food input of 290.0015 g balls of dried active yeast, over the course of the experiment. In the constant treatment, every tube received two balls/day. In the random treatment, every tube received between zero to 13 balls/day, but with a distribution based on a negative bino-mial, with mean of 2 and dispersion parameter of 0.5 over a 56 day period. The periodic treatment mimicked a seasonal environment with food provided in the following repeating
pattern: 9 days of no food, 3 days one ball yeast, 2 days three, 9 days four, 3 days three, and the final 2 days in the cycle one ball. Over these 4 week periods, the variance in total food delivery per week, expressed as a coefficient of variation (CV) averaged zero, 0.36 and 0.86 for constant, random, and periodic food respectively. Each tube received at least two drops of distilled water/day to maintain humid-ity. Replicate tubes from each environmental variation treat-ment were randomly assigned to different experitreat-mental harvesting treatments; unharvested or proportional har-vested (where 40% of adults were removed from the popu-lation per week) or threshold harvested (where all adult individuals above 60% of the long-term predicted adult population size were removed=above 173 adults; n =6 replicate tubes per harvesting treatment). The threshold harvest treatment therefore experiences weeks where densi-ties are too low and harvesting does not occur, and over the later part of the time series that we examine in greater detail this resulted in an average weekly harvest rate of adults of 30.1 5.1%. The threshold harvested treatment was only conducted in the randomly variable environment treatment. Pilot experiments and simulations of an individual based model described in (Benton 2012), provided predictions that adult harvest rates much above 40%/week would not be sustainable in the long-term.
Population tubes were counted in the morning on the same day each week under a Nikon SMZ1500 stereomi-croscope with attached cool LED ring light (Nikon UK Limited, Kingston Upon Thames, UK). When harvesting was required the required number of individuals was removed using a fine brush. Harvesting began on week 13 and ended in week 83. The mite generation time is approximately 30–37 days under relatively constant con-ditions (Ozgul et al. 2012). To measure the size distribu-tion of juveniles (all stages combined) and adults, photographs of the entire area of each replicate tube were taken using a Nikon Digital Sight 5.0 megapixel camera (DS-5M) attached to a Nikon SMZ1500 stereomicroscope at 91.5. These photographs were captured during week 60 near the end of the time series when the populations had been exposed to environmental variation and harvest-ing for 47 weeks. Longest length measurements of all individual mites that were not obscured in the image were recorded using Nikon software (Elements-D).
Analysis
(using function “rollapply” in package “zoo” in R3.0.2).The CV for a week i in the times series is calcu-lated from the adult abundance over weeks i 2 to i+2 which is approximately equal to the generation time (Ozgul et al. 2012).
To describe and visually compare between trends in the CV of adult population sizes per environ-ment9 harvest treatment, we fitted general additive models (GAMS) across the CV of population size of each replicate population tube as a function time (weeks), and constrained the intercepts to be the average CV of population size at the beginning of the experi-ment. The best GAMs were chosen by selecting the model(s) with the lowest AIC score between those with df of 1–10, 15, 20. The best model is then used to plot the smoothed mean CV and confidence interval over the course of the experiment to visually compare differences between treatments on population variability. Additional analyses over 10- or 20-weeks centered moving windows of CV of adult population size can be found in the Sup-porting online information, but remain qualitatively sim-ilar. Plots of trends in mean population sizes in response to environment and harvesting have been presented in Cameron et al. (2013, 2014), but can also be found in the Supporting information.
For a detailed assessment of the relative impacts of the harvesting and environment treatments on population variation (CV) and mean abundance, we chose a 20-week time series (weeks 60–80, 3–4 generations) toward the end of the experiment such that the response was assessed after approximately 12 generations of exposure to envi-ronmental variation and harvesting, and assume this win-dow is (1) small enough for the time series to be approximately stationary, (2) following the erosion of ini-tial ecological transients and thus with approximately stable age/size distributions, and (3) following the most intense period of natural selection, and thus evolutionary change (Cameron et al. 2013). We will refer to the GAM predicted plots of trends that describe where any variation in the length or period of this 20-week time series may have influenced our conclusions from selecting weeks 60– 80. The population and stage means and CVs of abun-dance for each treatment combination were calculated using stratified bootstrap resampling of the time series data across all six replicates to give robust estimates that account for repeated measures (Benton et al. 2002; Cameron and Benton 2004). To compare the CVs across different treatments that differed in their rate of change in mean population size, the time series were first detrended by subtracting a locally weighted polynomial regression model of the mean trend (i.e., lowess). The bootstrap mean and 95% confidence intervals of popula-tion CV or mean abundance are presented in figures and
percentage differences between these mean treatment val-ues and the controls are provided in the text. Statistical significance was estimated with linear models, chosen based on a prior analysis (e.g., Benton et al. 2002), to consider the effects of type of environmental variance (factor: constant, randomly variable, or periodic) on the population statistics within each harvest treatment. Statis-tical significance of the effects of harvesting, within each life history stage and environmental variation treatment, were derived from the bootstrapped 95% confidence intervals as also presented in Figures 1 and 2, that is a 29 standard error distribution/t-test. Where differences were not significant they are referred to as “ns” in the main text. A summary of the effect sizes of environmental variance and harvesting, as provided throughout the results text, can be found in Tables S1 and S2.
To test for differences in the size structure of populations from different environments or harvest treatments the mean and confidence interval of the size probability density function was calculated for both the constant and periodic environment populations using the R 3.0.2, package “stats”, function “density” (n= 8192 measurements).
Supporting information includes details of some statis-tical analyses reported below in Tables S1 and S2.
Results
Effects of environmental variation and harvesting on population variability
Environmental variation has a large and statistically signifi-cant effect on the CV of total population and stage-specific dynamics during weeks 60–80 (Fig. 1, Table 1). Periodic environmental variation increases total population and stage variation more than random environmental variation, for example the CV of adult number from unharvested popula-tions are 0.2, 0.34, and 0.46 in constant, random, and peri-odic environments respectively (ANOVA Unharvested Adults~Environmental Variation,F1,15,=32.77,P<0.001).
Effects of environmental variation and harvesting on population size
During weeks 60–80, in the unharvested populations, the total population size is reduced in random environments
relative to the constant environment (Fig. 2, Average
ran-dom 22.2% less, t1,11= 2.9, P<0.02; Averageperiodic 24.4% less, t1,11= 2.7, P<0.02, Table 2). This reduction in total population size is primarily due to the reduction in numbers of the numerically dominant eggs and juveniles,
0.2
0
.4
0.6
0
.8
1.0
1
.2
Eggs
Constant Random Periodic
V
a
riation in stage (CV)
Unharvested Proportional Adult Threshold Adult
0.2
0
.3
0.4
0
.5
0.6
0
.7
0.8
Juveniles
Constant Random Periodic
V
a
riation in stage (CV)
0.1
0
.2
0.3
0
.4
0.5
0
.6
0.7
Adults
Constant Random Periodic
V
a
riation in stage (CV)
0.1
0
.2
0.3
0
.4
0.5
0
.6
0.7
Total
Constant Random Periodic
V
a
[image:5.595.212.531.68.630.2]riation in stage (CV)
Figure 1. Bootstrap resampled and stratified coefficient of variation of population size (mean and 95% confidence intervals) for weeks 60–80 (detrended) for each stage in the three environmental variation and associated stage-selective harvest treatments. Environmental variation increases from zero (coefficient of variation), to 0.36 to 0.86 for constant, randomly variable and periodic in weekly food treatments. Symbols refer to different harvesting treatments. Error bars are bias corrected and adjusted 95% confidence intervals of the mean and those that do not overlap the mean of a comparable treatment can be considered statistically different at a=0.05. Scales differ between panels.
500
6
00
700
8
00
900
Eggs
Constant Random Periodic
Mean
800
1
000
1
200
1
400
1
600
1
800
Juveniles
Constant Random Periodic
Mean
Unharvested Proportional Adult Threshold Adult
200
2
50
300
3
50
400
Adults
Constant Random Periodic
Mean
1000
1200
1400
1600
1800
2000
Total
Constant Random Periodic
Mean
whereas adult population sizes are larger in random envi-ronments relative to the constant control (Fig. 2, adult numbers Averagerandom17.2% more,t1,11=2.2, P<0.05; Averageperiodic7.26% more,t1,11=0.9, ns).
The effects of harvesting on population and stage den-sities are dependent on the environment (Fig. 2). Har-vesting adults reduces the total population size in a constant environment, due to a larger and statistically sig-nificant reduction of eggs and juveniles than adults (Adult harvest eggs 13.6% less, juveniles 20.1 less, adults 2.6% less ns). Harvesting adults in a randomly variable envi-ronment has no effect on eggs ( 3.4% ns), but significant reduction in juveniles and adult numbers (juveniles 10.1% less, adults 14% less). This results in a significant reduction in total population size (12.3% less). Harvesting adults in a periodic environment has no effect on egg or juvenile numbers relative to controls, but significantly reduces adult abundance (Adults 19.3% less). This does not result in a statistically significant net reduction in total population size.
How does variability in population size change across the time series?
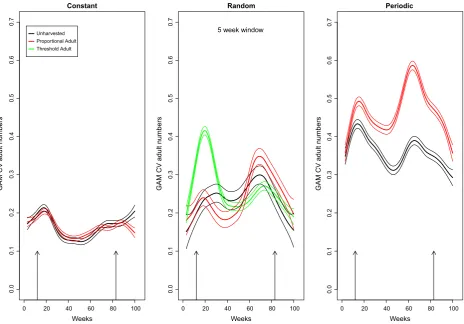
The CV of adult population size changes over time in the constant environment, regardless of harvest treatment,
such that throughout most of the experiment there were no significant differences in adult number CV between control and adult harvested populations (Fig. 3). Simi-larly, the CV in adult numbers varied through time in random environments. Changes in the estimated variation in all environments near the end of these time series, beyond week 80, are influenced by the end points and the short nature of the postharvest time series. The key point however is whether there are changes in the relative dif-ferences in the responses of populations to harvesting across the time series and in particular, do they ever differ from the week 60–80 period when we looked at the changes in population summary statistics in detail.
[image:6.595.66.538.93.203.2]Proportional harvesting of adults in randomly variable environments initially reduced the CV of adult numbers relative to the control, but this is reversed nearer the end of the experiment (Figs. 1, 3). The onset of harvesting leads to a large ecological transient of reduced variation of adult numbers during the initial decline in population size. Harvesting adults later in the time series as the pop-ulation recovers – which we now know to be driven by evolution of the life history– results in variation in adult numbers increasing to larger than that in unharvested populations. A similar initial and large transient increas-ing CV in adult numbers in response to adult harvestincreas-ing was seen under threshold harvests in randomly variable Table 1. Coefficient of variation of population size as a function of environmental variation (var: 0=constant, 1=random, 2=periodic) for each stage and the total population.
Stage Unharvested Adult harvested
Eggs CV= 1.45 (0.09)+0.63 (0.07) var CV= 1.52 (0.06)+0.67 (0.05) var
R2=0.83,F
1,16=75.94,P=1.798e 7 R2=0.91,F1,16=165.0,P=7.61e 10
Juveniles CV= 1.48 (0.09)+0.26 (0.07) var CV= 1.47 (0.11)+0.26 (0.08) var
R2=0.49,F
1,16=15.43,P=0.0012 R2=0.38,F1,16=9.738,P=0.006
Adults CV= 1.90 (0.09)+0.41 (0.07) var CV= 1.90 (0.06)+0.49 (0.05) var
R2=0.65,F
1,16 = 30.88,P=4.33e 5 R2=0.88,F1,16=113.4,P=1.14e 8
Total CV= 1.67 (0.09)+0.27 (0.07) var CV= 1.68 (0.12)+0.31 (0.09) var
R2=0.49,F
1,16=15.53,P=0.00117 R2=0.40,F1,16=10.51,P=0.005
Table 2. Ln population size as a function of environmental variation (var: 0=constant, 1=random, 2=periodic) for each stage and the total population.
Stage Unharvested Adult harvested
Eggs ln(Pop)=6.326 (0.045) 0.129 (0.035) var ln(Pop)=6.279 (0.036) 0.126 (0.028) var
R2=0.46,F
1,16 = 13.72,P=0.0019 R2=0.56,F1,16=20.62,P=0.00033
Juveniles ln(Pop)=7.043 (0.072) 0.302 (0.056) var ln(Pop)=6.886 (0.038) 0.208 (0.030) var
R2=0.65,F
1,16=29.18,P=5.88e 5 R2=0.75,F1,16=48.63,P=3.14e 6
Adults ln(Pop)=5.577 (0.035) 0.031 (0.027) var ln(Pop)=5.607 (0.048) 0.050 (0.037) var
R2=0.07,F1,16=1.29,P=0.27 NS R2=0.10,F1,16=1.833,P=0.194 NS
Total ln(Pop)=7.256 (0.051) 0.224 (0.039) var ln(Pop)=7.136 (0.031) 0.172 (0.024) var
R2=0.67,F
1,16=31.82,P=3.68e 5 R2=0.76,F1,16=50.57,P=2.47e 6
[image:6.595.65.539.248.357.2]environments. This CV of adult numbers with a threshold harvest increases later in the time series, but always remains lower than in proportional harvesting (Fig. 3). Proportional harvesting of adults in periodic environ-ments increased variation in adult population abundance relative to the control throughout the entire experiment (Fig. 3).
Impact of different harvesting strategies on dynamics
We compared proportional harvest of 40% of adults/week and threshold harvesting of all adults above 60% of the predicted long-term mean of an unexploited population (i.e., carrying capacity) under random environmental variation in weeks 60–80. Variation in adult population size and the mean population size are reduced more by threshold harvesting relative to both the unharvested con-trol and proportional harvesting of adults (CV of adult
population size: threshold harvest 22.9% less, propor-tional harvest 1.8% less than control ns, Fig. 1; average adult population size: threshold harvest 23.1% less, pro-portional harvest 14% less than control, Fig. 2). Convert-ing this into estimated yields indicates that the different harvesting strategies significantly affect both the expected yield (t1,11=4.94,P<0.01) and its variability: for thresh-old harvesting, the yield2 SE is estimated as 6469771 adults, with a variation in yield over time, estimated by the CV, being 0.980.12. Conversely, for proportional harvesting, the yield is estimated as 8366559 adults with a much lower CV at 0.32 0.01.
Impact of harvesting on the distribution of body sizes
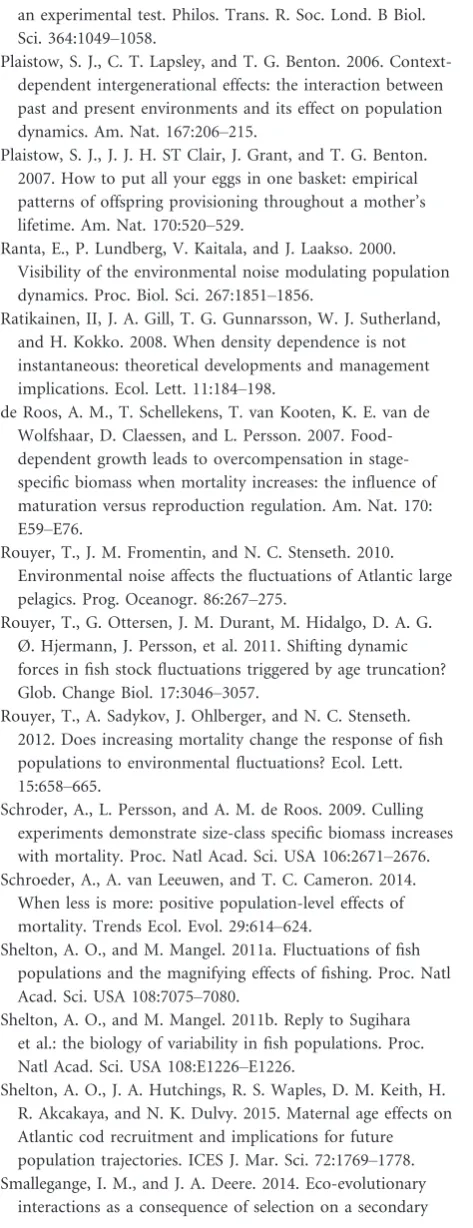
The size distributions of adult females from constant or periodic environments in weeks 60–80 are similar. Under constant food, selective harvesting of adults truncates the
0 20 40 60 80 100
0.0
0
.1
0.2
0
.3
0.4
0
.5
0.6
0.7
Constant
Weeks
GAM CV adult numbers
Unharvested Proportional Adult Threshold Adult
0 20 40 60 80 100
0.0
0
.1
0.2
0
.3
0.4
0
.5
0.6
0
.7
Random
Weeks
GAM CV adult numbers
5 week window
0 20 40 60 80 100
0.0
0.1
0
.2
0.3
0
.4
0.5
0
.6
0.7
Periodic
Weeks
GAM CV adult n
u
[image:7.595.61.526.69.393.2]mbers
adult female and juvenile size distribution (Fig. 4). But the overall effect is small (constant environment: unhar-vested population female body length 625 lm3.25 SE vs. adult harvested female 586 4.4 SE=7% reduction). In periodic environments harvesting has almost no effect on the adult size distribution over this period. Adult har-vesting however, significantly shifts the distribution of juvenile sizes in periodic environments (Fig. 4; periodic environment: unharvested population juvenile body length 285lm1.71 SE, adult harvested 273 lm1.81 SE).
Discussion
Harvesting adults increased stage-specific and total popu-lation variability in variable environments, but not in constant environments. Where mite populations were exposed to environmental variation for many generations it is clear that harvesting of adults leads to increasing variability of adult numbers. The magnitude of this effect increased over time, in both randomly and periodically variable environments, and could be a result of the previ-ously identified life history evolution occurring over the course of the experiment (Cameron et al. 2013, 2014). Whether this is caused by evolution of more plastic
phenotypes, greater genotype diversity in variable envi-ronments (e.g., disruptive selection) or both remains to be tested. We found no significant effect of harvesting on the relative population variability (CV) when the environ-ment is constant.
The most parsimonious explanation why adult harvest-ing mortality increases adult population variance only in the presence of environmental variance is that age/size truncated populations are more likely to respond in an over compensatory way to mismatches between their age/stage/ size structure and the immediate carrying capacity of the environment (Cameron and Benton 2004; Rouyer et al. 2012), due to an over representation of younger, more fecund, adults. Similarly age truncated populations are most likely to suffer highest mortality from short-term neg-ative environmental changes due to the investment in adult survival strategies in most high fecundity species (e.g., age/ size truncated populations have relatively more vulnerable young/small individuals). Therefore, our results empirically support a variety of similar conclusions in other studies examining the cause of increased variability of wild popula-tions–that both the effects of harvest on demography and environmental variation have a role (Hsieh et al. 2006; Anderson et al. 2008; Rouyer et al. 2010, 2011, 2012; Shel-ton and Mangel 2011a, 2011b; Sugihara et al. 2011).
5.5 6.0 6.5 7.0
0
Constant
Probability density
4.0 4.5 5.0 5.5 6.0 6.5 7.0
01234
ln(length) in um
Probability density
5.5 6.0 6.5 7.0
0
123456 123456
Periodic
4.0 4.5 5.0 5.5 6.0 6.5 7.0
01234
[image:8.595.67.540.70.388.2]ln(length) in um
We also found that harvesting adults does not always have the same effect on the variance of different ontoge-netic stages. For example, in the periodic food environ-ments harvesting adults leads to increased variance in adult and reduced variance in juvenile numbers, because removing adults during the periods when there is no food available reduces adult numbers with limited compen-satory juvenile growth or maturation. In contrast, remov-ing adults when food is available results in increased adult numbers via over-compensatory adult recruitment without reduction in juvenile numbers (as juvenile recruitment and survival are high). A plot of long-term average of adult and juvenile densities per replicate popu-lation tube misses this pattern (Figure S2). Likewise har-vesting adults in a constant environment reduces the overall variance across all stages by decreasing variance in egg and juvenile but not adult numbers – because total population CV remained constant while total population size declined.
What are the relative roles of harvest-induced age or size-truncation and environmental variation on population variability?
In our experiment, adult survival rates declined with age by approximately 6%/day under adult harvesting (i.e., cal-culated as the average change in daily survival over 7 days from emergence to the first harvest event, if harvesting was continuous). While no age-specific data are available, the size frequency distributions of adult females from adult harvested constant environment populations are left skewed, caused by a decrease in the number of individu-als over 650lm and increase in those under 550lm in adult harvested populations. In periodic populations, we see a smaller average size across the whole population. Overall, we have larger numbers of smaller adult females and juveniles; we would strongly argue that the average age has also reduced. However, this age truncation alone did not lead to increased population variation when ronmental variation was minimized in our constant envi-ronment treatment.
Only when environmental variation and harvesting were combined did we see strong evidence of magnified fluctuations in abundance as in studies of commercial fisheries or harvested game birds (Anderson et al. 2008; Chapman et al. 2009; Rouyer et al. 2010, 2011, 2012; Bunnefeld et al. 2011; Shelton and Mangel 2011a). Thus, age-truncation (or size-truncation) from stage and/or size-selective mortality interacts with environmental varia-tion to increase populavaria-tion variability. This supports our earlier point that mismatches between population struc-tures and the environmental state at any one time, leads
to harvesting magnifying population variability– age/size-truncation effects on their own are not enough. A second consideration of ATE is the effect that reducing females’ average age has on egg production and survival (Plaistow et al. 2007; Cameron et al. 2014). We find that harvesting adults can often reduce total population size through its influence on eggs and juveniles, as observed in constant and randomly variable environments. Female age is an important determinant of fecundity in soil mites (Plais-tow et al. 2007), as in many species including fishes (Har-ris et al. 2007; Kaeding and Koel 2011; Targonska et al. 2012; Aliniya et al. 2013; Valentin et al. 2015), and changes in average female age can have lasting effects on juvenile survival, population variability, and size (O’Far-rell and Botsford 2006; Plaistow and Benton 2009; Hsieh et al. 2010; Hixon et al. 2014; Shelton et al. 2015).
Empirical testing of current theory on harvesting and environmental variation
A series of analytical studies that support the hypothe-sis that harvesting causes population variability in the wild, used a census of very young larval fish stages as their index of population abundance (CalCOFI Ichthy-oplankton database) (Hsieh et al. 2006; Anderson et al. 2008). A case is then made that the biomass of larval fish is a “well known proxy for current (spawning) adult bio-mass” (Anderson et al. 2008; CEFAS, 2012). In our data we found no statistically significant evidence that harvest-ing adult mites in variable environments increases egg or juvenile stage variation. Neonate mortality is high in the mite model system as it is in marine fishes, up to 90%, and therefore egg counts are a best indicator of the abun-dance of the first mite juvenile stage (Benton et al. 2002; Cameron and Benton 2004; Ozgul et al. 2012). Where harvesting adults in a constant environment led to increased juvenile stage variability, this did not lead to significant increases in adult stage variance. Therefore, we would urge caution in the interpretation of studies on only egg or juvenile stage abundances in harvested popu-lations for two reasons. Firstly compensatory changes in survival, growth, recruitment, or species interactions in later stages are likely to mask or modify the abundance and variability of any later stages, whether in model, microcosm, or wild populations (Bystrom et al. 1998; Persson et al. 2000; Ratikainen et al. 2008; Wikstrom et al. 2012). Secondly, despite its wide use due to no other fisheries independent information being available, a number of biases have been identified and cautions issued on the links between ichthyoplankton survey data and adult biomass in a variety of harvested species (Bernal et al. 2012; Kraus et al. 2012).
Effects of harvesting and environmental variation on population size
We have shown previously that both increased environ-mental variation and harvesting can, separately, reduce population size (Benton et al. 2002; Cameron and Benton 2004; Cameron et al. 2013, 2014). Here, we extend these studies to show that the effects of harvesting on stage and total population size declined with increasing environmen-tal variance, and that the stage-specific effects of harvesting adults differ markedly between constant and variable envi-ronments. In a constant environment harvesting adults sig-nificantly reduces egg and juveniles stages but not adults. The alternate is true in variable environments. We suggest that environmental variance obscures or dampens harvest effects on total population size as, when food and popula-tion sizes are low; the smaller yield under a proporpopula-tional adult harvest is easily compensated for via increased repro-duction or juvenile survival before the next census or har-vest. When food is plentiful any harvest rate is easily
compensated for through increased juvenile growth, sur-vival, and maturation due to the mismatch between the reduced postharvest density and the increased resources. However, under constant conditions resource competition is invariably high (Cameron and Benton 2004). Therefore, while competitively dominant larger juveniles can obtain the extra food following a harvest and quickly mature, smaller juveniles and females are not best placed to respond to increasing food availability and increase growth, matura-tion, and fecundity rates.
Examining the effects of different harvesting regimes
Density-dependent adult mortality from threshold har-vesting, also referred to as fixed escapement (Fryxell et al. 2005), is thought to be a more precautionary harvest method as the harvest effort is proportional to the long-term average of the sustainable yield. In this way it is thought to reduce the risk of extinction by reducing vari-ability and preventing low population sizes through reducing harvest when population size is reduced (Lande et al. 1997; Fryxell et al. 2005). In our study, a threshold method restricted to harvest all adults above 60% of the long-term population mean reduced long-term averaged harvest effort, through the absence of harvesting in multi-ple weeks, resulting in an average harvest of close to 30%; 10% lower than the proportional harvest target rate of 40%. However, threshold harvesting of adults in ran-domly variable environments reduced adult densities by approximately 23%, compared to a 15% reduction by density independent proportional harvesting of adults. The increased reduction of adult population size via threshold management could occur via harvesting rate being too high, overharvesting, or too low to promote positive density-dependent feedback from the mortality rate on adult recruitment (Schroeder et al. 2014).
variation in adult abundance over the latter of the harvest period. Earlier in the experiment there was a large ecolog-ical transient where variation in adult numbers was very high in the threshold adult harvest treatment. This is likely linked to the same very high harvest rates above 50% due to initial high population densities at the onset of harvesting. That our study includes environmental variation, and/or a model organism with complex life his-tory more like that of many harvested species, might explain the difference in results from a previous experi-ment that suggested threshold harvesting methods are more conservative (Fryxell et al. 2005). The objective to reduce temporal variability in ecosystem service provision, as is a primary objective of threshold harvest manage-ment, has been called into question recently (Carpenter et al. 2015). Management to reduce short-term variability in a fisheries model has unintended consequences that include greater extinction risks due to the interactions between environmental variance and management. Clearly from our own results, and taking this recent analysis into consideration, threshold harvest methods cannot be rec-ommended as a more conservative harvesting strategy without further study.
Conclusion
We have presented a microcosm study of invertebrates and provided experimental evidence to answer our two main questions; harvest induced age/stage/size-truncation results in less stable populations and this is associated with significantly increased population variance only in variable environments. The likely mechanism behind this result is switching between additive and over compen-satory changes in maturation, reproduction and survival during food limited and unlimited periods respectively (Cameron and Benton 2004). Such over-compensatory mechanisms are known to cause populations to overshoot their carrying capacity at any point in time. Our study is conducted in a simplified environment where autocorre-lated and random variance were considered separately. In nature, variation can occur over many time scales, with some components for example being high frequency (blue noise), random (white noise), and low frequency (red noise) occurring simultaneously. This study shows that the type of variation can make a very big difference to predictions of population responses to mortality, and this can be experimentally explored in model systems.
Acknowledgments
This work was funded by NERC grant NE/C510467/1 (T. G. Benton and S. B. Piertney) and a University of Leeds Faculty Postdoctoral Fellowship (T. C. Cameron).
Data Accessibility
The original time series and body size data from these experiments are available to download from DRYAD entry number http://dx.doi.org/10.5061/dryad.bq135.
Conflict of Interest
None declared.
References
Aliniya, M., H. Khara, S. B. Noveiri, and H. Dadras. 2013.
Influence of age of common carp (Cyprinus carpio)
broodstock on reproductive traits and fertilization. Turk. J.
Fish. Aquat. Sci. 13:19–25.
Anderson, C. N. K., C. H. Hsieh, S. A. Sandin, R. Hewitt, A. Hollowed, J. Beddington, et al. 2008. Why fishing magnifies
fluctuations in fish abundance. Nature 452:835–839.
Beckerman, A. P., T. G. Benton, E. Ranta, V. Kaitala, and P. Lundberg. 2002. Population dynamic consequences of
delayed life-history effects. Trends Ecol. Evol. 17:263–269.
Benton, T. G. 2012. Individual variation and population dynamics: lessons from a simple system. Philos. Trans. R.
Soc. Lond. B Biol. Sci. 367:200–210.
Benton, T. G., and A. P. Beckerman. 2005. Population dynamics in a noisy world: lessons from a mite
experimental system. Adv. Ecol. Res. 37:143–181, Population
Dynamics and Laboratory Ecology.
Benton, T. G., C. T. Lapsley, and A. P. Beckerman. 2001a. Population synchrony and environmental variation: an
experimental demonstration. Ecol. Lett. 4:236–243.
Benton, T. G., E. Ranta, V. Kaitala, and A. P. Beckerman. 2001b. Maternal effects and the stability of population
dynamics in noisy environments. J. Anim. Ecol. 70:590–599.
Benton, T. G., C. T. Lapsley, and A. P. Beckerman. 2002. The population response to environmental noise: population size, variance and correlation in an experimental system. J.
Anim. Ecol. 71:320–332.
Benton, T. G., T. C. Cameron, and A. Grant. 2004. Population responses to perturbations: predictions and responses from
laboratory mite populations. J. Anim. Ecol. 73:983–995.
Benton, T. G., S. J. Plaistow, A. P. Beckerman, C. T. Lapsley, and S. Littlejohns. 2005. Changes in maternal investment in eggs can affect population dynamics. Proc. Biol. Sci.
272:1351–1356.
Benton, T. G., S. J. Plaistow, and T. N. Coulson. 2006. Complex population dynamics and complex causation: devils, details
and demography. Proc. Biol. Sci. 273:1173–1181.
Benton, T. G., M. Solan, J. M. J. Travis, and S. M. Sait. 2007. Microcosm experiments can inform global ecological
problems. Trends Ecol. Evol. 22:516–521.
production methods in marine fisheries: an introduction. Fish. Res. 117–118:1–5.
Bjornstad, O. N., J. M. Fromentin, N. C. Stenseth, and J. Gjosaeter. 1999. Cycles and trends in cod populations. Proc.
Natl Acad. Sci. USA 96:5066–5071.
Bunnefeld, N., D. Baines, D. Newborn, and E. J. Milner-Gulland. 2009. Factors affecting unintentional harvesting selectivity in a
monomorphic species. J. Anim. Ecol. 78:485–492.
Bunnefeld, N., D. C. Reuman, D. Baines, and E. J. Milner-Gulland. 2011. Impact of unintentional selective harvesting on the population dynamics of red grouse. J. Anim. Ecol.
80:1258–1268.
Butler, S. J., T. G. Benton, M. A. C. Nicoll, C. G. Jones, and K. Norris. 2009. Indirect population dynamic benefits of altered life-history trade-offs in response to egg harvesting.
Am. Nat. 174:111–121.
Bystrom, P., L. Persson, and E. Wahlstrom. 1998. Competing predators and prey: juvenile bottlenecks in whole-lake
experiments. Ecology 79:2153–2167.
Cameron, T. C., and T. G. Benton. 2004. Stage-structured harvesting and its effects: an empirical investigation using
soil mites. J. Anim. Ecol. 73:996–1006.
Cameron, T. C., H. J. Wearing, P. Rohani, and S. M. Sait. 2007. Two-species asymmetric competition: effects of age structure on intra- and interspecific interactions. J. Anim.
Ecol. 76:83–93.
Cameron, T. C., D. O’Sullivan, A. Reynolds, S. B. Piertney, and T. G. Benton. 2013. Eco-evolutionary dynamics in
response to selection on life-history. Ecol. Lett. 16:754–763.
Cameron, T. C., S. J. Plaistow, M. Mugabo, S. B. Piertney, T. G. Benton 2014. Eco-evolutionary dynamics: experiments in
a model system. Adv. Ecol. Res. 50:171–206.
Carpenter, S. R., W. A. Brock, C. Folke, E. H. van Nes, and M. Scheffer. 2015. Allowing variance may enlarge the safe operating space for exploited ecosystems. Proc. Natl Acad.
Sci. USA. 112: 14384–14389.
CEFAS. 2012. Available at http://www.cefas.defra.gov.uk/our- science/fisheries-information/surveys/estimating-spawning-stock-biomass-using-egg-surveys.aspx [Online]. CEFAS (accessed 5 March 2013).
Chapman, D. S., S. J. Cornell, and W. E. Kunin. 2009. Interactions between harvesting, noise and territoriality in a model of red grouse population cycles. J. Anim. Ecol.
78:476–484.
Fryxell, J. M., I. M. Smith, and D. H. Lynn. 2005. Evaluation of alternate harvesting strategies using experimental
microcosms. Oikos 111:143–149.
Fryxell, J. M., C. Packer, K. McCann, E. J. Solberg, and B. E. Saether. 2010. Resource management cycles and the sustainability of harvested wildlife populations. Science
328:903–906.
Grenfell, B. T., K. Wilson, B. F. Finkenstadt, T. N. Coulson, S. Murray, S. D. Albon, et al. 1998. Noise and determinism in
synchronized sheep dynamics. Nature 394:674–677.
Harris, P. J., D. M. Wyanski, D. B. White, P. P. Mikell, and P. B. Eyo. 2007. Age, growth, and reproduction of greater amberjack off the southeastern US Atlantic coast. Trans.
Am. Fish. Soc. 136:1534–1545.
Hixon, M. A., D. W. Johnson, and S. M. Sogard. 2014. BOFFFFs: on the importance of conserving old-growth age
structure in fishery populations. ICES J. Mar. Sci. 71:2171–
2185.
Hsieh, C. H., C. S. Reiss, J. R. Hunter, J. R. Beddington, R. M. May, and G. Sugihara. 2006. Fishing elevates variability in
the abundance of exploited species. Nature 443:859–862.
Hsieh, C.-H., A. Yamauchi, T. Nakazawa, and W.-F. Wang. 2010. Fishing effects on age and spatial structures
undermine population stability of fishes. Aquat. Sci. 72:165–
178.
Kaeding, L. R., and T. M. Koel. 2011. Age, growth, maturity, and fecundity of Yellowstone lake cutthroat trout.
Northwest Sci. 85:431–444.
Kraus, G., H.-H. Hinrichsen, R. Voss, E. Teschner, J.
Tomkiewicz, and F. W. K€oster. 2012. Robustness of egg
production methods as a fishery independent alternative to
assess the Eastern Baltic cod stock (Gadus morhua callarias
L.). Fish. Res. 117–118:75–85.
Lande, R., B.-E. Sæther, and S. Engen. 1997. Threshold harvesting for sustainability of fluctuating resources. Ecology
78:1341–1350.
Mittelbach, G. G., and L. Persson. 1998. The ontogeny of piscivory and its ecological consequences. Can. J. Fish
Aquat. Sci. 55:1454–1465.
Nilsson, K. A., L. Persson, and T. van Kooten. 2010. Complete
compensation inDaphnia fecundityand stage-specific
biomass in response to size-independent mortality. J. Anim.
Ecol. 79:871–878.
O’Farrell, M. R., and L. W. Botsford. 2006. The fisheries management implications of maternal-age-dependent larval
survival. Can. J. Fish Aquat. Sci. 63:2249–2258.
Ohlberger, J., O. Langangen, E. Edeline, D. Claessen, I. J. Winfield, N. C. Stenseth, et al. 2011. Stage-specific biomass overcompensation by juveniles in response to increased
adult mortality in a wild fish population. Ecology 92:2175–
2182.
Ottersen, G., D. A. G. Ø. Hjermann, and N. C. Stenseth. 2006. Changes in spawning stock structure strengthen the link between climate and recruitment in a heavily fished cod (Gadus morhua) stock. Fish Oceanogr. 15:230–243. Ozgul, A., T. Coulson, A. Reynolds, T. C. Cameron, and T. G.
Benton. 2012. Population responses to perturbations: the importance of trait-based analysis illustrated through a
microcosm experiment. Am. Nat. 179:582–594.
Persson, L., P. Bystrom, and E. Wahlstrom. 2000. Cannibalism and competition in Eurasian perch: population dynamics of
an ontogenetic omnivore. Ecology 81:1058–1071.
an experimental test. Philos. Trans. R. Soc. Lond. B Biol.
Sci. 364:1049–1058.
Plaistow, S. J., C. T. Lapsley, and T. G. Benton. 2006. Context-dependent intergenerational effects: the interaction between past and present environments and its effect on population
dynamics. Am. Nat. 167:206–215.
Plaistow, S. J., J. J. H. ST Clair, J. Grant, and T. G. Benton. 2007. How to put all your eggs in one basket: empirical patterns of offspring provisioning throughout a mother’s
lifetime. Am. Nat. 170:520–529.
Ranta, E., P. Lundberg, V. Kaitala, and J. Laakso. 2000. Visibility of the environmental noise modulating population
dynamics. Proc. Biol. Sci. 267:1851–1856.
Ratikainen, II, J. A. Gill, T. G. Gunnarsson, W. J. Sutherland, and H. Kokko. 2008. When density dependence is not instantaneous: theoretical developments and management
implications. Ecol. Lett. 11:184–198.
de Roos, A. M., T. Schellekens, T. van Kooten, K. E. van de Wolfshaar, D. Claessen, and L. Persson. 2007. Food-dependent growth leads to overcompensation in stage-specific biomass when mortality increases: the influence of maturation versus reproduction regulation. Am. Nat. 170:
E59–E76.
Rouyer, T., J. M. Fromentin, and N. C. Stenseth. 2010. Environmental noise affects the fluctuations of Atlantic large
pelagics. Prog. Oceanogr. 86:267–275.
Rouyer, T., G. Ottersen, J. M. Durant, M. Hidalgo, D. A. G. Ø. Hjermann, J. Persson, et al. 2011. Shifting dynamic forces in fish stock fluctuations triggered by age truncation?
Glob. Change Biol. 17:3046–3057.
Rouyer, T., A. Sadykov, J. Ohlberger, and N. C. Stenseth. 2012. Does increasing mortality change the response of fish populations to environmental fluctuations? Ecol. Lett.
15:658–665.
Schroder, A., L. Persson, and A. M. de Roos. 2009. Culling experiments demonstrate size-class specific biomass increases
with mortality. Proc. Natl Acad. Sci. USA 106:2671–2676.
Schroeder, A., A. van Leeuwen, and T. C. Cameron. 2014. When less is more: positive population-level effects of
mortality. Trends Ecol. Evol. 29:614–624.
Shelton, A. O., and M. Mangel. 2011a. Fluctuations of fish populations and the magnifying effects of fishing. Proc. Natl
Acad. Sci. USA 108:7075–7080.
Shelton, A. O., and M. Mangel. 2011b. Reply to Sugihara et al.: the biology of variability in fish populations. Proc.
Natl Acad. Sci. USA 108:E1226–E1226.
Shelton, A. O., J. A. Hutchings, R. S. Waples, D. M. Keith, H. R. Akcakaya, and N. K. Dulvy. 2015. Maternal age effects on Atlantic cod recruitment and implications for future
population trajectories. ICES J. Mar. Sci. 72:1769–1778.
Smallegange, I. M., and J. A. Deere. 2014. Eco-evolutionary interactions as a consequence of selection on a secondary
sexual trait. Pp. 145–169inJ. Moyalarano, J. Rowntree, G.
Woodward, eds. Advances in ecological research, Vol 50: eco-evolutionary dynamics. Elsevier Academic Press Inc., San Diego.
Stenseth, N. C., and T. Rouyer. 2008. Ecology–destabilized
fish stocks. Nature 452:825–826.
Strevens, C. M. J., and M. B. Bonsall. 2011. The impact of alternative harvesting strategies in a resource-consumer
metapopulation. J. Appl. Ecol. 48:102–111.
Sugihara, G., J. Beddington, C.-H. Hsieh, E. Deyle, M. Fogarty, S. M. Glaser, et al. 2011. Are exploited fish populations
stable? Proc. Natl Acad. Sci. USA 108:E1224–E1225.
Targonska, K., D. Zarski, S. Krejszeff, and D. Kucharczyk.
2012. Influence of age of wild ideLeuciscus idus(L.) female
on spawning effectiveness under controlled conditions. Ital.
J. Anim. Sci., 11:342–346.
Valentin, F. N., N. F. Do Nascimento, R. C. Da Silva, E. A. Tsuji, M. D. C. Faria Paes, T. C. Ribeiro Dias Koberstein, et al. 2015. Maternal age influences on reproductive rates in
Nile tilapia (Oreochromis niloticus). Revista Brasileira De
Zootecnia - Braz. J. Anim. Sci. 44:161–163.
Wearing, H. J., S. M. Sait, T. C. Cameron, and P. Rohani. 2004. Stage-structured competition and the cyclic dynamics
of host-parasitoid populations. J. Anim. Ecol. 73:706–722.
Wikstrom, A., J. Ripa, and N. Jonzen. 2012. The role of harvesting in age-structured populations: disentangling dynamic and age truncation effects. Theor. Popul. Biol.
82:348–354.
Supporting Information
[image:13.595.57.294.67.682.2]Additional Supporting Information may be found online in the supporting information tab for this article:
Figure S1. Treatment time series of adult numbers pre-dicted from General Additive Model.
Figure S2. Population time series averaged across six replicates of all harvest and environmental variation treat-ment combinations.
Figure S3. Plot of correlation structures between long term averages of adult versus juvenile population densities per replicate population tube.
Figure S4. Plot of centred moving average of population size and coefficient of variation of population size for 10 and 20 week windows.
Table S1. Summary of the effects of environmental varia-tion and harvesting on the size of adult, juvenile egg or total soil mite populations.
[image:13.595.300.530.72.401.2]