*For correspondence: [email protected]
Present address:†National Institute of Diabetes and Digestive and Kidney Diseases, National Institutes of Health, United States;‡Department of Molecular Sciences, Macquarie University, Sydney, Australia; §School of Biosciences, University of Kent, Canterbury, United Kingdom
Competing interests:The authors declare that no competing interests exist.
Funding:See page 27 Received:05 March 2019 Accepted:24 September 2019 Published:25 September 2019 Reviewing editor: Tricia R Serio, The University of Massachusetts, Amherst, United States
Copyright Karamanos et al. This article is distributed under the terms of theCreative Commons Attribution License, which permits unrestricted use and redistribution provided that the original author and source are credited.
Structural mapping of oligomeric
intermediates in an amyloid assembly
pathway
Theodoros K Karamanos
1,2†, Matthew P Jackson
1,2, Antonio N Calabrese
1,2,
Sophia C Goodchild
1,2‡, Emma E Cawood
1,2, Gary S Thompson
1,2§,
Arnout P Kalverda
1,2, Eric W Hewitt
1,2, Sheena E Radford
1,2*
1
The Astbury Centre for Structural Molecular Biology, University of Leeds, Leeds,
United Kingdom;
2School of Molecular and Cellular Biology, University of Leeds,
Leeds, United Kingdom
Abstract
Transient oligomers are commonly formed in the early stages of amyloid assembly. Determining the structure(s) of these species and defining their role(s) in assembly is key to devising new routes to control disease. Here, using a combination of chemical kinetics, NMR spectroscopy and other biophysical methods, we identify and structurally characterize the oligomers required for amyloid assembly of the proteinDN6, a truncation variant of humanb2 -microglobulin (b2m) found in amyloid deposits in the joints of patients with dialysis-relatedamyloidosis. The results reveal an assembly pathway which is initiated by the formation of head-to-head non-toxic dimers and hexamersen routeto amyloid fibrils. Comparison with inhibitory dimers shows that precise subunit organization determines amyloid assembly, while dynamics in the C-terminal strand hint to the initiation of cross-bstructure formation. The results provide a detailed structural view of early amyloid assembly involving structured species that are not cytotoxic. DOI: https://doi.org/10.7554/eLife.46574.001
Introduction
Oligomers have been the focus of amyloid research over decades because of their pivotal role in assembly and their potential cytotoxicity (Chiti and Dobson, 2017). Numerous aggregation-prone proteins (or their fragments) form oligomers (Benilova et al., 2012; Wei et al., 2011; Laganowsky et al., 2012;Apostol et al., 2013), some of which are cytotoxic (Laganowsky et al., 2012; Ono et al., 2009; Fusco et al., 2017), while others are not (Mannini et al., 2014). Many groups have attempted to elucidate the structure(s) of amyloid oligomers with different biological properties (Chiti and Dobson, 2017). However, their ephemeral nature, dynamic signature, and het-erogeneity in mass and conformation provide significant experimental challenges. Hence, our cur-rent understanding of the structure of oligomers is often limited to low-resolution models (Fusco et al., 2017;Vestergaard et al., 2007;Campioni et al., 2010;Cremades et al., 2012), or to oligomers assembled from non-natural amino acids, short peptides, or protein fragments (Laganowsky et al., 2012;Apostol et al., 2013;Sangwan et al., 2017). Establishing a relationship between the oligomers observed and the mechanism of amyloid formation is also an important, but challenging, task. In some cases, oligomers have been shown to be ‘off-pathway’ since they have to dissociate for amyloid formation to proceed (Wu et al., 2010;Baskakov et al., 2002;Souillac et al., 2003;Bieschke et al., 2010). Characterization of such species, however, does not provide insight into the structural mechanism by which initially unstructured (e.g. Ab42, a-synuclein) or natively structured proteins (e.g. lysozyme, transthyretin, antibody light chains, b2-microglobulin (b2m))
(Iadanza et al., 2018a). Other oligomers have been shown to be on-pathway (Fusco et al., 2017; Cremades et al., 2012), or to form via secondary nucleation processes that enhance the rate of fibril formation (Cohen et al., 2013). Proteins in an oligomeric or aggregated form have also been charac-terized kinetically, thermodynamically and biophysically (Cohen et al., 2013;Cohen et al., 2018; Lenton et al., 2017). However, a detailed understanding ofboththe structural properties of oligom-ersandtheir role in assembly is needed in order to understand the structural mechanism(s) of amy-loid formation and the origins of cytotoxicity, as well as to design inhibitors of the assembly process. Here, we describe an integrative approach which uses kinetic modeling to identify oligomers formed on-pathway to fibril formation, NMR spectroscopy and other biophysical methods to deter-mine their structural properties, and cellular assays to deterdeter-mine their cytotoxicity. The strategy employed can be applied to other assembling protein systems and draws on the powers of NMR to provide detailed structural information about individual precursors in dynamic equilibrium within complex mixtures of assembling species, and kinetic modeling to ascribe their role in amyloid forma-tion. To exemplify this combined structural and kinetic approach we focus on the naturally occurring variant of humanb2m, known asDN6. This variant lacks the N-terminal six amino acids and is formed
by natural proteolytic truncation of the wild-type (WT) protein (Esposito et al., 2000;Eichner et al., 2011). WT human b2m (named herein as hb2m) forms amyloid deposits in the joints of patients
undergoing long term hemodialysis (Gejyo et al., 1985). However, hb2m does not aggregate into
amyloid fibrils at physiologically relevant pH and temperature on an experimentally accessible time-scale in vitro (the pH in normal and diseased joints ranges from 5.5 to 7.4;Floege and Ehlerding, 1996). Addition of Cu2+ions, detergents, organic solvents, glycosaminoglycans or collagen can drive hb2m amyloid formation at neutral pH (Platt and Radford, 2009; Stoppini and Bellotti, 2015;
Yamamoto et al., 2005; Benseny-Cases et al., 2019). These reagents partially unfold the native protein, facilitating cis-trans isomerization of Pro32 that initiates assembly (Eichner et al., 2011; Platt and Radford, 2009;Yamamoto et al., 2005;Chiti et al., 2001). By contrast with the intransi-gence of hb2m to form amyloid in vitro,DN6 is highly amyloidogenic, forming fibrils rapidly in vitro
in the absence of additives at pH 6–7 (Karamanos et al., 2016).DN6 forms~30% ofb2m in amyloid
plaques in patients with dialysis-related amyloidosis (Bellotti et al., 1998). Previous studies have shown thatDN6 can induce amyloid formation of hb2m at near-neutral pH in vitro (Eichner et al.,
2011) and can co-assemble with the WT protein into amyloid fibrils (Sarell et al., 2013). The struc-ture of hb2m in amyloid fibrils formed in vitro at low pH (pH 2.0) has also been solved recently using
solid-state NMR and cryo-EM, revealing a parallel in-register cross-b structure typical of amyloid, which differs dramatically from the all anti-parallel immunoglobulin fold of the native precursor (Iadanza et al., 2018b). The atomic structure(s) of hb2m amyloid fibrils formed in vivo, and those of
DN6 formed in vitro or ex vivo, however, are not yet known.
Several examples of oligomers (dimers, tetramers and hexamers) of WT hb2m have been reported
previously (Calabrese et al., 2008; Eakin et al., 2006; Mendoza et al., 2011; Mendoza et al., 2010; Halabelian et al., 2015; Colombo et al., 2012; Rennella et al., 2013; Liu et al., 2011; Karamanos et al., 2014), with one report of a domain swapped dimer ofDN6 stabilized by addition of a nanobody (Domanska et al., 2011). Since hb2m is inert to aggregation at physiological pH and
temperature in vitro, the oligomerization of the protein was stimulated by mutation and/or the addi-tion of Cu2+ ions (Calabrese et al., 2008; Eakin et al., 2006; Mendoza et al., 2011;
Mendoza et al., 2010), or by linkage of monomers via non-native disulfide bonds (Halabelian et al., 2015;Colombo et al., 2012). Although some of these oligomers form under conditions in which WT hb2m may eventually form fibrils, the role of individual oligomeric species in the aggregation
mecha-nism remains unclear. The oligomers formed in the initiating stages of aggregation ofDN6 into amy-loid also remain obscure.
Here, we show that amyloid formation ofDN6 occurs via a remarkably specific assembly mecha-nism involving the transient formation of dimers and hexamers. Exploiting NMR methods able to analyze dynamic and lowly populated states (Anthis and Clore, 2015), we characterize these assem-blies, yielding a structural model of the initiating events in DN6 aggregation in atomic detail. The results reveal the formation of head-to-head dimers that pack into symmetric hexamers that retain a native-like immunoglobulin fold and are not cytotoxic. The hexamers appear to be primed for further conformational change into the cross-bstructure of amyloid by dynamic unfurling of their C-terminal
enable the development of routes to combat disease by targeting the specific protein-protein inter-actions that define the early stages of assembly.
Results
Fibril elongation occurs through an oligomeric state
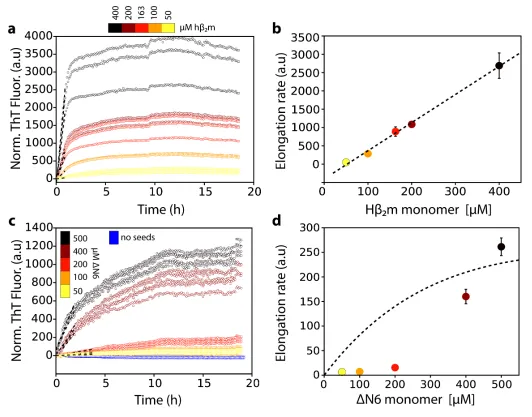
Previous results have shown thatDN6 assembles rapidly into amyloid fibrils in vitro at pH 6.2, but not at pH 8.2 (Eichner et al., 2011), suggesting that lowering the pH increases the population of aggregation-prone species. Such species may also be relevant in vivo given the acidic microenviron-ment of the joints of DRA patients (Eichner et al., 2011;Bellotti et al., 1998;Karamanos et al., 2014). At pH 6.2 (close to its pI of 5.8)DN6 is dynamic, but retains a native-like immunoglobulin fold (Eichner et al., 2011). To determine the kinetic mechanism by whichDN6 aggregates into amyloid fibrils, experiments were performed in whichDN6 fibril seeds (20mM monomer equivalent concen-tration) were incubated with different concentrations ofDN6 monomers (20mM to 500mM) and the rate of amyloid formation was monitored by the fluorescence of thioflavin T (ThT). All experiments were performed at pH 6.2 at a total ionic strength of 100 mM (see Materials and methods). The sim-plest kinetic mechanism in which monomers add to the fibril ends would result in a linear depen-dence of the initial rate of fibril elongation versusthe monomer concentration, with saturation at high monomer concentrations (Buell et al., 2014;Buell et al., 2010;Xue et al., 2009). Such behav-ior is observed for seeded assembly of acid unfolded monomers of hb2m, which initially lack
persis-tent structure (Platt et al., 2008), into amyloid fibrils at pH 2.0 (Figure 1a,b). By contrast, DN6 showed more complex behavior, with a clear non-linearity in the initial rate of elongation versus monomer concentration, in which rapid seeded growth occurs only above~200mMDN6 (Figure 1c, d). This indicates that fibril elongation byDN6 must involve addition of one or more oligomeric spe-cies to the fibril ends under the conditions employed.
Native-like dimers and hexamers form during
D
n6 assembly
The concentration-dependence ofDN6 elongation could be explained by an oligomer(s) acting as the elongation unit. To explore whether oligomeric species ofDN6 are formed under the conditions employed, sedimentation velocity analytical ultracentrifugation (AUC), size exclusion chromatogra-phy (SEC), cross-linking, and NMR experiments were performed. These approaches report on the conformational properties and molecular weight distribution of the assemblies formed at different
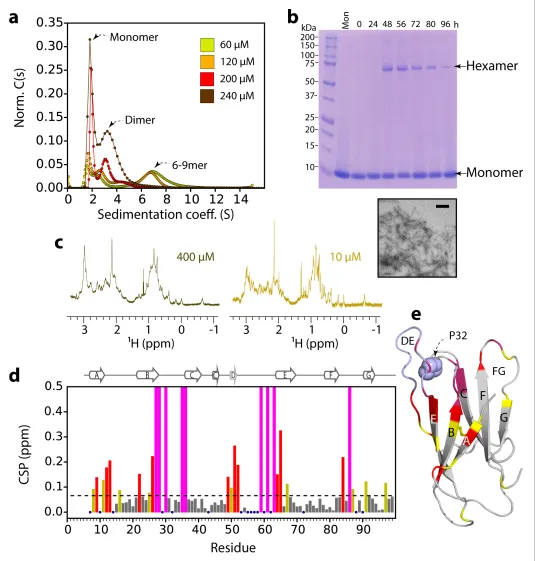
DN6 concentrations. Sedimentation velocity AUC experiments showed that DN6 forms discrete oligomers at pH 6.2, with monomers, dimers and higher order species with a sedimentation coeffi-cient (S value) consistent with 6–9-mers (although the rapid equilibration of the species present pre-vents accurate determination of their mass and population) (Figure 2a). To investigate the molecular mass of the species present,DN6 was cross-linked after different incubation times in the absence of fibril seeds using 1-ethyl-3-(3-dimethylaminopropyl)-carbodiimide hydrochloride (EDC) (see Materials and methods) and the resulting species examined using SDS-PAGE (Figure 2b). This revealed the presence of hexamers during assembly (Figure 2b). The population of the hexameric species is decreased at later time points, presumably because it is consumed into fibrils (Figure 2b). Analytical SEC ofDN6 at different protein concentrations without cross-linking revealed only mono-mers and dimono-mers (Figure 2—figure supplement 1a), consistent with the higher order assemblies dis-sociating upon dilution on the column. However, when cross-linking was performed prior to SEC, higher molecular weight oligomers were observed, with these species being more abundant when higher protein concentrations were used (Figure 2—figure supplement 1b,c). At the highest con-centration of DN6 used (500 mM) cross-linking resulted in the rapid formation of high molecular weight aggregates that elute in the void volume (Figure 2—figure supplement 1b,c). The popula-tion of these aggregates increases with time, accompanied by deplepopula-tion of the oligomers, consistent with these species being capable of assembly into amyloid (Figure 2—figure supplement 1d).
1
these regions form the intermolecular interfaces in the higher molecular weight species (Figure 2d, e). Consistent with these observations, measurement of the rotational correlation time (tc) and
[image:4.612.41.573.60.477.2]diffu-sion coefficient of the sample, which reflect the average size and shape of the molecules formed, showed a linear dependence onDN6 concentration, consistent with protein oligomerization in which
Figure 1.Dependence of the fibril elongation rate on the concentration of soluble protein. Seeded elongation assays for (a) hb2m at pH 2.0 monitored by ThT fluorescence. 20mM of preformed seeds of hb2m (formed at pH 2.0) and varying amounts of soluble protein were added, as indicated in the key. Note that the protein does not aggregate under these conditions in the absence of seeds on this timescale (Xue et al., 2008). The dashed line shows the initial rate of each reaction. (b) The initial rate of fibril elongation (shown in units of ThT fluorescence (a.u.)/h) versus the concentration of hb2m added. The dashed line represents a prediction using a monomer addition model (seeTable 4). (c) Seeded elongation assays forDN6 using 20
mM preformed seeds formed fromDN6 at pH 6.2 as a function of the concentration of solubleDN6 added. Open blue symbols denote the ThT fluorescence signal of 500mMDN6 in the absence of seeds. The dashed line shows the initial rate of each reaction. (d) The initial rate of fibril elongation (shown in units of ThT fluorescence (a.u)/h) versus the concentration of solubleDN6 added. The dashed line shows the dependence of the elongation rate (in units of ThT fluorescence (a.u)/h) on the concentration of monomer assuming a monomer addition model (seeTable 4). The elongation rate for monomer addition shows a hyperbolic behavior as a function of monomer concentration, with a linear dependence at lower monomer concentrations, followed by a saturation phase at higher monomer concentrations. The simulation in (b) (dashed line) uses a slower
microscopic elongation rate (ke) (Table 4) than that used in panel (d) and therefore saturation is not achieved by 410mM protein in (b), but is in (d). Five replicates are shown for each protein concentration. Error bars show the standard deviation between all replicates.
the resulting species are in dynamic exchange (Figure 2—figure supplement 1e,f). Together these results show thatDN6 assembles into dimers and hexamers that are assembly competent, in dynamic exchange, and assemble via interfaces which are located in the apical region of the protein that sur-rounds Pro32 (Figure 2e).
To estimate the dissociation constants for dimer and hexamer formation, the chemical shifts and residual dipolar couplings (RDCs) of individual resonances were measured as a function ofDN6 con-centration from 10 to 410mM (Figure 2—figure supplement 2a–e). Significant chemical shift differ-ences were observed when theDN6 concentration was increased from 10 mM to 50 mM without significant line broadening (Figure 2—figure supplement 2c, panels i-iii). Increasing the protein con-centration to 100mM caused a decrease in the chemical shift differences (Figure 2—figure supple-ment 2c, panel iv), which then increase again in magnitude at 200mM and 410mM, accompanied by significant line broadening (Figure 2—figure supplement 2a and c, panels v,vi). This complex behavior is consistent with a monomer-dimer-hexamer equilibrium in which the monomers and dimers have different chemical shifts, while the chemical shifts of dimers and hexamers are similar (an assumption that is supported by our structural models, see below), and the exchange rate between monomers and hexamers is significantly faster than that between monomers and dimers. Therefore, the monomer-dimer equilibrium dominates the equilibrium (and the observed chemical shift) at low concentrations (50mM). At higher concentrations the dimer is depleted relative to the hexamer and the chemical shift observed becomes a complex combination of the population of each species, the exchange rate between each species, and the difference in chemical shift of each residue in each assembly. Fitting the chemical shift data to a monomer – dimer – hexamer model yields a Kdfor dimer formation of50mM, while that of hexamer formation is~10±5 x 10 9M2
(Benilova et al., 2012) (see Materials and methods andFigure 2—figure supplement 2b,d), indicat-ing that once dimers form they have a high affinity for one another. Importantly, the monomer – dimer – hexamer model with the estimated affinities adequately describes the observed increase in thetcand the observed diffusion coefficient versus protein concentration (Figure 2—figure
supple-ment 1e,f), independently supporting the model derived. Increasing the Kd for dimer formation
to >100mM results in unrealistically low values for the hexamerization Kd(Figure 2—figure
supple-ment 2d). Moreover, measurement of RDCs versus protein concentration results in a biphasic curve (Figure 2—figure supplement 2e), consistent with a multi-equilibrium process. Using these data, the RDCs of the dimer species can be calculated for a range of estimated Kd values (see
Materials and methods). Fitting the dimer RDCs to the structure of DN6 (2XKU; Eichner et al., 2011), shows significantly poorer fits to the predicted RDC values assuming a dimer Kdhigher than
50mM (Figure 2—figure supplement 2f). To explain the chemical shift and RDC data, therefore, the dimer Kdmust be50mM.
Specific interfaces determine aggregation
To map the interfaces involved inDN6 oligomer formation in more detail, intermolecular paramag-netic relaxation enhancement (PRE) experiments were performed. The PRE depends on the distance Figure 2 continued
differences between the1H-15N HSQC spectrum ofDN6 at 10mM and 400mM. Blue dots represent residues for which assignments are missing in both spectra. The dashed line represents one standard deviation (s) of chemical shifts across the entire dataset. Residues that show chemical shift
differences > 1sare shown in yellow,>2sare colored red, and residues for which the chemical shift difference is not significant (<1s) are colored gray. Residues that are broadened beyond detection in the spectrum obtained at 400mM are colored in magenta (see alsoFigure 2—figure supplement 2a). Residues are numbered according to the sequence of the WT protein. Arg 97 is hydrogen bonded to residues in the N-terminus and presumably is indirectly affected by the interaction. (e) The structure ofDN6 (2XKU;Eichner et al., 2011) colored in the same scheme as (d). Pro32 is shown in blue space-fill. The buffer used in all experiments was 10 mM sodium phosphate pH 6.2 containing 83.3 mM NaCl (to maintain a constant ionic strength of 100 mM for all experiments), 25˚C.
DOI: https://doi.org/10.7554/eLife.46574.003
The following figure supplements are available for figure 2:
Figure supplement 1.Analysis ofDN6 oligomerization. DOI: https://doi.org/10.7554/eLife.46574.004
between a paramagnet and adjacent nuclei and can provide distance information about (transient) binding interfaces for nuclei that are within~20 A˚ of the paramagnetic center (Clore and Iwahara, 2009), quantified by the effect of the spin label on the relaxation rates of each amide proton (the HN-G2 PRE rate). 14N-DN6 was spin-labeled with (1-oxyl-2,2,5,5-tetramethyl-D3-pyrroline-3-methyl)
methanethiosulfonate (MTSL) by creating Cys variants at positions 20, 33, 54 or 61. Each protein (60
mM) was then mixed with15N-DN6 (60mM) at pH 6.2. At this total protein concentration, the PREs observed are dominated by the monomer-dimer equilibrium (35% of molecules are monomer, 51% ofDN6 molecules are in dimers and 14% ofDN6 molecules are in hexamers, determined from the Kd
values measured above). These experiments (Figure 3) showed increased HN-G2rates for residues in
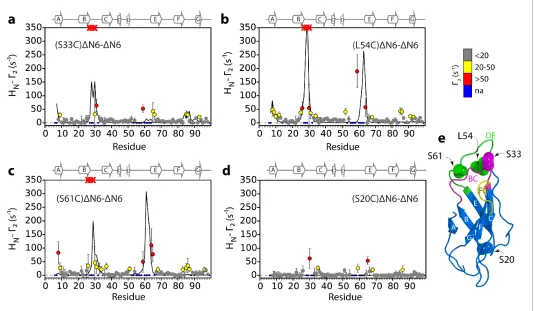
the A strand and the BC, DE and FG loops when the spin label is attached to residues 33, 54, or 61, suggestive of a head-to-head interaction involving the apical regions of the protein (Figure 3a–c and e). In accord with this conclusion, when MTSL is attached at position 20 at the distal side of the protein (Figure 3e), the HN-G2rates are vastly decreased (Figure 3d).
To determine whether the head-to-head dimers are critical for aggregation, the AUC, PRE and fibril growth experiments were also performed at pH 8.2 whereDN6 does not assemble into amyloid fibrils even after extended incubation times (Figure 3—figure supplement 1a). The sedimentation velocity AUC experiments revealed that monomers and tetramers are formed at pH 8.2, but not hex-amers, with the equilibrium in favor of the monomer (Figure 3—figure supplement 1b). Consistent with this, thetcof 600mM DN6 at pH 8.2 is~12 ns, in marked contrast with thetcof ~50 ns
pre-dicted for 600 mM DN6 at pH 6.2 (Figure 2—figure supplement 1e). Finally, intermolecular PRE experiments at pH 8.2 showed smallG2rates irrespective of the site of MTSL labeling (Figure
3—fig-ure supplement 1c–d), suggesting that the monomers bind with different affinity and/or via different interfaces at this pH. To investigate these hypotheses, CPMG relaxation dispersion NMR experi-ments were performed. These experiexperi-ments are able to detect excited states populated to as little as 1% of the total protein in solution (Hansen et al., 2008). Concentration-dependent CPMG profiles of residues in the B strand, D strand, DE loop, E strand and EF loop were observed at pH 8.2 ( Fig-ure 3—figFig-ure supplement 2a–d), indicating that the binding interface for tetramer formation differs substantially from the loop-loop interactions in the apical region of the protein that dominate assem-bly at pH 6.2, despite the fact thatDN6 retains an immunoglobulin-like fold at both pH values ( Fig-ure 3—figFig-ure supplement 2e,f). As a consequence of the altered interface that forms at pH 8.2, hexamers and fibrils do not form. Together these results indicate that the head-to-head dimers formed at pH 6.2 are uniquely able to assemble into the hexamers that are crucial for fibril assembly.
Different dimer structures determine amyloid inhibition and
propagation
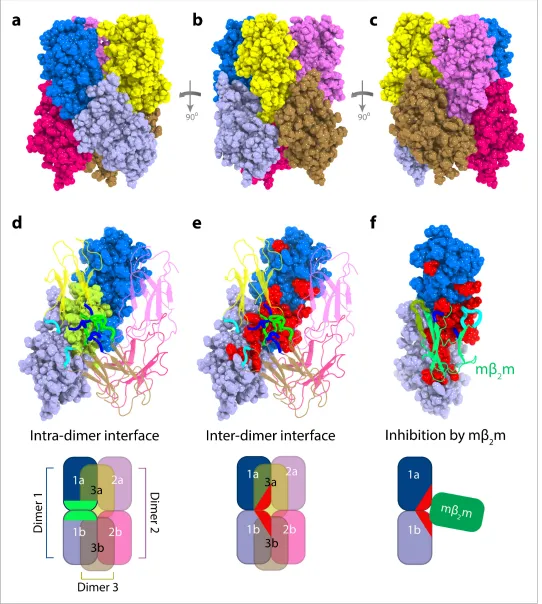
To generate dimer structures consistent with the experimental data obtained, simulated annealing molecular dynamics calculations were performed. The calculations converged to two dimer struc-tures (Figure 4a,Figure 4—figure supplement 1andTable 1). In the lowest energy model (model A), theDN6 monomers are arranged in an extended conformation with the N-terminal residues M6 and I7 (WT numbering), along with the BC, DE and FG loops forming the interface (Figure 4a). The inhibitory dimer of DN6:murine b2m (mb2m) was previously determined using a similar approach
(Karamanos et al., 2014). This dimer also has a head-to-head subunit arrangement but is character-ized by a more acute angle betweenDN6 subunits in which the monomers interact predominantly through the BC and DE loops (Karamanos et al., 2014) (Figure 4b,Video 1). Thus, distinct protein dimers formed from closely related sequences (mb2m and hb2m are 70% identical and 90% similar in
sequence) give rise to fundamentally different outcomes of assembly.
Structural models of on-pathway hexamers
Although the majority of the intermolecular PREs can be satisfied by the dimer A structure, the fits are not perfect (Figure 3a–d), presumably since~14% ofDN6 molecules form hexamers at the con-centration ofDN6 employed (120mM). The PRE experiments were thus repeated at higher concen-trations (320–400mM) ofDN6, wherein > 40% of DN6 molecules are predicted to be in hexamers. These experiments revealed a pattern of HN-G2rates similar to those obtained at 120mMDN6 (
Fig-ure 5—figFig-ure supplement 1a–d), with the highest HN-G2rates involving the N-terminus, BC, DE and
experiments at 180mMDN6 (26% ofDN6 molecules are monomer, 48% are dimer, and 26% are hex-amer) and 480mMDN6 (13% ofDN6 molecules are monomer, 32% are dimer and 55% are hexamer) showed that residues in the apical regions ofDN6, surrounding Pro 32, are also in concentration-dependent exchange at bothDN6 concentrations at pH 6.2, in support of this conclusion (Figure 5— figure supplement 2).
[image:8.612.42.576.57.368.2]The ordered nature of assembly (monomer, dimer, hexamer) and the identification of the interfa-ces involved, allowed us to generate models for the hexameric species (Figure 5—figure supple-ment 3). The measured PREs were converted into distances and simulated annealing molecular dynamics calculations were performed to create hexamer structures consistent with the experimental PRE and chemical shift data using the lowest energy dimer model (dimer A shown inFigures 4aand 5-Figure 5—figure supplement 3a), as well as the less favorable dimer model B (Figure 4—figure
Figure 3.Identification of interacting surfaces inDN6 dimers. Intermolecular PRE data for the self-association ofDN6.15
N-DN6 (60mM) was mixed with an equal concentration of (a)14N-(S33C)DN6-MTSL; (b)14N-(L54C)DN6-MTSL; (c)14N-(S61C)DN6-MTSL; or (d)14N-(S20C)DN6-MTSL in 10 mM sodium phosphate buffer, pH 6.2 containing 83.3 mM NaCl (a total ionic strength of 100 mM). The resultingG2rates are color-coded according to the
amplitude of the PRE effect (see scale bar: gray-insignificant (<20 s 1), yellow->20 s 1, red->50 s 1, pH 6.2, 25˚C). Blue dots in the plots are residues for which resonances are not assigned (na) at pH 6.2. Red crosses indicate high HN-G2rates for which an accurate value could not be determined. Control experiments showed that the small PREs arising from14N-(S20C)DN6-MTSL arise from non-specific interactions with MTSL itself. Solid black lines depict fits to the PRE data for the dimer structure shown inFigure 4a. Note the poor fits for some residues which are sensitive to hexamer formation (14% of
DN6 molecules) under the conditions used. Residues are numbered according to the WT sequence and the position ofb-strands (2XKU;Eichner et al., 2011) is marked above each plot. (e) The structure ofDN6 (2XKU;Eichner et al., 2011) with the BC loop shown in magenta, the DE loop in green and the FG loop in yellow. The MTSL attachment sites are highlighted as spheres.
DOI: https://doi.org/10.7554/eLife.46574.006
The following figure supplements are available for figure 3:
Figure supplement 1.Lack of a hexamer population precludes aggregation ofDN6 at pH 8.2. DOI: https://doi.org/10.7554/eLife.46574.007
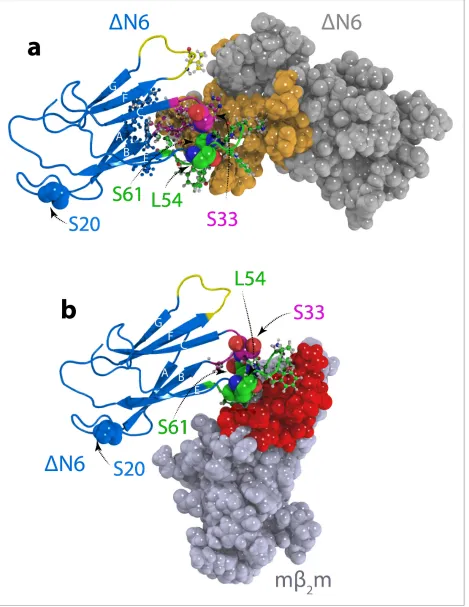
supplement 1eandFigure 5—figure supplement 3b), as starting points. Note that the structure calculation strategy employed does not require knowledge of the dimer and hexamer populations (see Materials and methods). Starting from dimer A (Figure 4a) the structure calculation resulted in a hexamer in which the three dimers trimerize to form a compact daisy-like structure (Figure 5a–c). The PREs back-calculated from this model are consistent with the experimental data (Figure 5—fig-ure supplement 4). Importantly, hexamer structures generated from dimer B (Figure 4—figure sup-plement 1e) resulted in poorer fits to the PRE profiles (Materials and methods andTable 2).
In the hexamer models generated from dimer A the dimeric subunits are arranged in a helical manner twisted by~120˚, creating a hexamer that is~60 A˚ in diameter and 75 A˚ in length. This hex-amer model is consistent with the collision cross-section (CCS) ofDN6 hexamers measured using the lowest charge state (15+) (the most native-like species; Vahidi et al., 2013; see Materials and methods) detected using Electrospray Ionization Ion Mobility Spectrometry – Mass Spectrometry (ESI-IMS-MS), but the measured CCS is inconsistent with hexamers derived using dimer B (Figure 5—figure supplement 5a). The monomer-monomer and dimer-dimer interfaces in the best fit hexamer structure (Figure 5a–e) involve similar, but not identical, regions, with the inter-dimer interface extending further into theb-sheet containing the A, B, E and Db-strands, while the intra-dimer interface is formed mostly through the BC and DE loops (Figure 5d–eandVideo 2). The formation of dimers generates a hydrophobic surface which becomes buried in the hexamer (Figure 5e, Figure 5—figure supplement 5b and Table 3). Consistent with this, the cross-linked hexamers show a small (1.3-fold) increase in fluorescence in the presence of the hydrophobic dye 8-anilino-1-naphthalenesulfonic acid (ANS), that is much smaller than the ~100 fold increase in ANS fluorescence observed for a typical ‘molten globule’ state (Semisotnov et al., 1991), but similar in magnitude to ANS bound to the highly structured on-pathway folding intermediate of Im7 (moni-tored using the trapped equilibrium mimic of this species, Im7 L53AI54A (Spence et al., 2004) ( Fig-ure 5—figFig-ure supplement 5d). TheDN6 dimers show a similar increase in ANS fluorescence as the hexamers despite having a larger exposed hydrophobic surface area, possibly because ANS binds more weakly or has a lower quantum yield when dimer-bound (Figure 5—figure supplement 5c–d). The interface formed in the inhibitoryDN6-mb2m dimer overlaps with the surface required for
hex-amerization, but not forDN6-DN6 dimerization (Figure 5f), rationalizing why mb2m is able to inhibit
amyloid formation (note that the Kdof the mb2m:DN6 complex is 70mM (Karamanos et al., 2014),
similar to that (~50mM) estimated here forDN6 homo-dimerization). The dimers and hexamers were incubated with SH-SY5Y cells, a cell line that is commonly used in studies of amyloid toxicity (Laganowsky et al., 2012; Fusco et al., 2017; Campioni et al., 2010; Jakhria et al., 2014; Leri et al., 2016;Giorgetti et al., 2008), and which has been shown previously to take up mono-meric and fibrillarb2m (Jakhria et al., 2014). Interestingly, there was no evidence for cytotoxicity in
assays for 3-(4,5-dimethylthiazol-2-yl) 2,5-diphenyltetrazolium bromide (MTT) reduction, lactate dehydrogenase release, reactive oxygen species formation and cellular ATP level (see Materials and methods) (Figure 5—figure supplement 6). However, rapid dissociation of the uncross-linked oligomers, prevention of conversion to a cytotoxic form by cross-linking, or cytotoxic-ity requiring different cell types or prolonged exposure (>24 hr) to the oligomers cannot be ruled out.
Hexamer dynamics may prime further assembly into amyloid
The hexamer shown inFigure 5retains a native-like immunoglobulin fold in which theb-strands are anti-parallel. Hence, a major conformational rearrangement has still to occur forDN6 to form amy-loid fibrils in which theb-strands stack in a parallel in-register structure (Debelouchina et al., 2010) (R. Silvers, Y. Su, R.G. Griffin, and S.E. Radford, unpublished). Hints of how this conformational change may be initiated were obtained by quantitative analysis of the CPMG data shown inFigure 6, Figure 5—figure supplement 2andFigure 6—figure supplement 1. Globally fitting these data for residues which lie in the dimer and/or hexamer interfaces (residues 26, 34, 35, 37, 51, 59, 65, 66, 67, 83, 84, 85,Figure 5d–e) to a two-state fast exchange model yields an exchange rate, kexbind, of
1790±290 s 1(Figure 6a,b). Distinct CPMG profiles were observed, however, for residues 87, 89,
Figure 4.Structural models ofDN6 dimers. Structural models of (a) the lowest energyDN6 homodimer (dimer A) and (b) theDN6-mb2m heterodimer that inhibitsDN6 fibril assembly (Karamanos et al., 2014). Interface residues (identified as those residues that have any pair of atoms closer than 5 A˚) are shown in a ball and stick representation on one subunit and are colored in space fill in gold in (a) or red in (b) on the surface of the second subunit.
hexamerization rather than the direct binding event itself. The CPMG data indicate that these resi-dues exchange with a lowly populated (2%) excited state with an interconversion rate, kexG, of
205 ±150 s 1, 10-fold slower than kexbind (Figure 6c–d and Figure 6—figure supplement 1a–e).
Therefore, a distinct process, possibly local unfolding of the C-terminalb-strand, occurs when the hexamer is formed that is driven by the free energy of hexamer formation (DG˚hexamer~4 kJ/mol). At
DN6 concentrations of 480mM kexGis increased to 1170±196 s 1(Figure 6—figure supplement
1f–i), consistent with increased hexamer formation enhancing the observed rate of dynamics of the G strand. Hexamer formation thus potentially destabilizes the G-strand ofDN6, causing local unfold-ing of this region of the polypeptide chain (although further experiments measurunfold-ing the sign of the chemical shift change would substantiate this conclusion). This may then lead to more catastrophic structural reorganization of the hexamer into the parallel in-register structure of amyloid (note that the G-strand sequence forms ab-strand in theDN6 fibril core;Su et al., 2014). Whether structural conversion occurs within the hexamer, at the fibril end, or requires further, more elaborate molecular steps such as active participation of the fibril surface, or disassembly into smaller structural units prior to fibril assembly, remains to be seen.
A unified model of
D
n6 polymerization
As a final test of the validity of the model ofDN6 assembly proposed we assessed the ability of the structural, kinetic and thermodynamic parameters deduced above to describe the observed rates of fibril formation measured using ThT fluorescence, as well as thetcvalues versusDN6 concentration
measured by NMR, and the fibril yield. Using the dimer and hexamer structural models shown in Fig-ures 4and5and the estimated Kdvalues for their formation, all of the derived experimental data
could be recapitulated (Figure 7). Fitting the seeded fibril growth data to different kinetic models that assume (i) monomers to add to the fibril ends (Figure 7—figure supplement 1a); (ii) monomers are in exchange with a monomeric excited state that is responsible for growth (Figure 7—figure supplement 1b); or (iii) dimers are the elongation units (Figure 7—figure supplement 1c), fail to describe the seeding data (Materials and methods and Table 4). By contrast, a model assuming addition of hexamers describes the ThT kinetic profiles well (Figure 7a), while a more complicated monomer-dimer-tetramer-hexamer model does not improve the fit significantly (Figure 7—figure supplement 1d). The populations of monomer, dimer and hexamer, together with the derived Figure 4 continued
of attachment of MTSL for the PRE experiments (residues 20, 33, 54 and 61) is highlighted in spheres. PDB files are publicly available from the University of Leeds depository (https://doi.org/10.5518/329). See alsoVideo 1.
DOI: https://doi.org/10.7554/eLife.46574.009
The following figure supplement is available for figure 4:
Figure supplement 1.AlternativeDN6 dimer structures. DOI: https://doi.org/10.7554/eLife.46574.010
Table 1.Agreement between experimental and back-calculated intermolecular PREs for the two dimer structures (dimer A and dimer B (seeFigure 5—figure supplement 3).
RMS values are shown comparing the measured versus the predicted values from the structure PREs measured from S33, L54 and S61. Data from position S20 were not used as they arise from non-spe-cific interactions with MTSL.
PRE term RMS dimer A RMS dimer B
S33C(DN6)-DN6 (s 1) 18.65 15.10
L54C(DN6)-DN6 (s 1) 29.02 27.44
S61C(DN6)-DN6 (s 1) 19.44 23.27
*High PREs (A˚) 2.78 3.79
*High PREs refer to PREs in the BC loop (measured from S33, L54 and S61) that (due to their large value) could not be measured accurately and therefore are incorporated as loose distance restraints.
structural models, are also consistent with the observed dependence oftcon protein
concentra-tion (Figure 7b). Finally, the amount of hexamer formed (in the absence of seeds) is also predic-tive of the fibril yield (Figure 7c,d) consistent with the hexamer being required for fibril forma-tion. This conclusion is also supported by the appearance of hexamers early during assembly in the absence of seeds and their disappearance as fibrils form (Figure 2b).
Discussion
Understanding the molecular details of oligomer formation is vital if we are to understand why pro-teins aggregate into amyloid and why different species have different toxicities (Iadanza et al., 2018a;Lu et al., 2013). Here, we present a gen-eral strategy, summarized in Figure 8—figure supplement 1, which allows the identification of oligomeric intermediates in amyloid assembly and enables their structural characterization. By combining the powers of NMR to detect lowly populated species in dynamic exchange, with complementary techniques such as AUC and cross-linking, oligomeric intermediates can be identified and structurally characterized in atomic detail. Importantly, to link these intermediates to the mechanism of aggregation, the derived affinities, stoi-chiometries and structural models can then be used to globally model the time course of fibril assembly. The strategy presented is not only applicable to protein aggregation, but to any weakly self-associating protein system. Given that the balance between monomers, dimers, higher molecu-lar weight oligomers and fibrils could depend critically on the experimental conditions, including the pH, temperature, protein concentration, amount of seed added, buffer composition and ionic strength, the same protein, or a closely related protein variant, could assemble via different mecha-nism(s) under different conditions. Indeed, aggregation of many amyloidogenic proteins, including hb2m (Iadanza et al., 2018b), is known to result in polymorphic fibrils (Close et al., 2018;
Fitzpatrick et al., 2017;Colvin et al., 2016; Zhang et al., 2019) that could extend via different mechanisms. The approach described here can distinguish between such different assembly path-ways and may be able to shed light on the role of individual oligomeric species in aggregation and the origins of amyloid polymorphism.
Using the workflow derived, we show that elongation ofDN6 amyloid seeds proceeds via a spe-cifically organized hexamer (Figure 8). This finding contrasts with the more common view of mono-mer addition to fibril ends that has been observed for Ab40/42 (Cohen et al., 2018),a-synuclein (Buell et al., 2014), huntingtin exon 1 (Vitalis et al., 2009) and for unfolded hb2m at pH 2.0
(Figure 1a) (Xue et al., 2008), while oligomers are thought to play critical roles in the primary/sec-ondary nucleation phases of the assembly of these proteins (Cohen et al., 2018). By contrast with these initially disordered proteins, the monomeric precursor ofDN6 assembly is structured, a sce-nario that accounts for more than 20 of the 70 human proteins known to cause amyloid disease (Sipe et al., 2016). Other amyloid precursors that are initially structured show an inability to self-seed (e.g. transthyretin;Hurshman et al., 2004), or display a non-classical dependence of the elon-gation rate on protein concentration (e.g. light chains;Blancas-Mejı´a et al., 2017). Whether these and other structured protein precursors assemble by a mechanism akin to that of DN6 could be answered by applying the integrated kinetic and structural approach described here to further exam-ples of this set of proteins.
Here, we show thatDN6 dimers and hexamers with well-defined interfaces involving the apical regions of the protein are required for fibrils to form under the conditions employed (Figure 8). By contrast, formation of other interfaces, such as that observed here forDN6 at pH 8.2 and the previ-ously reported mb2m:DN6 heterodimer (Karamanos et al., 2014) are not able to assemble into Video 1.Comparison of productive and inhibitory
amyloid fibrils (Figure 8). The arrangement of subunits in the DN6 dimer and hexamer observed here is different to that in a previously reported structure of a domain swappedDN6 dimer ( Fig-ure 8—figFig-ure supplement 2c). However, the G strand that is responsible for the domain swap is dynamic in the hexamer structure presented here, consistent with this edgeb-strand being able to dissociate from the b-sandwich to form both structures. A variant (H13F) of hb2m has also been
reported to form hexamers in the presence of Cu2+ions (Calabrese et al., 2008) (Figure 8—figure supplement 2a,b). In the crystal structure of this species, the dimers and hexamers interact in a side-to-side or head-to-head manner to create a ring-like assembly, in marked contrast with the daisy-like organization of monomers in theDN6 hexamers shown inFigure 5. Real-time NMR studies of the folding of hb2m have also revealed protein concentration-dependent exchange-broadening in
the apical loops of its transient folding intermediate IT(Rennella et al., 2013), an observation that
has been attributed to head-head oligomers, in agreement with the data presented here forDN6 which structurally mimics IT (Eichner et al., 2011). The interfaces observed in the DN6 dimer and
hexamer also differ from the canonical inter-sheet stacking between immunoglobulin domains in antibodies, suggesting that the structural features described here are specific to the dimers and hex-amers involved in amyloid assembly. Taken together, the results show thatb2m can form different
protein-protein interactions, only a specific set of which results in species capable of assembly into amyloid.
Although many studies have attributed the toxicity of amyloid to oligomeric species (Chiti and Dobson, 2017), we show here that the dimers and hexamers ofDN6 are not cytotoxic, at least under the conditions employed, possibly because they are structured and bury substantial hydrophobic Figure 5 continued
dimer formed from subunits 1a and 1b, superposed with the mb2m subunit in the inhibitoryDN6-mb2m dimer (Karamanos et al., 2014) (green cartoon). TheDN6-DN6 andDN6-mb2m dimers were aligned on theDN6 subunit 1b. Schematics of the assemblies are shown at the bottom colored as in (d–f). Note that the BC, DE and FG loops are highlighted as thicker chains in blue, green and cyan, respectively, in d-f. PDB files are publicly available from the University of Leeds depository (https://doi.org/10.5518/329). See alsoVideo 2.
DOI: https://doi.org/10.7554/eLife.46574.013
The following figure supplements are available for figure 5:
Figure supplement 1.Intermolecular PREs at highDN6 concentration. DOI: https://doi.org/10.7554/eLife.46574.014
Figure supplement 2.Additional interfaces do not form in theDN6 hexamer. DOI: https://doi.org/10.7554/eLife.46574.015
Figure supplement 3.Initial docking of dimer structures to create hexamer models. DOI: https://doi.org/10.7554/eLife.46574.016
Figure supplement 4.Intermolecular PREs back-calculated from the hexamer structural model generated from dimer A.
DOI: https://doi.org/10.7554/eLife.46574.017
Figure supplement 5.Conformational and biochemical properties ofDN6 hexamers.
DOI: https://doi.org/10.7554/eLife.46574.018
Figure supplement 6.DN6 oligomers are not cytotoxic to SH-SY5Y cells. DOI: https://doi.org/10.7554/eLife.46574.019
Table 2.Agreement between experimental and back-calculated intermolecular distances for different hexamer structures.
RMS values are shown comparing the measured versus the predicted distances from each structural model for distances measured from S33, L54 and S61. Data from position S20 were not used as they arise from non-specific interactions with MTSL. See alsoFigure 5—figure supplement 3.
PRE term
Hexamer 1 RMS (A˚)
Hexamer 2(i) RMS (A˚)
Hexamer 2(ii) RMS (A˚)
Hexamer 2(iii) RMS (A˚)
S33C(DN6)-DN6 2.34 2.68 2.58 2.53
L54C(DN6)-DN6 1.25 2.33 2.26 1.87
S61C(DN6)-DN6 2.22 2.7 2.68 3.11
surface area. Interestingly, the oligomerization of
DN6 has been linked to increased toxicity in Cae-norhabditis elegans models (Diomede et al., 2012). Since amyloid formation can proceed via multiple pathways, it is possible that the cytotoxic species of DN6 formed in the C. elegans body wall muscle are different to those formed here in vitro. For several proteins, cytotoxicity has been ascribed to off-pathway oligomers that accumu-late in the lag time of assembly, consistent with amyloid formation being protective for the cell (Bieschke et al., 2011). Interconversion between different forms of oligomers may also be required for cytotoxicity (Fusco et al., 2017; Cremades et al., 2012). Such a process could be compromised in the cross-linked species of DN6 used here.
In summary, by taking advantage of the power of NMR spectroscopy to visualize transient spe-cies, and combining these experiments with detailed analysis of the kinetic, thermodynamic and hydrodynamic properties of the aggregating ensemble of species, we have been able to deter-mine an atomic structural model of two oligo-meric species required for amyloid formation of
DN6 at pH 6.2, and have generated a model that describes a potential mechanism of fibril elonga-tion from these states. Our findings portray an assembly mechanism that is remarkably well-defined, involving the formation of specific protein-protein interfaces that are unique to the initiating stages of amyloid assembly. Substantial conformational changes have still to occur, however, for the hexameric intermediate to form the cross-b structure of amyloid. How this is achieved remains an open question, but could involve binding to the fibril ends and/or fibril surfaces. Most importantly, the results reveal a remarkable specificity to the early stages ofDN6 amyloid assembly that involves the formation of well-defined oligomeric species via specific interfaces, the precise details of which determine the course of assembly. These findings suggest new avenues to combat disease by spe-cific targeting of the early intermediates in the amyloid cascade which, at least forDN6, involve spe-cific interactions between non-native, assembly-competent states.
Video 2.DN6 assembles into dimers and hexamers.
The twoDN6 subunits in the dimer (dimer A) are shown as blue cartoon and gray cartoon/transparent space-filling representations, respectively. The BC, DE and FG loops are colored magenta, green and yellow, respectively. The intra-dimer interface residues are shown as sticks on one subunit and as orange transparent spheres on the second subunit. The hexamer assembly is then shown as a space-filling model, with dimer one shown in dark blue/light blue, dimer two in dark yellow/light yellow and dimer three in magenta/pink. In the last part of the video only dimer one is shown as spheres while dimers 2 and 3 are shown as transparent cartoons. The intra-dimer interface is shown in green and the inter-dimer interface is shown in red.
[image:15.612.166.365.53.168.2]DOI: https://doi.org/10.7554/eLife.46574.022
Table 3.Analysis of dimer and hexamer interfaces.
The buried surface area is calculated as the sum for the two subunits for each complex. Interface resi-dues were identified as those resiresi-dues that lose at least 10% of accessible surface area upon oligomer formation.
DN6 dimer A DN6 hexamer
Buried Surface Area (A˚2) 1233 4201
% Charged residues in the interface 28 18
% Hydrophobic residues in the interface 44 54
Figure 6.G-strand unfurling may occur upon hexamer formation.15N CPMG relaxation dispersion data at 750 MHz (magenta) and 950 MHz (red) (180
Materials and methods
Protein expression and purification
The pINK plasmid containing theDN6 gene was transformed into BL21 DE3 plysSE. colicells. 2 L flasks containing 1 L of LB or HDMI (1 g/L15N-NH
4Cl, 2 g/L 13C-glucose) media were inoculated
with 10 mL of starter culture. Cells were incubated at 37˚C, 200 rpm until they reached an OD600
of~0.6 and then the expression ofDN6 was induced by the addition of 1 mM isopropylb -D-1-thio-galactopyranoside (IPTG). Expression was allowed to continue overnight at 37˚C and cells were har-vested the next morning using a Heraeus continual action centrifuge at 15,000 rpm. The cell pellet containingDN6 as inclusion bodies was lysed by the addition of 50–100 mL buffer containing 100
mg/mL lysozyme, 50 mg/mL DNAse I, 50mg/mL phenylmethanesulfonyl fluoride (PMSF), 10 mM Tris HCl pH 8.2. Further cell disruption was performed using a constant cell disrupter system (Constant Systems) at a pressure of 20.0 kpsi. Inclusion bodies were isolated using centrifugation (15,000g) for 40 min, 4˚C and the inclusion body pellet was washed with 10 mM Tris HCl pH 8.2 four times.DN6 was then solubilized in 10–20 mM Tris HCl pH 8.2 containing 8 M urea (MP Biomedicals) and refolded by dialysis (3000 MW cutoff membrane) against 2–5 L of the same buffer lacking urea. The refolded protein was centrifuged for 30 min at 15,000gto pellet-insoluble material and the superna-tant was loaded onto a Q-Sepharose (GE Healthcare) column equilibrated with 20 mM Tris HCl pH 8.2. Bound protein was eluted with a gradient of 0–400 mM NaCl in the same buffer over 800 mL and the protein was freeze-dried after dialysis in 18 MWH2O or concentrated using 3000 MW cutoff
centrifugal concentrators (Sartorius). The freeze-dried protein was re-suspended in 10 mM sodium phosphate buffer pH 7.0, filtered through 0.2mm filters (Fisher Scientific) and gel filtered using a HiLoad Superdex-75 Prep column (Amersham Biosciences), calibrated with a standard gel filtration kit (GE Healthcare). The monomer peak was collected, concentrated, aliquoted and stored at 80˚C or dialyzed into 18 MWH2O and freeze-dried. Cys mutants ofDN6 were created as described in
ref-erence (Karamanos et al., 2014) and purified as above, except that 2 mM dithiothreitol (DTT) was added before gel filtration.
Aggregation assays
DN6 seeds were formed by incubation of 800mM protein in 10 mM sodium phosphate buffer, pH 6.2 containing 83.3 mM NaCl (to give a total ionic strength of 100 mM), 0.02% (w/v) NaN3with 200
rpm shaking on a thriller shaker (Peqlab) at 37˚C for 2 weeks. hb2m seeds were formed by incubation
of 800 mM protein (expressed and purified as described in Karamanos et al., 2014) in 10 mM sodium phosphate buffer pH 2.0, containing 50 mM NaCl, 0.02% (w/v) NaN3with 200 rpm shaking
at 37˚C for 2 weeks. The resulting fibrils were sonicated for 15 s to create fibril seeds. For seeding reactions, samples containing 50–500mM hb2m orDN6 in pH 2.0 or pH 6.2 buffers, respectively,
con-taining 10mM thioflavin T (ThT) were incubated quiescently at 37 ˚C in sealed 96 low binding well plates (Thermo Scientific). De novoDN6 fibrils were formed by incubating 60 mM DN6 in 10 mM sodium phosphate buffer, pH 6.2, containing 83.3 mM NaCl, 0.02% (w/v) NaN3with 600 rpm
shak-ing in a 96-well plate at 37˚C (lag time~20 hr) or in an 1.5 mL Eppendorf tube (lag time~100 hr). Control experiments monitoring seeded fibril growth ofDN6 at pH 8.2 were performed in 10 mM sodium phosphate buffer, pH 8.2 containing 86.6 mM NaCl (total ionic strength 100 mM, identical to that used at pH 6.2) and 0.02% (w/v) NaN3. Fluorescence was monitored at 480±10 nm after
excitation at 440±10 nm using a FLUOROstar Optima micro-plate reader (BMG Labtech).
Figure 6 continued
analysis of G strand dynamics is shown in spheres on the structure ofDN6 (blue cartoon, top right). Pro32 is shown as a magenta sphere. Solid lines represent global fits to the Bloch-McConnell equations (Materials and methods) for each cluster of residues. The extracted parameters of the global fit for the two processes (kexbindand kexG) are indicated above the plots.
DOI: https://doi.org/10.7554/eLife.46574.023
The following figure supplement is available for figure 6:
Figure supplement 1.Hexamer formation increases the dynamics of the G strand.
Analytical ultracentrifugation
For sedimentation velocity experiments, a sample of 450mL of protein was dialyzed overnight with 10 mM sodium phosphate buffer, pH 6.2 containing 83.3 mM NaCl or 10 mM sodium phosphate buffer, pH 8.2 containing 86.6 mM NaCl (each buffer has a total ionic strength of 100 mM). The sam-ple was inserted in double-sector Epon centerpieces equipped with sapphire windows and inserted in an An60 Ti four-cell rotor. Absorbance data at the appropriate wavelength were acquired at a rotor speed of 48,000 rpm at 25˚C. Data were analyzed using the c(s) continuous distribution of the Lamm equations with the software SEDFIT (Brown and Schuck, 2006),
DðsÞ ¼ ffiffiffi 2 p
18kTs
1=2
ðhðf=f0ÞwÞ 3=2
ðð1 vrÞ=vÞ1=2;
whereD(s) is the diffusion coefficient,kBoltzmann’s constant,Tthe temperature in K,sthe sedimen-tation coefficient,fthe frictional coefficient,f0the frictional coefficient of a compact smooth sphere,
hthe solvent viscosity,the solvent density and the partial specific volume.
[image:18.612.41.577.80.465.2]At concentrations over 200mM 20% of the material sedimented during the initial 3000 rpm run, consistent with the hexamers forming high-molecular-weight species that sediment before the c(S) data are acquired.
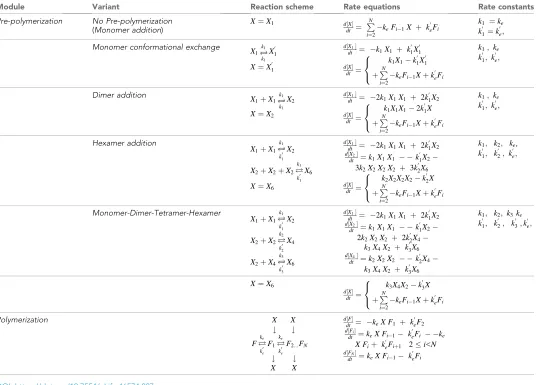
Table 4.Reaction schemes, rate equations and rate constants for the fibril elongation models tested.
Xrepresents the species that add onto the fibril ends.
Module Variant Reaction scheme Rate equations Rate constants
Pre-polymerization No Pre-polymerization (Monomer addition)
X¼X1 d X½
dt ¼
P
N
i¼2
keFi 1X þ k 0
eFi
k1 ¼ke
k01¼k 0
e;
Monomer conformational exchange X
1
k1
!k1X10
X¼X10
d X1½
dt ¼ k1X1 þ k 0 1X
0 1
d½X dt ¼
k1X1 k 0 1X 0 1 þP N
i¼2
keFi 1Xþk 0
eFi
8 <
:
k1; ke
k01; k 0
e;
Dimer addition X
1þX1
k1
!k1X2
X¼X2
d X1½
dt ¼ 2k1X1X1 þ 2k 0 1X2
d½X dt ¼
k1X1X1 2k 0 1X
þP
N
i¼2
keFi 1Xþk 0
eFi
8 <
:
k1; ke
k01; k 0
e;
Hexamer addition
X1þX1
k01
!k1X2
X2þX2þX2
k10
!k1X6
X¼X6
d X1½
dt ¼ 2k1X1X1 þ 2k 0 1X2
d X2½
dt ¼k1X1X1 k
0 1X2
3k2X2X2X2 þ 3k 0 2X6
d½X dt ¼
k2X2X2X2 k 0 2X
þP
N
i¼2
keFi 1Xþk 0
eFi
8 <
:
k1; k2; ke,
k01; k 0 2; k
0
e;
Monomer-Dimer-Tetramer-Hexamer
X1þX1
k01
!k1X2
X2þX2
k02
!k2X4
X2þX4
k03
!k3X6
d X1½
dt ¼ 2k1X1X1 þ 2k
0 1X2
d X2½
dt ¼k1X1X1 k 0 1X2
2k2X2X2 þ 2k 0 2X4
k3X4X2 þ k30X6
d X4½
dt ¼k2X2X2 k
0 2X4
k3X4X2 þ k30X6
k1; k2; k3ke
k01; k 0
2; k
0 3;k
0
e;
X¼X6
d½X dt ¼
k3X4X2 k 0 3X
þP
N
i¼2
keFi 1Xþk0eFi
8 <
:
Polymerization X X
# #
F k0e
!keF1
k0e
!keF2:::FN
# #
X X
d F½
dt ¼ keX F1 þ k 0
eF2
d F½ i
dt ¼keX Fi 1 k
0
eFi ke X Fiþ k0eFiþ1 2i<N
d F½N
dt ¼keX Fi 1 k
0
eFi
Figure 7.The monomer-dimer-hexamer model describes the thermodynamics and kinetics of fibril elongation. (a) Global fits (blue solid lines) to the fibril elongation kinetics monitored by ThT fluorescence assuming a hexamer addition model at different concentrations of solubleDN6 (dots) (Materials and methods andTable 4). The concentrations ofDN6 are colored according to the key. The average of five replicates is shown. (b) Protein correlation times (tc) measured using NMR (red) and back-calculated values (green) using the populations of monomers, dimers and hexamers predicted from the monomer-dimer-hexamer model and the correlation times of the dimers and hexamer structural models shown inFigures 4and 5. (c) The fibril yield (after 100 hr) of each elongation reaction. SDS-PAGE analysis of the whole reaction (shown in (a)) before centrifugation (W) or of the supernatant (S/N) after centrifugation at the different concentrations ofDN6, as indicated. (d) Bar-charts showing the % of insoluble material (gray) measured using densitometry of the gel shown in (c). The % hexamer population in the absence of seeds (black) predicted by the monomer-dimer-hexamer model at eachDN6 concentration correlates with the % insoluble material (gray). Note that the fibril yield is low since fibrils cannot form when the monomer concentration falls significantly below the Kdfor dimer formation (50mM).
DOI: https://doi.org/10.7554/eLife.46574.025
The following figure supplement is available for figure 7:
Chemical cross-linking and analytical SEC
DN6 (10mM - 500mM) was incubated at room temperature without shaking in 10 mM sodium phos-phate buffer, pH 6.2 containing 83.3 mM NaCl (total ionic strength of 100 mM), 0.02% (w/v) NaN3
[image:20.612.42.574.61.374.2]overnight. A 100-fold molar excess of 1-ethyl-3-(3-dimethylaminopropyl)-carbodiimide hydrochloride (EDC) (final concentration 1 mM - 50 mM) was added to the reaction, incubated for 10 min with gen-tle mixing, followed by the addition of 5 mM sulpho-N-hydroxysuccinimide (NHS) for 5 min at room temperature. Cross-linking was then quenched by the addition of 10-fold molar excess (over the con-centration of EDC) of Tris HCl pH 8.0, or for cellular cytotoxicity assays, Dulbecco’s PBS, and sam-ples were then analyzed immediately using an analytical Superdex S75 10/300 GL column (GE Healthcare) equilibrated with the same buffer. A similar protocol was used to cross-linkDN6 during de novo fibril formation. A 500mL volume of 80mMDN6 in 10 mM sodium phosphate buffer, pH 6.2
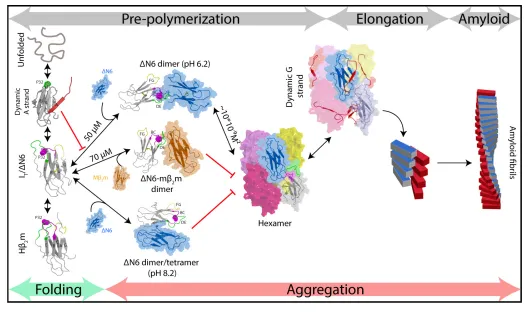
Figure 8.Fibril formation in atomic detail. Schematic representation of the mechanism of amyloid formation forDN6. During folding of hb2m, a highly dynamic intermediate with a flexible A strand is populated prior to formation of the native-like intermediate termed IT, which has a native-like fold but contains a non-nativetransX-Pro32 bond. The latter species is mimicked byDN6 and formed in vivo by proteolytic degradation of the WT protein (Bellotti et al., 1998). Only IT/DN6 is primed for aggregation, while the intermediate with the flexible A strand is not able to assembly directly into amyloid (Karamanos et al., 2016). As reported here,DN6 forms elongated head-to-head dimers (upper image, center) which assemble into hexamers. Alternative dimers involving interactions between the ABEDb-sheets in adjacent molecules formed at pH 8.2 (lower image, center) do not associate further into fibrils. Murineb2m (mb2m) also interacts withDN6 at pH 6.2 to form head-to-head heterodimers. The subunit orientation is different in this heterodimer (Karamanos et al., 2014), occluding the hexamer interface and inhibiting assembly (central image).DN6 hexamers can elongate fibrillar seeds and show enhanced dynamics in the G strand which could represent the first step towards the major structural reorganization required to form the parallel in-register amyloid fold. How this final step occurs, however, remains to be solved.
DOI: https://doi.org/10.7554/eLife.46574.028
The following figure supplements are available for figure 8:
Figure supplement 1.A workflow to enable weakly self-assembling systems to be analyzed in structural, kinetic and thermodynamic detail. DOI: https://doi.org/10.7554/eLife.46574.029
containing 83.3 mM NaCl, 0.02% (w/v) NaN3was incubated in a 1.5 mL micro-centrifuge tube at 37˚
C with 600 rpm vigorous shaking on a thriller shaker. Under these conditions, the lag time is~100 hr instead of~20 hr when the protein is incubated in a 96-well plate (Figure 2bandFigure 3—figure supplement 1a). Samples were cross-linked at various time-points during assembly by addition of 8 mM EDC, incubated for 15 min, followed by addition of 5 mM NHS, also incubated at room temper-ature for 15 min. The cross-linking reaction was quenched by addition of 200 mM ammonium ace-tate before samples were subjected to analysis by SDS-PAGE. Given the unavoidable dilution of the samples and their re-equilibration during the SEC run, quantitative analysis of the SEC traces of cross-linked and uncross-linked samples was not performed.
Measurement of
D
N6 correlation times
Rotational correlation times (tc) ofDN6 at different concentrations were measured in 10 mM sodium
phosphate buffer pH 6.2 containing 83.3 mM NaCl, or the same buffer at pH 8.2 containing 86.6 mM NaCl (total ionic strength for each sample of 100 mM), 25˚C using a 1H-TRACT experiment (Lee et al., 2006) with delays of 0.002–0.064 s in a Varian Inova NMR spectrometer operating at 750 MHz. At each delay, the signal intensity of resonances in the amide region was integrated and the resulting curve fitted to a single exponential decay function in order to calculate the relaxation rates of the TROSY (Ra) and anti-TROSY (Rb) spins. The difference Rb- Rawas then converted to the
corre-lation time (Lee et al., 2006). Errors were calculated using duplicate measurements.
Diffusion NMR measurements on
D
N6
Diffusion NMR experiments were performed on DN6 samples at different concentrations using pulsed field gradient (PFG) NMR spectroscopy using stimulated echoes with bipolar gradients per-formed on a Bruker Avance III 750 MHz spectrometer. A series of 1H spectra were collected as a function of gradient strength (g), the signal (S) was integrated and fitted to:
S=S0¼exp dg 2
where S0 is the signal intensity at zero field gradient, d is the observed decay rate and g is the strength of the field gradient pulses. The decay rate (d) is directly proportional to the diffusion coef-ficient,D,of the protein (Stejskal and Tanner, 1965).
Chemical shift perturbation and calculation of K
dvalues
1
H-15N TROSY spectra of DN6 at different concentrations were collected using a 750 MHz Bruker Avance III spectrometer. The combined1H and 15N chemical shift difference was calculated using
the function:
Dd¼
ffiffiffiffiffiffiffiffiffiffiffiffiffiffiffiffiffiffiffiffiffiffiffiffiffiffiffiffiffiffiffiffiffiffiffiffiffiffiffiffiffi 5d1
H2 þ d15
N2 q
Chemical shift data at 10mM, 20mM, 100mM, 200mM and 410mMDN6 were fitted to a mono-mer (X1) - dimer (X2) – hexamer (X6) model:
X1þX1 k01
!k1X2þX2þX2 k02
!k2X6
The equilibrium concentration of hexamer [X6] was calculated by numerical integration of the
above model using scripts written in Python and converted to fractional saturation. The observed chemical shift (Dd) is then given by:
Dd¼ Bmax6½ X6 X1 ½
whereBmaxis the maximum chemical shift difference. To obtain estimates for the monomer-mono-mer and dimonomer-mono-mer-hexamonomer-mono-mer Kds a grid search was performed by fixing the dimer Kd(k’1/k1) and the
hexamer Kd(k’2/k2) to different values (Figure 2—figure supplement 2d). Excellent fits were
pro-duced using a dimer Kd <~50 mM, while the hexamer Kd shows a narrow distribution centered
the estimation of the dimer Kd, RDC experiments were performed as a function ofDN6
concentra-tion (Figure 2—figure supplement 2e).DN6 was aligned in 10 mg/mL of PF1 phage (Asla Scientific) and HNRDCs were measured using ARTSY (Fitzkee and Bax, 2010). The biphasic behavior of the
RDCs suggests a three-state equilibrium in agreement with the monomer-dimer-hexamer model. The first/second transition at lower protein concentration (blue/pink dashed line inFigure 2—figure supplement 2e) presumably reports on the monomer-dimer/dimer-hexamer equilibrium, respec-tively. In order to extract RDCs of the dimer species the blue dashed line was extrapolated to 100% dimer using various Kdvalues. The resulting data were fitted to the structure ofDN6 in order to
cal-culate the alignment tensor of the dimer. Using a Kdgreater than 50mM results in a decrease in the
goodness of the fit (Figure 2—figure supplement 2f), unless a large conformational change in the monomer is invoked upon dimer formation. However, based on the chemical shift data shown in Fig-ure 2—figFig-ure supplement 2a,c DN6 remains native-like across all concentrations, thus placing an upper limit of the dimer Kdat~50mM in agreement with the grid search of the chemical shift data
(Figure 2—figure supplement 2d). Note that the calculated tensor depends highly on the correct RDC values and therefore RDCs were not used in the structure calculations described below. Chemi-cal shift perturbations for 10 residues that show significant chemiChemi-cal shift perturbations (11, 12, 23, 26, 50, 51, 52, 67, 68, 97) were fitted globally to this model, with representative examples shown in Figure 2—figure supplement 2b. Errors on the measured peak positions were calculated as the standard deviation of the mean for residues that show insignificant chemical shift changes. Errors on the fitted parameters were computed using Monte Carlo calculations with 100 steps.
To calculate populations of different species, a monomer-dimer-hexamer model was treated numerically, that is the kinetic equations that describe the time-evolution of the concentration of each species were integrated tot=¥, after equilibrium was reached, yielding the equilibrium
concen-tration (in molar units) of monomers, dimers and hexamers. Since the dimers consist of two mono-mers and hexamono-mers of six monomono-mers, these concentrations are then converted to populations (of monomers in the form of dimer or hexamer) using the relationship:
pn¼ n An½ Mtot
½
where n is the oligomer order, [An] the equilibrium concentration of the oligomeric state and [Mtot]
the total protein concentration. The overall rate of assembly,kover
on , for this three-state model is given by:
koveron ¼ k1appk
app 2 k 1k
app 2
;
where
k1app¼2k1½Meq k2app¼3k2½Deq
2
And therefore:
konover¼ kapp1 k
app 2 k 1k
app 2
¼6k1k2½Meq½Deq 2
k 1þ3k2½Deq 2
The overallkoveron rate of assembly and therefore the total population of oligomers scales linearly as a function of the monomer concentration (see inset in Figure 2-Supplement 1f).
PRE experiments
TheDN6 variants (14N-labeled) S20C, S33C, L54C and S61C (1–2 mg/mL) were incubated with 5 mM
N6 (10mM 80mM) was mixed with15N-labeledDN6 (60mM 240mM) and the difference of the1H
R2rates between oxidized and reduced (the latter created by addition of 1 mM ascorbic acid)
MTSL-labelled14N-DN6 was measured. Experiments were performed in 10 mM sodium phosphate buffer, pH 6.2 containing 83.3 mM NaCl or 10 mM sodium phosphate buffer, pH 8.2 containing 86.6 mM NaCl (a total ionic strength of 100 mM at each pH value). Data were recorded at 25˚C using a
1
H-15N correlation based pulse sequence with 5 or 6 time-points (0.0016–0.016 s) (Clore and Iwa-hara, 2009) and at least 32 scans per incremental delay, utilizing a Bruker Avance III 750MHz spec-trometer equipped with a cryogenic probe. R2rates were extracted by fitting the relaxation data to
single exponentials using in-house scripts. The HN-G2 rate was then calculated as the difference
between the R2rate in the paramagnetic (R2, para) versus diamagnetic (R2, dia) sample:
G2¼R2;para R2;dia
Errors were calculated based on the noise of the experiment. The small PRE signal observed whenDN6 is modified with MTSL at position 20 can be attributed to non-specific binding of the spin label itself to adjacent protein molecules, since addition of free MTSL resulted in a similar PRE profile (not shown). Thus, data arising from spin-labeledDN6 at position 20 were not included in quantita-tive analysis of the PRE experiments.
15
N transverse relaxation dispersion CPMG experiments
15N transverse relaxation dispersion CPMG experiments were performed as described in reference
(Loria et al., 1999) using samples dissolved in 10 mM sodium phosphate buffer containing 83.3 or 86.6 mM NaCl to maintain a constant ionic strength of 100 mM at pH 6.2 and 8.2, respectively. Spectra were acquired using a Varian Inova 500 MHz spectrometer using a fixed relaxation delay (tcpmg) of 48 ms or a Bruker Avance III 750 MHz or 950 MHz spectrometer using a delay of 40 ms.
Spectra were processed using NMRPipe (Delaglio et al., 1995) and R2,eff rates were calculated using:
R2;eff¼ Ix I0
tCPMG
whereIxis the peak intensity in each experiment andI0is the peak intensity in the reference spec-trum (with CPMG train applied). CPMG data from two clusters of residues, one reporting on inter-molecular interactions (12 residues) and the second reporting on the dynamics of the G strand (four residues) (see text) were fitted globally to the Bloch-McConnell equations (McConnell, 1958) describing a two-state exchanging system using the software package ‘relax’ (Morin et al., 2014). The fact that dimer and hexamer interfaces partly overlap, complicates the analysis of the CPMG data at pH 6.2. However, at the concentrations used, where either hexamerization is low (180mM: 26% monomer, 48% DN6 molecules as dimer, 26% DN6 molecules as hexamer) or dimerization remains constant (480mM: 13% monomer, 32%DN6 molecules as dimer, 55%DN6 molecules as hex-amer) good quality fits to a simple two-state model were obtained. The calculated exchange param-eters report on both dimer and hexamer formation. Due to this ambiguity, the apparent exchange rates obtained by fitting the CPMG data were not used in the kinetic modeling of the reaction, but used instead to report on the apparent differences in exchange dynamics of different residues as hexamer formation is enhanced.
Calculation of structural models
Structural models of dimers
Simulated annealing calculations were carried out in XPLOR-NIH (Schwieters et al., 2003). To account for the flexibility of the MTSL moiety, the paramagnetic group was represented as a five-membered ensemble. The computational strategy employed included three PRE potential terms (arising from S61C-DN6, L54C-DN6 and S33C-DN6) and classic geometry restraints to restrict devia-tion from bond lengths, angles and dihedral angles. Resonances for which an estimadevia-tion of the R2