Int. J. Electrochem. Sci., 11 (2016) 8730 – 8737, doi: 10.20964/2016.10.63
International Journal of
ELECTROCHEMICAL
SCIENCE
www.electrochemsci.orgSensitive and Selective Determination of Uric Acid Using
Polyaniline and Iron Composite Film Modified Electrode
Mani Govindasamy1, Veerappan Mani1, Shen-Ming Chen1,*, Anandaraj Sathiyan2, Johnson Princy Merlin2, Vinoth Kumar Ponnusamy3
1
Department of Chemical Engineering and Biotechnology, National Taipei University of Technology, Taipei, Taiwan (ROC)
2
Department of Chemistry, Bishop Heber College (Autonomous), Tiruchirappalli-620 017, Tamil Nadu, India
3
Department of Medicinal and Applied Chemistry, Kaohsiung Medical University, Kaohsiung City-807, Taiwan.
*
E-mail: [email protected]
Received: 31 June 2016 / Accepted: 29 August 2016 / Published: 6 September 2016
We demonstrated a simple and low-cost composite composed of polyaniline and iron composite (PANI-Fe) for the determination uric acid (UA). The successful composite formation was confirmed through scanning electron microscopy, electrochemical impedance spectroscopy and electrochemical methods. The PANI-Fe composite was used to modify the surface of glassy carbon electrode (GCE) and the resulting modified electrode (PANI-Fe/GC) displayed good electrocatalytic activity to the oxidation of UA. The kinetics of the electrocatalysis and effect of scan rate were investigated. The amperometric sensor was developed based on PANI-Fe film modified electrode which delivered quick and sensitive responses to UA. The linear range is 0.05–3860 µM, detection limit is 21.5 nM, and sensitivity is 0.2981 µAµM–1 cm–2. The electrode is highly selective for UA detection. Besides, the electrode has good repeatability and reproducibility. The real-time applicability is verified in human urine samples which displayed recoveries in acceptable range.
Keywords: Conducting polymers, metals, electrocatalysis, electrochemical sensors, metabolite, Uric acid
1. INTRODUCTION
concentrations of UA in biological fluids (blood and urine) are symptoms of several important diseases including hyperuricemia, gout, Lesch-Nyan disease etc., [4, 5] A high level of UA in the blood led to hyperuricemia and cardiovascular diseases [6]. Therefore, it is vital to develop simple and robust sensing methods for the routine analysis of UA in patients suffering from altered purine metabolism related disorders. Usually, UA, dopamine (DA) and ascorbic acid (AA) are coexisted in the extracellular body fluids, but they are biomarkers for different diseases [7, 8]. The concentration of DA (in micromolar level) is comparatively lower than that of AA (in millimolar level) in body fluids and hence the determination of UA usually encountering interference from AA rather than DA [9, 10]. Although traditional analytical methods can be used for the determination of UA, electrochemical methods are most preferable due to their simplicity, low-cost, easy-handling, rapid response time, portability and low power consuming [11]. All these three metabolites are electrochemically active and hence they are suitable for electroanalytical determinations. At conventional electrodes, all the three biomarkers are oxidized at similar oxidation potential and the voltammetric peaks usually overlap and hence difficult to determine them selectively [12]. Besides, the conventional electrodes are poor in selectivity and have low reproducibility. Therefore, rationally designed modified electrodes were developed in the past years in order to eliminate AA interference. The detection approaches are either selective detection of UA or simultaneous determination of DA, UA and AA at different voltammetric channels. So far, several modified electrodes were developed for UA determination which are includes, electrochemically pretreated carbon paste electrodes [13], well-aligned carbon nanotubes [14], preanodized clay [1], electrochemically anodized diamond film [3], methylene blue in a methyltrimethoxysilane sol-gel ceramic film [15], ordered mesoporous carbon functionalized with ferrocenecarboxylic acid-modified electrode [16], β-cyclodextrin modified copolymer of sulfanilic acid and N-acetylaniline [17], electrochemically treated pencil graphite electrodes [18], Electrochemically polymerized luminol film [19], nitrogen doped graphene [20], graphene/size-selected Pt nanocomposites [21] etc., Herein, we have prepared rod shaped iron particles decorated polyaniline composite (PANI/Fe) for the sensitive determination of UA. The composite is prepared through a straightforward solution-assisted method using cheaper precursors. The composite is suitable electrode material for the determination of UA present in human urine and serum samples.
2. EXPERIMENTAL
2.1 Chemicals and Apparatus
Aniline, and Iron (III) chloride (FeCl3) were purchased from Merck. All the other reagents
were purchased from Sigma-Aldrich. Double distilled water was used for all the experiments. 0.1 M phosphate buffer (pH 7.0) was prepared from sodium dihydrogen phosphate and disodium hydrogen phosphate and used as supporting electrolyte.
wire as counter electrode. The scanning electron microscopic (SEM) images were acquired using Hitachi S-3000 H scanning electron microscope and electrochemical impedance spectroscopy (EIS) analysis were performed using EIM6ex Zahner (Kronach, Germany).
2.2 Preparation of PANI/AC/GCE
5 mM CTAB solution was prepared in 0.5 M H2SO4. 40 mM aniline solution was added to the
CTAB solution and the mixture was stirred using magnetic stirrer for 30 min. 50 mL of a solution 0.05M FeCl3 was added drop-wise to the previous solution, continued stirring for 30 min and the
temperature was maintained below 0°C. Afterwards, a pre-cooled solution of 50 mM PDS was added in dropwise to aniline solution with stirring over a period of 30 min. A dark green precipitate was formed which was filtered and washed several times with water and acetone, respectively. The purified PANI/Fe composite was dried and redispersed in ethanol (1mg mL-1). Next, the surface of the GCE was polished with alumina slurry using a Buehler polishing kit. The polished GCE surface was then washed with water and dried in air-oven. 5 μl dispersion of PANI/Fe was dropped on the cleaned GCE surface and dried.
3. RESULTS AND DISCUSSIONS
3.1 Characterization of PANI-Fe/GCE
The SEM of PANI-Fe portrayed with the presence of fibers of PANI and numerous Fe metal particles (Fig. 1A and 1B). Besides, the composite featured with several cavities and catalytic sites. The morphology indicating that the composite can have high surface area which can be highly beneficial for electrochemical sensing applications.
Figure 1. (A, B) FESEM images of PANI-Fe composite. (C) EIS curves of bare GCE (a), Fe/GCE (b), PANI/GCE (c) and PANI-Fe/GCE (d).
[image:3.596.58.541.539.661.2]
fit the experimental data and the EIS measurements were represented as Nyquist plots. The diameters of the semicircle portion of the curves were in the order of bare GCE > PANI/GCE > Fe/GCE > PANI-Fe/GCE. The Rct values of bare GCE, Fe/GCE, PANI/GCE, PANI-Fe/GCE are 361 Ω, 197 Ω, 108 Ω
and 22 Ω respectively. The Rct value obtained at PANI-Fe/GCE is 16, 9 and 5 times smaller than the
bare GCE, Fe/GCE and PANI/GCE, respectively. Thus, PANI-Fe/GCE has the lowest electrode resistance over control electrodes.
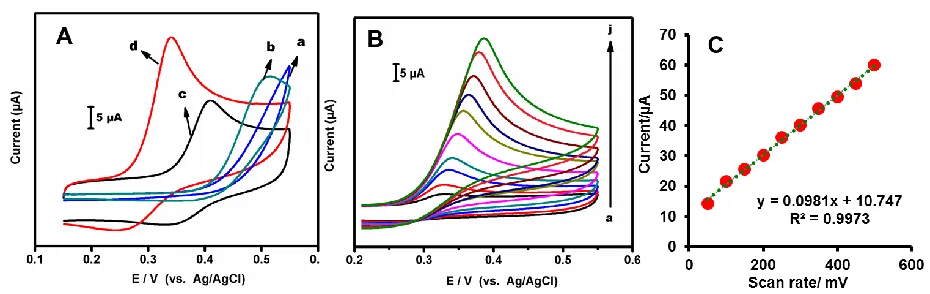
Figure 2. (A) CVs obtained at bare GCE (a), PANI/GCE (b) and Fe/GCE (c) and PANI-Fe/GCE in phosphate buffer (pH 7.0) containing 3 µM UA. Scan rate = 50 mV s–1. (B) Effect of the scan rate: Cyclic voltammograms responses of PANI-Fe/GCE towards 3 µM UA at different applied scan rates from 50 to 500 mV s−1 (a=50, b=100, c=150, d=200, e=250, f=300, g=350, h=400, i=450 and j=500 mV s–1. (C) Plot between scan rate (mV) and UA oxidation peak current (µA).
3.2 Electrocatalysis of UA
[image:4.596.63.528.206.353.2]
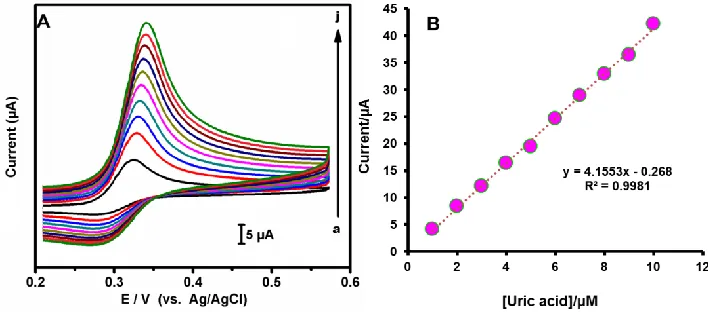
Figure 3. (A) CVs obtained at PANI–Fe/GCE in phosphate buffer (pH 7.0) containing different concentrations of UA (1.0, 2.0, 3.0, 4.0, 5.0, 6.0, 7.0, 8.0, 9.0, and 10.0 µM). (B) Plot between [UA] (µM) vs. response current (µA).
[image:5.596.118.472.73.229.2]3.3 Determination of UA: voltammetry and amperometry
Table 1. Comparison of analytical parameters for the determination of UA at PANI–Fe composite film modified electrode with reported works
Electrode Linear
range/µM
Detection limit/µM
Ref.
PtAu hybrid film 20–336 0.015 [9]
f-MWCNTs/poly(neutral red) composite 0.05–30 0.015 [10]
MWCNTs 15.9-333.3 1.65 [19]
Tryptophan/gold nanoparticles/polyimidazole 6.0–486 0.5 [20]
Tryptophan/Graphene 10–1000 1.24 [21]
Pt/reduced graphene oxide 10.0-130.0 0.25 [22]
Recessed Au nanoelectrode 20–170 6.4 [23]
Au-Pd/ nanoporous stainless steel 100.0– 1200 15 [24]
hierarchical nanoporous PtTi 100-1000 5.3 [25]
PANI–Fe 0.05–3860 21.5 This work
[image:5.596.65.528.388.655.2]
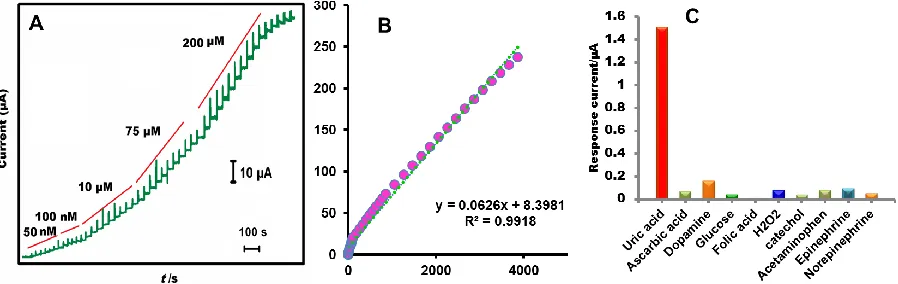
amperometric method. Fig. 4A displays the amperometric i-t curves obtained at PANI–Fe/GCE for sequential additions of UA into phosphate buffer (pH 7). The applied potential was + 0.32 V and electrode rotation speed was 1500 RPM. For each addition, a sharp rise in current is observed and the amperometric response current reached 95% steady-state current within 5s of UA injection. Thus, the PANI–Fe composite film showed fast and sensitive responses to each addition of UA. The concentration dependent linear plot exhibited linearity and the slope was 0.0626 µA µM–1 (Fig. 4B). The response was linear in wide concentration range of 0.05–3860 µM with sensitivity of 0.2981 µAµM–1 cm–2. The limit of detection (LOD) was calculated to be 21.5 nM. The important parameters of sensor, such as LOD and linear range were comparable with previously modified electrodes along with the advantage of none-expensive electrode fabrication and rapid analysis [9, 10, 19].
Figure 4. (A) Amperometric response obtained at PANI–Fe composite film modified electrode towards each sequential additions of UA into phosphate buffer (pH 7). The rotation speed = 1500 RPM and electrode potential = + 0.32V. (B) [UA]/µM vs. response current (µA). (C) Selectivity study: plot of response current versus UA and interferents.
3.4 Selectivity and real-time application
Selectivity of the PANI–Fe composite film modified electrode to detect UA in presence of possible interferents has been investigated. The electrocatalytic response of the electrode towards 100 μM of UA and interferents were studied and the results were given as plot in fig. 4B. As given in the plot, the PANI–Fe composite film modified electrode delivered excellent amperometric response to UA, but negligible responses to all the other analytes added. These experimental results revealed that the electrode has good selectivity to detect UA in presence of possible interferents. Therefore, the described modified electrode is a suitable candidate for the determination of UA in real samples.
[image:6.596.75.524.280.422.2]
Table 2. Determination of UA in real samples using PANI–Fe composite
Real samples Added/nM Found/nM Recovery/% *RSD/%
Human serum 200 197.1 98.55 4.06
500 492.3 98.46 3.79
Urine sample 200 196.5 98.25 3.19
500 493.9 98.78 3.41
* Related standard deviation (RSD) of 3 independent experiments
For human urine sample, the PANI–Fe composite film modified electrode delivers quick and sensitive amperometric signals. The added, found and recovery values are estimated and presented in Table 2. From the table, we understood that the electrode sensitivity detects UA in real samples with satisfactory range of recoveries. Consequently, the composite is proved to be having good practical utility and it can be used for the real-time UA determination in clinical analysis.
3.5 repeatability, reproducibility and stability
Repeatability of the electrode was evaluated by performing five repeatitive measurements using indivdually prepared PANI–Fe composite film modified electrodes. The sensing ability of these electrodes were tested towards 10 µM UA. The PANI–Fe composite exhibits satisfactory repeatability with RSD of 3.85%. Similarly, reproducibility of the film was evaluated for five independent measurments (towards 10 µM UA) executed using five different modified electrodes. The electrode exhibits acceptable reproducibility with RSD of 3.92% for the determination UA. In order to determine stability of the PANI–Fe composite/GCE, its electrocatalytic response towards 10 µM UA was monitored every day. The electrode was kept stored in phosphate buffer (pH 7) at 4°C when not in use. During two weeks of storage period, 91.75% of its initial response currents towards UA was reappeared which indicates the excellent storage stability of the film.
4. CONCLUSIONS
repeatability and reproducibility. The real sample studies revealed the promising practical applicability of the described nanocomposite in clinical diagnosis of UA.
ACKNOWLEDGEMENTS
This work was supported by the Ministry of Science and Technology, Taiwan.
References
1. J.M. Zen, P.J. Chen, Anal. Chem. 69 (1997) 5087.
2. C.-L. Sun, C.-T. Chang, H.-H. Lee, J. Zhou, J. Wang, T.-K. Sham, ACS nano, 5 (2011) 7788. 3. E. Popa, Y. Kubota, D.A. Tryk, A. Fujishima, Anal. Chem. 72 (2000) 1724.
4. M. Chao, X. Ma, X. Li, Int. J. Electrochem. Sci. 7 (2012) 2201.
5. D. Ivekovic, M. Japec, M. Solar, N. Živkovic, Int. J. Electrochem. Sci. 7 (2012) 3252. 6. H. Zhou, W. Wang, P. Li, Y. Yu, L. Lu, Int. J. Electrochem. Sci. 11 (2016) 5197.
7. M. Pandurangachar, B.K. Swamy, U. Chandra, O. Gilbert, B. Sherigara, Int. J. Electrochem. Sci. 4 (2009) 672.
8. Y.J. Yang, L. Guo, W. Zhang, J. Electroanal. Chem. 768 (2016) 102. 9. S. Thiagarajan, S.-M. Chen, Talanta, 74 (2007) 212.
10. U. Yogeswaran, S.-M. Chen, Electrochim. Acta 52 (2007) 5985.
11. A.J. Bard, L.R. Faulkner, Electrochemical methods: fundamentals and applications: Wiley New York; 1980.
12. K. Pramoda, K. Moses, U. Maitra, C. Rao, Electroanalysis, 27 (2015) 1892. 13. X. Cai, K. Kalcher, C. Neuhold, B. Ogorevc, Talanta, 41(1994) 407.
14. J.S. Ye, Y. Wen, W. De Zhang, L.M. Gan, G.Q. Xu, F.S. Sheu, Electroanalysis, 15 (2003) 1693. 15. S.B. Khoo, F. Chen, Anal. Chem. 74 (2002) 5734.
16. J.C. Ndamanisha, L. Guo, Biosens. Bioelectron. 23 (2008) 1680.
17. S. Wu, T. Wang, Z. Gao, H. Xu, B. Zhou, C. Wang, Biosens. Bioelectron. 23 (2008) 1776. 18. A. Özcan, Y. Şahin, Biosens. Bioelectron. 25 (2010) 2497.
19. S.A. Kumar, H.W. Cheng, S.M. Chen, Electroanalysis, 21 (2009) 2281.
20. Z.-H. Sheng, X.-Q. Zheng, J.-Y. Xu, W.-J. Bao, F.-B. Wang, X.-H. Xia, Biosens. Bioelectron. 34 (2012) 125.
21. C.-L. Sun, H.-H. Lee, J.-M. Yang, C.-C. Wu, Biosens. Bioelectron. 26 (2011) 3450.
22. C. Wang, R. Yuan, Y. Chai, S. Chen, F. Hu, M. Zhang, Analytica Chimica Acta, 741 (2012) 15– 20.
23. Q. Lian, Z. He, Q. He, A. Luo, K. Yan, D. Zhang, X. Lu, X. Zhou, Anal. Chim. Acta 823 (2014) 32–39.
24. T. Xua, Q. Zhanga, J. Zhengb, Z. Lvb, J. Weia, A. Wangb, J. Fengb, Electrochim. Acta , 115 (2014) 109– 115.
25. Y. Zhanga, Q. Zhoua, W. Zhaoa, W. Chua, J. Zhenga, Electrochim. Acta 212 (2016) 25–31. 26. B. Rezaei, L. Ghahfarokhi, E. Havakeshian, A. Ensafi, Talanta 158 (2016)42–50.
27. D. Zhaoa, G. Yub, K. Tiana, C. Xu, Biosens. Bioelectron, 82 (2016) 119–126.