Using Performance Measurement to drive
Continuous Improvement
Umit S. Bititci and Sai S. Nudurupati Centre for Strategic Manufacturing, DMEM
University of Strathclyde, Glasgow
1.0 Introduction
The performance measurement revolution started in the late 1970s and early 1980s with the dissatisfaction of traditional backward looking accounting systems. Since then, there has been constant development in this field. If we look back and see “What is Performance Measurement?” According to Neely et al (1995), Performance Measurement is the process of quantifying effectiveness and efficiency of actions. What is the purpose of Performance Measurement? Its purpose is to monitor and improve the performance of these actions on a continuous basis. In other words, Performance Measurement is a continuous improvement tool.
In most organisations continuous improvement is a buzzword, but what is continuous improvement? How can it be achieved? Continuous improvement to the investors is to improve financial results, to the senior management it is to improve the business results, to the middle management it is to improve the processes, and to the operational staff it is to improve the activities and functions in which they are involved. In order to achieve all of these objectives (and hence achieve continuous improvement), the performance measurement system should assistin:
٭ Identifying key areas that need improvement
٭ Diagnosing and analysing the reasons behind low performance
٭ Planning and implementing changes necessary to improve performance in a quantifiable or measurable way
٭ Monitoring the results to find whether they achieved the expected results ٭ Developing a closed-loop control system to promote continuous improvement
2.0 Performance Measurement Systems
Although there are several frameworks and models for performance measurement, Balanced Scorecard is a widely accepted model. It is a set of measures that gives top managers a comprehensive and balanced view of the business by including financial measures, customer satisfaction measures, internal process measures and innovation and improvement measures (Kaplan and Norton, 1992 & 1996). Although it was developed originally in the early 90s, since then it has evolved considerably.
3.0 Role of Performance Measurement in Continuous Improvement
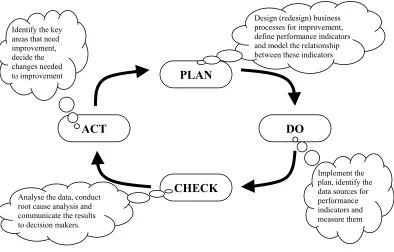
Although many people make decisions intuitively (based on experience) in finding the key areas of improvement for their business, it is not always easy and accurate. There is a need for a systematic closed-loop approach that promotes improvement on a continuous basis. Deming proposed that business processes should be analysed and measured to identify the sources of variations that cause processes to deviate from customer requirements. Deming also recommended that the closed-loop control system should be used by managers to continuously monitor the performance of processes (business and manufacturing) to identify and change the parts of the process that need improvements. In Figure 1, Deming’s PDCA cycle for continuous improvement is illustrated together with its performance measurement implications.
PLAN
Design (redesign) business processes for improvement, define performance indicators and model the relationship between these indicators
ACT
CHECK Analyse the data, conduct
root cause analysis and communicate the results to decision makers. Identify the key areas that need improvement, decide the changes needed to improvement
DO
[image:2.595.92.486.280.532.2]Implement the plan, identify the data sources for performance indicators and measure them
Figure 1. Deming’s PDCA Cycle
One of the key activities that make a significant impact on continuous improvement is defining the performance indicators and modelling their relationship, which is the main focus of this paper.
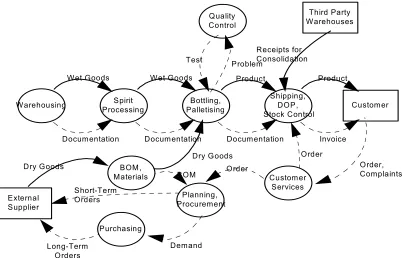
Let us take a practical example of improving Order Fulfilment Process in a bottling plant. The various activities within the Order Fulfilment Process are represented in Figure 2.
the performance of OTIF and Process Cost. Usually these leading indicators relate to the inputs of the process or the activities within the process or even outputs of the process. It is these leading indicators that need to be monitored to ensure that the process does not go out of control. The question is how do we find these leading indicators? And how do we monitor and manage them?
Bottling, Palletising
Shipping, DOP, Stock Control
Customer Services Planning,
Procurement
Warehousing ProcessingSpirit Customer
Wet Goods
Documentation Documentation Documentation
Wet Goods Product Product
Invoice
Order, Complaints Order
Order
Third Party Warehouses
Receipts for Consolidation Quality
Control
Test Problem
BOM,
Materials BOM
Dry Goods
External Supplier
Dry Goods
Purchasing
Demand Long-Term
Orders
[image:3.595.94.496.164.422.2]Short-Term Orders
Figure 2. Order Fulfilment Process in Bottling Company
How to develop Leading Indicators?
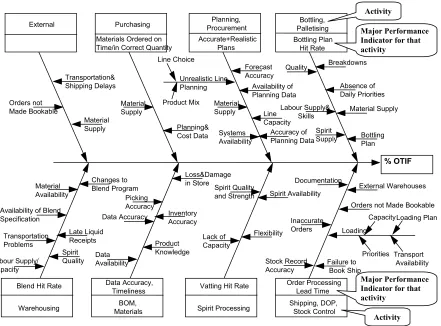
Cause and Effect diagrams can be used to identify the leading indicators that affect the lagging key performance measures. This is not a new concept, it has been in practice for many years. Figure 3 illustrates the use of a Cause and Effect diagram to identify the causes and leading indicators that would effect OTIF.
Activity Activity
Materials Ordered on
Time/in Correct Quantity Accurate+Realistic Plans
Spirit Supply Material Supply Forecast Accuracy Systems Availability Line Capacity Availability of Planning Data Labour Supply& Skills Product Mix Line Choice Inventory Accuracy Material
Availability Spirit Quality
Loss&Damage in Store and Strength Flexibility Inaccurate Orders Spirit Availability
Orders not Made Bookable
Loading
CapacityLoading Plan External Orders not Made Bookable Material Supply Transportation& Shipping Delays Purchasing Material Supply Planning& Cost Data Planning, Procurement Material Supply Accuracy of Planning Data Unrealistic Line Planning Quality Bottling, Palletising Bottling Plan Breakdowns Major Performance Indicator for that activity Hit Rate Bottling Plan Absence of Daily Priorities Labour Supply/ Capacity
Transport tiona Problems
Warehousing Blend Hit Rate
Documentation
Lack of Capacity
Spirit Processing Vatting Hit Rate Data Accura ,cy
Timeliness BOM, Materials Data Availability Data Accuracy Late Liquid Receipts Spirit Quality Changes to Blend Program Picking Accuracy Availability of Blend
[image:4.595.94.535.130.456.2]Specification Product Knowledge Order Processing Stock Record Accuracy Lead Time Shipping, DOP, Stock Control Failure to Book Ship Major Performance Indicator for that activity Transport Availability Priorities External Warehouses % OTIF
Figure 3. Cause and Effect Diagram showing causes effecting “% On Time In Full”
How do we monitor and manage them?
To facilitate continuous improvement these indicators need to be deployed right down to operational teams who use them to monitor, control and improve daily activities. These indicators should be:
٭ Simple to understand and use ٭ Relevant
٭ Visual
٭ Accurate and reliable
It is also important to make a clear distinction between improvement indicators and control indicators. Improvement indicator is one that needs to be measured for an improvement. Control indicator is one that does not require improvement but has to be monitored in order to ensure that the process does not go out of control.
on future performance, i.e. using the leading indicators to drive improvements that would result in improvements in the lagging performance measures – e.g. improving downtime will improve the Bottling Plan Hit Rate, thus improving % OTIF. In this way people start thinking more proactively as they control the future.
But how can we facilitate the operational teams to manage the future?
Failure Mode and Effect Analysis (FMEA), a risk management tool commonly used in product design, process engineering and risk management providing a useful solution. FMEA allows the operational teams to prioritise the potential impact of each cause (failure mode) according to its:
Frequency of occurrence: How often can a failure mode occur? The rating scale ranges from Very Often = 10 to Very Rare = 1.
Severity: Once a failure occurs, how severe would its impact be on the problem one is trying to control? The rating scale ranges from Very High = 10 to Very Low = 1.
Detectability: How difficult or easy is it to detect the occurrence (or possible occurrence) of a failure mode before it affects the process performance? The rating scale ranges from Very Difficult = 10 to Very Easy = 1.
Figure 4 illustrates an example of an FMEA chart that was created by the Bottling and Palletising team to monitor and improve “Bottling Plan Hit Rate” performance.
Failure Mode
Hit Rate OTIF Occurrence Severity Detectability RPNPriority (Risk Number)
Breakdowns 6 9 7 378
Absence of Daily Priorities 5 6 6 180
Quality 3 4 5 60
Material Supply 2 7 4 56
Bottling Plan 3 7 4 84
Spirit Supply 2 7 4 56
Labour Supply and Skills 1 3 3 9
Total 823
Figure 4: FMEA for Bottling Plan Hit Rate (before improvement)
In the above example, FMEA is used as a tool to analyse and prioritise the potential failures according to their risk. In this example – the order fulfilment process has an inherent unreliability of 823 with respect to Bottling-Plan-Hit-Rate (Hit-Rate) performance, where the total RPN can be used to drive improvements in this process. In our experience, a significant reduction in RPN usually results in a significant improvement in the output measure (i.e. Hit Rate in this case).
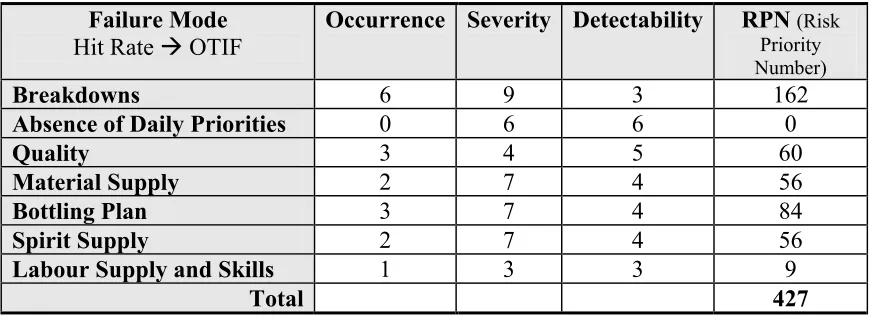
In this case, by taking two actions the RPN was reduced from 823 to 427. These actions were:
• Issuing daily priorities with each job so that high priority jobs are scheduled first. Thus reducing the impact of any breakdowns and stoppages on OTIF. This completely eliminated this cause and further reduced the overall RPN.
Failure Mode
Hit Rate OTIF
Occurrence Severity Detectability RPN (Risk
Priority Number)
Breakdowns 6 9 3 162
Absence of Daily Priorities 0 6 6 0
Quality 3 4 5 60
Material Supply 2 7 4 56
Bottling Plan 3 7 4 84
Spirit Supply 2 7 4 56
Labour Supply and Skills 1 3 3 9
[image:6.595.84.519.127.286.2]Total 427
Figure 5: FMEA for Bottling Plan Hit Rate (after improvement)
In this case FMEA is used as a live operational tool, which is updated every time an improvement action is taken or every time one of the input conditions (i.e. failure mode, occurrence, severity, detectability etc.) changes.
Of course, to drive continuous improvement, it is essential that the operational team identifies and uses performance indicators to track performance against some of the failure modes, such as breakdowns, quality problems, material supply problems, etc., to allow them to identify and eliminate the route causes.
4.0 The difficulties with performance measurement
In the previous section we have discussed how to use performance measurement to manage continuous improvement. In fact, emphasis of the continuous improvement approaches, such as Lean Manufacturing and Six Sigma, is just what we have discussed so far. But when we do all of these, what we get is:
• Few measures at higher levels for senior management, easy to manage as they are measured on a monthly and annual basis and there are only a few of these.
• A lot of measures at lower levels for operational teams, difficult to manage as they are measured on an hourly and daily basis and potentially there are a lot of these.
Considerable effort is required at all levels to collect, analyse and report performance measurement information. According to Bititci et al (2000), Bourne and Neely (2000), Hudson et al (1999), Bierbusse and Siesfeld (1998) performance measurement fails in many companies for the following reasons:
• A lot of time and investment is required for data collection, analysis and reporting.
• Very difficult to quantify results in areas that are more qualitative in nature.
• The large number of measures, which are difficult to be managed on a paper-based performance measurement system.
The bottom line is that without appropriate IT support, Continuous Improvement with performance measures and indicators become very difficult and short-lived.
5.0 IT support for performance measurement
In the last decade, there has been an enormous growth in the number of software applications offered for performance measurement. Most of them are based on Balanced Scorecard. These performance measurement software applications are developed for data communication, integration, analysis and representation to different sets of audience. Most of this software offers comprehensive functionality, which makes it difficult in distinguishing between these applications. Each software is good at providing certain functionality for specific organisations. The software available to support performance measurement can be classified as:
• Business Intelligence (BI) is a continuous and systematic process, which produces information on a company’s operating environment in a timely manner and usable form so that it can have positive impact on business processes. Effective Business Intelligence will facilitate the improvement of business processes and reduces the time used for decision-making. Typically, it includes software functions, such as data sourcing, data analysis, risk assessment and decision support, etc. It includes software tools, such as Data Marts, Data Warehousing, On-line Transactional Analysis tools, Multidimensional Databases or On-Line Analytical Processing (OLAP) tools, Ad-hoc and Prepackaged Query tools etc. Typical BI platforms are provided by: Oracle Corp., Hyperion, SAS Institute, Cognos Ltd., Pilot Software Ltd, SAP Ltd., PeopleSoft, CorVu Plc., Gentia Software Ltd., Comshare etc.
• Enterprise Resource Planning (ERP) Platforms: An ERP system is a multi-module software system that includes a central relational database and several software modules for managing purchasing, inventory, production, personnel, shipping, customer service, financial planning, and other important aspects of the business. A number of ERP vendors have started to integrate performance measurement as a module or feature within their ERP platform, e.g. SAP Ltd., PeopleSoft, Oracle Corp. Ltd. etc.
• Dedicated Performance Measurement Platforms: These are software platforms that allow organisations to implement performance measurement frameworks such as Balanced Scorecard, EFQM, etc. Typically it collects the performance relevant information from different sources, analyses the information and communicate the information to different stakeholders, who make decisions. Vendors of dedicated performance measurement platforms include PB Views Ltd., QPR Software Plc., Inphase Software Ltd., Hyperion, Cognos Ltd., Lucidus Ltd., PT. Global Performa Maxima, QuantiSoft, Gentia Software Ltd., IPS-Sendero, Comshare, Active Strategy etc.
In order to understand these software platforms in depth, a structured review has been conducted (Nudurupati and Bititci 2001) based on the user criteria gathered from Scottish based manufacturing companies. The results of the review are that most of the software and solutions themselves are:
Expensive specially for manufacturing SMEs – Typically ranging from a minimum of £30k for software alone, plus consultancy, plus training, plus development time
Most of the software applications have limited capability of incorporating statistical analysis to support Six Sigma type of improvement processes.
Most of the software are based on Balanced Scorecard, and hence, the functionality is more restricted to this particular framework.
The review resulted in a detailed report on each software product against standard criteria identified. A sample report is included in Appendix A, and the full report is available from the Centre for Strategic Manufacturing, University of Strathclyde. The report also includes a spreadsheet (MS Excel file), which helps prioritising the criteria for an enterprise. This facilitates tailoring of the criteria giving ratings for different software products, based on individual organisational priorities.
6.0 Conclusions
In this paper we demonstrated that the quality of improvement depends on the quality of leading and lagging performance indicators. For this reason, several tools, such as Process Mapping, Cause and Effect analysis and FMEA, needs to be used in an integrated way with performance measurement models, such as Balanced Scorecard, Integrated Performance Measurement System, Performance Prism and so on. However, in our experience, this alone is not quite enough due to the amount of effort required to monitor performance indicators at operational levels. Providing IT support will eliminate some of the problems and promote sustainable continuous improvement.
References
Bierbusse, P. and Siesfeld, T. (1998) "Measures that Matter", Journal of Strategic Performance Measurement, 1, 2. 6-11
Bititci U S and Carrie A S, (1998), Integrated Performance Measurement Systems: Structures and Relationships, EPSRC Final Research Report, Grant No. GR/K 48174, Swindon UK.
Bititci U S, Turner T. and Begemann C. (2000), “Dynamics of Performance Measurement Systems”,
International Journal of Operations Management, Vol. 20, no. 6, pp 692-704.
Bourne M and Neely A, (2000), “Why performance measurement interventions succeed and fail”, Proceedings of the 2nd International Conference on Performance Measurement, Cambridge UK, pp
165-173.
Hudson M, Bennet J P, Smart A and Bourne M, (1999), Performance measurement in planning and control in SME's, Global Production Management edited by Mertins K, Krause O and Schallock B, Kluwer Academic Publishers, isbn 0-7923-8605-1
Kaplan R. S. and Norton D. P., (1992) “The Balanced Scorecard – Measures That Drive Performance”, Harvard Business Review, January-February issue.
Kaplan R. S. and Norton D. P., (1996) “Translating strategy into action: The balanced scorecard”, Harvard Business School Press, Boston, Mass 1996.
Neely, A., Mills J, Gregory M and Platts K. (1995). “Performance measurement system design - a literature review and research agenda.” International Journal of Operations & Production Management Vol. 15, No. 4, 80-116
Neely A., Mills J., Gregory M., Richard H., Platts K. and Bourne M., (1996) “Getting the measure of your business”, University of Cambridge, Manufacturing Engineering Group, Mill Lane, Cambridge.
Neely A. and Adams C. (2001) “The Performance Prism Perspective”, Journal of Cost Management, January/February 2001.
Nudurupati S. S. and Bititci U. S. (2001) “Review of Performance Management Information Systems (PerforMIS)”, Internal Report, Centre for Strategic Manufacturing, DMEM, University of Strathclyde.
Appendix A
Background:
Founded in 1991, VENDOR is a company to design and implement Balanced Scorecard software. It implemented Balanced Scorecard software for a major bank in the UK. The first general release of Client Server version was released in 1998. The fully web enabled version 3.01 was released in Autumn 2000.
At the time of doing this review in Summer 2001, the web-enabled version of the product is less than one year old.
General Overview of Software:
Software supports the whole enterprise with a fully web enabled out-of-the box application (ready-to-use). It is offered as stand-alone software and is not a part of ERP or Business Intelligence solution, but it is compatible (or can be linked) with them. Since it is based on Microsoft Technology, it can also be tailored to one’s requirements using Microsoft Office applications.
Adapting different frameworks
It contains number of pre-built frameworks for a number of performance management approaches, including Balanced Scorecard, Business Excellence Model etc. The users can ignore these pre-built frameworks and can build their own framework using templates. But the software was built based on Balanced Scorecard.
Deploying Performance Measures
It supports the deployment of strategic and tactical objectives and measures to any level in the organisation, providing graphical interfaces and point click wizards to enable users in defining the objectives and measures. Objectives and measures can be cascaded down to the team or individual level if required, and can be related to multiple perspectives or lines of reporting. These multiple perspectives include the classic Balanced Scorecard perspectives, but may also include process views, functional views, and any other reporting needs defined by the organisation.
Objectives are generally prioritised through specific keywords to define different kinds of priority (e.g. High Payback, Regulatory Requirement, Low Cost). These keywords can be used to drive the graphical display of objectives, to give instant visualisation of levels of priority. Objectives and their measures are linked through different kinds of Cause and Effect relationships.
Data collection and maintenance
Software includes a simple spreadsheet like a database to be used as stand-alone software. It also supports a standard SQL RDBMS – by default, this is Microsoft SQL Server 7 or SQL 2000. Hence, data can be imported and exported directly from and to any ODBC compliant database.
SoftwareAdministratorincludes an interface to enable the Model Administrators to map the contents of the flat files to Software objectives and measures. Once this mapping has been completed, the future importing of data can then be scheduled to run automatically.
Analyses of data
Graphical scorecards based on specific objectives, or on groups of objectives or measures, can be set up by the users. These enable the planned and actual performance of performance measures for the current period and the year to date to be displayed using “traffic-light” icons and values. The software applies default values for configuration parameters, which speeds up the creation and maintenance of entities.
Colour coded variances are shown against several ‘plan’ lines at once – these plan lines are user definable, and can include competitors, best in class benchmarking, 3 or 6 month forecast, etc. Trend tables can show periodic data, accumulated data, or normalised scores, simply by choosing the appropriate option from a selection list. Data is graphed and analysed dynamically in Excel providing access to the extensive statistical analysis available in Excel. It does not support any charts and statistical analyses that are not available in Excel. Users can add graphics, comments, and other elements to charts. Eventhough it differentiates the measures with priority it does not differentiate between control measures and improvement measures.
Reporting and communicating results
It displays the performance of objectives and measures in scorecards, and in networks, which can for example, be used to demonstrate cause and effect links through different perspectives. All reports are dynamically available on the web. It displays the values for each objective and measure in a wide range of table and graphical styles. Chart styles can be saved for re-use. All reporting views – Networks, Tables, Graphs, Cubes, Associated Documents, etc – can be combined into user-defined Briefing packs. These Briefing Packs may be passive or active, depending upon the needs of the user.
Associate or integrate with any Microsoft office document – Word, Excel, PowerPoint, Project – with any objective or measure, enabling the use of locally customisable templates and reports within Softwarereports and briefing packs. Data in both reports and briefing packs is automatically updated by Software from the underlying Software database.
It is does not include any Web Server but it supports Microsoft Internet Information Server to communicate these results. It also supports Microsoft Discussion Server for threaded email discussions. Documents can be edited directly, enabling comments and suggestions to be shared immediately over the web. Documents can be emailed to forward comments, etc. Alerts can be configured to email the owner of the objective or measure if performance goes out of tolerance.
Minimum Hardware/Software Requirements:
Server Hardware: Pentium PIII, 750MHz, 512GB RAM, 2GB Disc space
Server Software: Microsoft NT Server 4.0 or later (or) Microsoft Windows 2000 Server & Microsoft Internet Information Server 4, Microsoft Transaction Server 2.0 Service pack 1 or later, Microsoft SQL Server 7.0 and OLAP Services Pack 3 or later.
Client Software: Microsoft Windows NT Workstation 4.0, Service Pack 4 or later, Microsoft Windows 2000, Service Pack 1 or later (or) Microsoft Windows 95 (or) Microsoft Windows 98 (or) Microsoft ME & Microsoft Internet Explorer 5.01 or later, Microsoft OLAP Client Services.
Critical Review of the software product Rating: Designing Performance Measurement Frameworks:
What frameworks does it adapt?
Is it customisable to build other frameworks?
Many (as mentioned above)
Yes
Defining Performance Measures:
Does it include deployment of objectives into performance measures?
Does it provide library of performance measures? Does it apply prioritisation, cause and effect relationship between the measures?
Yes
No (can be provided if required)
Yes
Data collection and maintenance:
What database file structure can you extract from? What kind of database does the software include to be used as stand-alone software?
Any ODBC compliant database, ERP systems, BI systems.
A simple spreadsheet like a database Analyses of data:
Does it include colour coding to identify the danger at a glance?
Does it include competitor analysis?
Does it include simple charts and statistical quality control charts?
Does it include simple calculations to complex statistical analyses?
Does it differentiate between control and improvement measures?
Yes
Yes
Simple charts but not SQC charts
Yes but performs some of the calculations through Excel
No
Reporting and communicating results:
Does it include a structured reporting tool?
Is it compatible with any other applications? Is the data in the reports updated as the source data changes?
Does it include any web server to communicate these results throughout the organisation?
Yes, (but very limited, it includes reporting views- networks, tables, graphs, cubes, associated documents, etc. can be combined into user defined briefing packs.
Yes, associated with any Microsoft office documents
Yes
No, but it can support many types of servers already available with the user
Cost Structure of the software:
Software is priced according to the number of named users for a 10-year Licence basis plus annual maintenance.
• List Prices
10 year Licence One-time payment: £1750 per user plus
£ 350 per users per annum maintenance Normally a minimum of 20 User Licenses is required.
• Annual Maintenance & Support 20% of the List Price
• Training Costs