IMMEDIATE EFFECT OF PERCUTANEOUS
TRANSVENOUS MITRAL COMMISSUROTOMY
ON RIGHT VENTRICULAR FUNCTION
Dissertation Submitted to
THE TAMILNADU DR.M.G.R.MEDICAL UNIVERSITY
in partial fulfillment of the requirements for the award of the degree of
D.M. CARDIOLOGY BRANCH II – CARDIOLOGY
MADRAS MEDICAL COLLEGE &
RAJIV GANDHI GOVERNMENT GENERAL HOSPITAL CHENNAI - 600 003
CERTIFICATE
This is to certify that this dissertation titled “Immediate effect of
Percutaneous Transvenous Mitral Commissurotomy on right
ventricular function” submitted by DR. HARIHARAKRISHNAN.R
to the faculty of Cardiology, The Tamil Nadu Dr. M.G.R. Medical
University, Chennai in partial fulfillment of the requirement
for the award of DM degree branch II (Cardiology), is a bonafide
research work carried out by him under our direct supervision
and guidance. The period of post-graduate study and training was
from August 2011 to July 2014.
Dr.R.VIMALA,M.D,
The Dean,
Madras Medical College and Rajiv Gandhi Government General Hospital
Chennai.
Dr.M.S.RAVI,M.D., D.M.
Guide
Professor and Head, Dept of Cardiology,
DECLARATION
I, Dr. Hariharakrishnan.R., solemnly declare that the
dissertation titled “Immediate effect of Percutaneous Transvenous
Mitral Commissurotomy on right ventricular function” has been
prepared by me under the guidance and supervision of Prof.M.S.Ravi
M.D, D.M, Professor and Head, Department of Cardiology, Madras
Medical College and Rajiv Gandhi Government General Hospital,
Chennai. This is submitted to The Tamil Nadu Dr. M.G.R. Medical
University, Chennai, in partial fulfillment of the rules and regulations
for the award of DM degree (branch II) Cardiology.
Place: Chennai
ACKNOWLEDGEMENT
At the outset, I wish to thank our Dean Dr.R.VIMALA, M.D,
and our former Dean Dr.V. KANAGASABAI, M.D., for permitting me
to use the facilities of Madras Medical College and Rajiv Gandhi
Government General Hospital to conduct this study.
I am indebted to my guide and the Head of Department of
Cardiology, Prof. M.S.RAVI, M.D., D.M for his constant guidance,
advice and encouragement throughout the study and my post graduate
period.
I sincerely thank the professors of Cardiology department
Prof K.Meenakshi, Prof. D.Muthukumar, Prof. N.Swaminathan,
Prof. G.Ravishankar, Prof. G.Justin Paul and Prof.G.Gnanavelu
for their valuable support.
I offer my heartfelt thanks to Dr. S. Venkatesan M.D, D.M., for
his valuable advice and support throughout the study.
I offer my heartfelt thanks to the Assistant Professors
of the department of Cardiology Dr. G.Palanisamy, Dr.Moorthy,
Dr.S.Murugan, Dr.G.Manohar, Dr.Elamaran, Dr.Arumugam,
Dr.Saravana Babu and Dr.Balaji Pandian for their constant
encouragement, timely help and critical suggestions throughout
the study.
My patients, who form the most integral part of the work, were
always kind and cooperative. I pray for their speedy recovery and place
this study as a tribute to them.
My family, friends and fellow post graduates have stood by me
during my times of need. Their help and support have been invaluable to
the study.
Above all I thank the Lord Almighty for His kindness and
CONTENTS
S NO. CONTENTS PAGE NO
1. INTRODUCTION 1
2. AIMS AND OBJECTIVES 3
3. REVIEW OF LITERATURE 4
4. MATERIALS AND METHODS 37
5. RESULTS AND ANALYSIS 41
6. DISCUSSION 55
7. CONCLUSION 63
8. APPENDIX
BIBLIOGRAPHY
PROFORMA
MASTER CHART
INFORMATION SHEET AND CONSENT FORM
ETHICAL COMMITTEE APPROVAL LETTER
ABBREVIATIONS
ET : Ejection Time
IVCT : Iso Volumic Contraction Time
IVRT : Iso Volumic Relaxation Time
MPI : Myocardial Performance Index
MRI : Magnetic Resonance Imaging
MVO : Mitral Valve Orifice
PW : Pulse Wave
RV-MPI : Right Ventricle- Myocardial Performance Index
RVOT : Right Ventricular Outflow Tract
RVOT FS : Right Ventricular Outflow Tract Fractional
Shortening
RVSP : Right Ventricular Systolic Pressure
SPAP : Systolic Pulmonary Artery Pressure
TR : Tricuspid Regurgitation
1. INTRODUCTION
Rheumatic heart disease (RHD) is a late sequel to acute rheumatic
fever, which in turn is an autoimmune reaction to infection by group A
beta haemolytic streptococcal infection. Although the incidence has
decreased over the past several years, rheumatic heart disease still
remains a major cardiovascular problem in developing countries like
India. An approximate 3-10% of patients with acute rheumatic fever
develop RHD, although the exact incidence in India remains a mystery
since acute rheumatic fever is an underreported condition. The most
common valvular lesion in RHD is isolated mitral stenosis (MS), which
occurs in approximately 40% of patients. RHD is also the commonest
cause of isolated mitral stenosis.
There are several pathophysiological implications in rheumatic
mitral stenosis. The natural course of rheumatic mitral stenosis is
unpredictable, since many patients have a latent asymptomatic period
before the onset of symptoms which is highly variable. As the severity
of the stenosis increases, there is an obstructive physiology across the
mitral valve, the major progressive event being increased pulmonary
artery pressure and subsequently progressive right ventricular
inflammatory process or from secondary hemodynamic changes
occurring across the pulmonary vasculature leading to a pressure
overloaded right ventricle. The severity of right ventricular function is
an important determinant of the onset of symptoms, timing of
intervention and the long term outcome of any interventional procedure.
Approximately 40 years ago, the efficacy of surgical mitral
commissurotomy was demonstrated by Harken and Bailey. Until the
advent of percutaneous transvenous mitral commissurotomy (PTMC),
open or closed surgical mitral commissurotomy and mitral valve
replacement were the only major options available for the management
of mitral stenosis. PTMC is now widely used as the preferred procedure
in mitral stenosis in view of its comparatively favourable efficacy and
safety profile. The use of PTMC has dramatically changed the outcome
of mitral stenosis in the past few years due to immediate favourable
alterations in the hemodynamics of the various cardiac chambers.
Several studies have shown an immediate and long term improvement in
cardiac hemodynamics and right ventricular function after PTMC.
Assessment of right ventricular function with echocardiography can be
challenging due to its known geometric complexity. This present study
was undertaken to assess right ventricular changes immediately after
2. AIMS AND OBJECTIVES
1. To analyse the effect of PTMC on various echocardiographic
parameters of left and right ventricular function
2. To compare the various echocardiographic parameters of right
3. REVIEW OF LITERATURE
3.1. RHEUMATIC HEART DISEASE: MAGNITUDE AND
IMPACT OF THE PROBLEM
Rheumatic fever (RF) and subsequent rheumatic heart disease
(RHD) is still a cause for major cardiovascular morbidity, more so in
developing countries. There has been a change in the clinical and
epidemiological pattern of rheumatic fever in the recent years, with
more number of subclinical cases diagnosed by simple
echocardiographic methods, suggesting that the Jones criteria may be
deemed inadequate for a clinical diagnosis. The mystery concerning the
pathogenesis and the susceptibility still remains, as is the area
concerning primary prophylaxis. Management of rheumatic heart
disease remains the same with the addition of PTMC into the scenario,
with better outcomes in the last few years.
There has also been a change in the reported incidence of RHD
and RF over the past years. [1] Between 1948 and 1965, a population
study revealed that amongst the hospital admissions for cardiovascular
diseases, about 20-50% of them were due to RHD. This percentage has
possibility of a bias due to an increase in coronary artery disease.
A recent Indian Council of Medical Research (ICMR) study (between
2000 and 2010) in 10 different, mostly urban locations of the country
found the prevalence to range from 0.2 to 1.1/1000 for RHD and 0.0007
to 0.2 /1000 for RF.[2] The prevalence of RHD in school surveys in
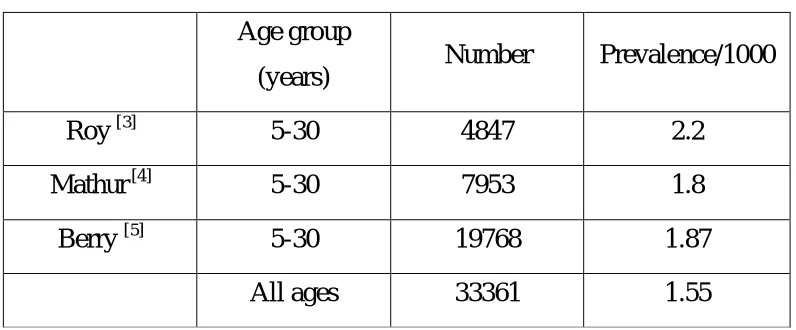
various studies ranged from 0.67-2.1/1000. With this overall prevalence,
there are an estimated 2-2.5 million people with RHD in India. The
following table shows the estimated prevalence of RHD in three major
[image:15.612.114.512.391.556.2]school surveys conducted over the past three decades.
Table 1: Prevalence of Rheumatic heart disease in India
Age group
(years) Number Prevalence/1000
Roy[3] 5-30 4847 2.2
Mathur [4] 5-30 7953 1.8
Berry [5] 5-30 19768 1.87
All ages 33361 1.55
The global burden of RF/RHD is somewhat similar to that of the
Indian scenario when the developed economies are excluded. Various
population studies have shown an estimated 16-20 million people
million (all ages). [6][7] Similar global estimates for RF are placed at
around 336,000 new cases per year. This did not include the subclinical
cases of RF.
Without proper prophylaxis or treatment, approximately 50-80%
of patients with RHD progress to congestive heart failure within 20
years, requiring medical or surgical management.
3.2. PATHOPHYSIOLOGY OF RHEUMATIC MITRAL
STENOSIS
Before the advent of Jones criteria, the diagnosis of rheumatic
fever was chaotic, with no proper treatment or prophylaxis available.
This has stabilized to an extent over the past few decades, but with a
new surge of patients with subclinical carditis requiring a mandatory
echocardiogram for diagnosis, thus questioning the validity of the Jones
criteria in present day scenario.
The basic pathology in rheumatic mitral stenosis is commissural
fusion with a progressive fibrosis and thickening of leaflets. Stenosis
takes about ten years to develop on an average. Most of the symptoms
events in the pulmonary circulation. The hemodynamic changes in
mitral stenosis can be summarised as follows:
1. Increase in left atrial pressure due to mitral valve narrowing
2. Retrograde transmission of left atrial pressure with resultant
pulmonary venous congestion, pulmonary oedema and development of
pulmonary symptoms due to bronchial vein congestion.
3. Progressive increase in pulmonary arterial pressure
4. Redistribution of blood flow to the upper lobes due to high left atrial
pressure and high hydrostatic pressure in the lower lobe vessels.
5. Eventual pressure overload of the right ventricle leading to right
ventricular failure.
6. The left ventricular function usually remains normal till end stage
cardiac failure sets in. [8]
3.3 STANDARD MANAGEMENT OF RHEUMATIC MITRAL
STENOSIS
3.3.1 Echocardiographic assessment in mitral stenosis
Echocardiography plays an important role in deciding the mode
determining the success of an interventional procedure. The following
table shows the parameters required to be documented in any case of
mitral stenosis.
Table 2: Echocardiographic assessment in a patient with mitral
stenosis
Echo view Mode Parameter
1 PLAX 2-D Wilkins score
2 PLAX M Mode Mitral valve mobility and
excursion
3 PLAX CF Doppler Quantification of MR
4 A4C CW Doppler Pulmonary artery
systolic pressure
5 PSAX MV level 2-D Mitral valve area by planimetry
6 PSAX
PM level
2-D Wilkins score,
commissural calcification score
7 A4C CF Doppler Presence of MR
8 A4C 2-D Wilkins score
9 A4C CW Doppler Mean gradient
10 A4C CW Doppler Pressure half time and
mitral valve area
11 A2C/3C 2-D Wilkins score
12 Other
considerations
Abbreviations: A2C: apical 2 chamber; A3C: apical 3 chamber;
A4C: apical 4 chamber; CF: colour flow; CW: continuous wave;
LA: left atrium; MV mitral valve; MR: mitral regurgitation; PLAX:
parasternal long axis; PSAX: parasternal short axis view; PM: papillary
muscle; RV: right ventricle; TOE: transoesophageal echocardiography;
The management of mitral stenosis can be classified as
symptomatic and definitive. Symptomatic treatment forms an integral
backbone of therapy prior to planning an interventional or surgical
procedure. Components of medical management include:
1. Treatment of cardiac failure
2. Treatment of arrhythmia –atrial fibrillation
3. Treatment of pulmonary oedema
4. Prophylaxis/treatment of infective endocarditis
5. Secondary prophylaxis for rheumatic fever.
Intervention is currently indicated in patients with clinically
significant MS (<1.5 cm2) and in symptomatic patients. Several factors
influence the type and timing of intervention including valve anatomy,
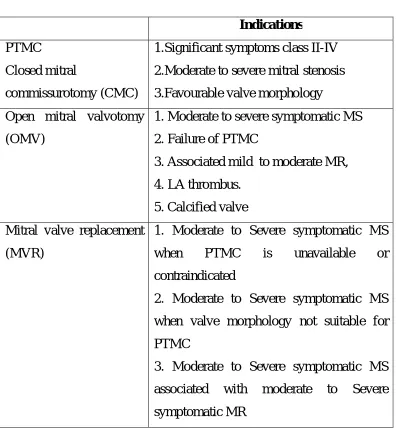
Interventional methods include PTMC, surgical commissurotomy
(open or closed) and mitral valve replacement. The following table
summarises the indications for all the types of intervention. [8]
Table 3: Methods available for non medical management of
mitral stenosis
Indications
PTMC
Closed mitral
commissurotomy (CMC)
1.Significant symptoms class II-IV
2.Moderate to severe mitral stenosis
3.Favourable valve morphology
Open mitral valvotomy
(OMV)
1. Moderate to severe symptomatic MS
2. Failure of PTMC
3. Associated mild to moderate MR,
4. LA thrombus.
5. Calcified valve
Mitral valve replacement
(MVR)
1. Moderate to Severe symptomatic MS
when PTMC is unavailable or
contraindicated
2. Moderate to Severe symptomatic MS
when valve morphology not suitable for
PTMC
3. Moderate to Severe symptomatic MS
associated with moderate to Severe
[image:20.612.116.512.229.675.2]3.4. PTMC
The advent of coronary angioplasty made way for the
introduction of balloon techniques in valvular heart disease also. It is a
simplified procedure which obviates the need for general anaesthesia,
extracorporeal circulation and thoracotomy, when compared with its
predecessors. It has now widely become the procedure of choice in
mitral stenosis wherever indicated in view of the above advantages. [9]
The mechanism by which the mitral valve area increases after PTMC is
similar to surgical commissurotomy, that being commissural splitting
and this has been proven by in vitro mitral valve studies.[10] Both the
calcified and uncalcified mitral commissures are split during the
procedure and this contributes to the success of the procedure. The
major techniques used are the double balloon technique and the Inoue
technique. Until recently, the double balloon technique (initially
described by Al Zaibag) was the most successfully used technique, with
greater than 100% increase in mitral valve area achieved, that was
sustained for over a period of two years. The main disadvantages with
the procedure are its technical difficulty and the need for double
punctures. This was soon replaced by the Inoue technique, which was
success rates. [11][12] The advantages of the single balloon technique
include a shorter procedure time and lesser incidence of left ventricular
perforation.
Currently available single balloon catheters include the double
lumen Accura balloon and the triple lumen Inoue balloon. Both are
made from polyvinyl chloride with a latex balloon at the distal end. The
main advantage of Accura balloon over the Inoue balloon is that there is
no seepage of blood between the two layers of the balloon. The
disadvantage is that there is no provision for prevention of deflation
failure.
Factors deciding the size of the balloon include height of the
patient, condition of the MV and age of the patient. According to
Hung’s formula, the size of the balloon is derived from the height of the
patients and is most commonly used in clinical practice. The formula is
as follows
Size of the balloon = height in cm (rounded to nearest 10) +10
10
In patients with calcified valve or subvalvular disease, the size of
patients or patients at risk of developing severe MR, smaller size
balloon should be used.
3.4.1. Indications for PTMC: [8]
PTMC is indicated in the following scenarios:
1. Patients with symptomatic moderate to severe MS in the absence
of LA thrombus and not more than mild MR:
2. Symptomatic (NYHA functional class II, - IV) with valve
morphology favourable for PTMC
3. Asymptomatic patients who have pulmonary hypertension
[pulmonary artery systolic pressure > 50 mm Hg at rest or > 60
mm Hg with exercise]
4. Symptomatic patients who are either not candidates for surgery or
are at high risk for surgery.
Expanding indications include the following:
1. Mitral Restenosis
2. Mitral Stenosis with LA Clot [type Ia, Ib & IIa]
4. Hybrid Therapy - AR, AS, CABG
5. Lutembacher’s syndrome
3.4.2 Contraindications for PTMC:
1. Left atrial body clot
2. Grade 2 or more MR
3. Bicommissural calcification
4. Lack of expertise
5. Severe associated aortic valve disease
6. Associated coronary artery disease requiring bypass grafting.
3.4.3 Outcomes of PTMC
Standard definition of a successful PTMC includes the following:
1. An increase in mitral valve area of >50% from baseline (or)
2. Final valve area of >1.5cm2 (and)
3. Absence of >Sellers Grade 2 MR
3.4.4. Immediate results:
In the majority of the patients a pronounced hemodynamic and
clinical improvement is obtained immediately. The most important
immediate clinical effect is an improvement in exertional dyspnoea. In a
study by Tanabe et al, it was observed that this improvement was not
accompanied by an increase in lung compliance. The authors proposed
that a decrease in excessive ventilation due to a decrease in
physiological dead space resulting from hemodynamic improvement
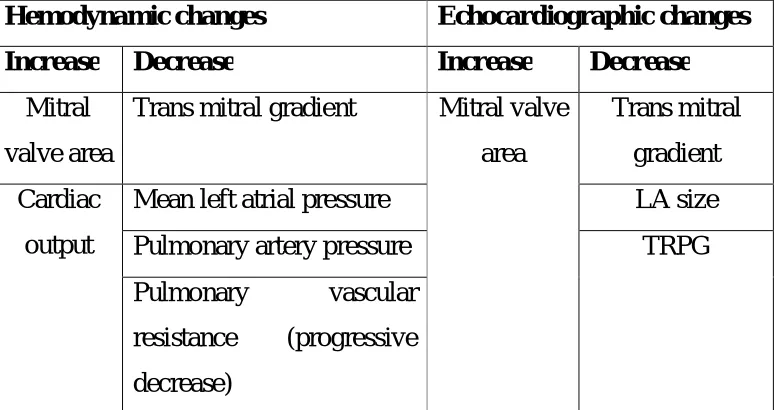
partly contributes to the early relief of symptoms after PTMC. [13] The
hemodynamic and echocardiographic changes can be summarised as
[image:25.612.119.506.471.676.2]follows:
Table 4: Changes occurring after PTMC
Hemodynamic changes Echocardiographic changes
Increase Decrease Increase Decrease
Mitral
valve area
Trans mitral gradient Mitral valve
area
Trans mitral
gradient
Cardiac
output
Mean left atrial pressure LA size
Pulmonary artery pressure TRPG
Pulmonary vascular
resistance (progressive
A study of 108 patients by Al-Khalifa et al in Sudan showed
optimal results in 91.6 % of patients. There was a drop in left atrial
mean pressure 32 mmHg to 12 mmHg and left atrial to left ventricular
(LV) gradient from an average of 25 to 5 mmHg. Mean mitral valve
area increased from 0.86 cm2 to 1.9 cm2 (p<0.001) and pulmonary
artery (PA) pressure dropped from 71 to 40 mmHg (p<0.01). [14] In
another study by Salarifar et al, it was observed that mitral annular
calcification independently had a negative effect on the immediate
results of PTMC. [15] In a prospective study by Nobuyoshi et al, 106
consecutive patients undergoing PTMC were studied. The authors
concluded that a successful PTMC was achieved in 97 patients. There
was an immediate decrease in mean LA pressure, mean mitral diastolic
pressure gradient and mean mitral valve area.[16] Hildick Smith et al
studied 106 patients with unfavourable features and observed that 61%
of patients had immediate successful PTMC.[17]
Factors influencing the immediate outcome of PTMC
Increase in mitral valve area after PTMC is inversely related to
the echocardiographic score. Balloon size directly affects the immediate
outcome of PTMC whereas old age, calcification, valvular thickening,
procedure and NYHA class before the procedure inversely affect the
outcome of PTMC. Taufiqur Rahman et al concluded that patients with
atrial fibrillation had a much poorer outcome than patients without atrial
fibrillation, although it was not an independent predictor of immediate
outcome. Ferrolino et al concluded that the Wilkins scoring system was
the best predictor of the immediate outcome of PTMC.[18] Ajaz Ahmad
et al observed that patients with echo score of < 8 have a better outcome
and fewer complications compared to those with echo score > 8.[19]
3.4.5. Long-term outcomes of PTMC and the determinants of its
success:
The benefit obtained with PTMC in the long run is an ongoing
one with increasing clinical and hemodynamic improvement over the
first few years. The major events in the long run include restenosis,
death, symptomatic deterioration, need for a repeat PTMC and the need
for a mitral valve replacement. Restenosis rates vary from 2.4% to 50%
in follow-up studies ranging from 2 to 5 years in duration. However,
there is a wide difference in the definition of restenosis and the method
of assessment so the actual incidence has not been exactly determined.
In a study by Fawzy et al, restenosis occurred in 17.6 % of
patients and the incidence was lesser in patients with a low echo score.
Independent predictors of event free survival (as defined by the
appearance of NYHA class III or IV symptoms, death, repeat PTMC or
MVR) were mitral echo score and age. This study had a follow up of up
to 13 years after PTMC.[20] In the study by Hildick Smith et al, event
free survival was 96%, 82% and 56% at 1, 3 and 6 years. Freedom from
restenosis was 98%, 92% and 75% at 1, 3 and 6 years. Independent
predictors of event free survival in this study were male gender, absence
of comorbidities, low echocardiographic score and smaller left atrial
diameter.[17] Kwan Song et al compared the long term outcomes of
patients undergoing PTMC and mitral valve replacement. They
observed that mitral valve replacement was better in patients with a
higher echocardiographic score and atrial fibrillation, whereas those
patients without atrial fibrillation and echo score < 8 did not show any
difference.[21] Hunget al observed that the event free survival rates were
more in patients with non calcified pliable valves as compared to those
with calcified valves or those with subvalvular fusion (100% versus
76% at 30 months).[22] Similar results were obtained in the study by Pan
et al (event free survival of 85% at 5 years). The best determinants of
fibrillation.[23] Cohen et al observed a five-year event-free survival rate
of 51 %.[24] In the study by Postet al, a high immediate success rate was
obtained in patients even with severe disease but the eventual long term
cardiovascular outcome was not favourable. Hence the authors
recommended surgical correction in such patients. [25] Wilkins et al
concluded in their study that the echocardiographic score was the sole
determinant of the outcome of PTMC.[26] Sutaria et al observed in their
study that PTMC had an acceptable success rate in older patients with
mitral stenosis but surgical correction was the preferred procedure in
those patients with severe disease. In this study, echo score was not
highly predictive of the outcome. [27] Thus, summarising from various
studies, the long term outcome of PTMC may be considered as a
function of the following factors:
1. Adequacy of the initial PTMC,
2. Presence of atrial fibrillation, severe symptoms
3. Echocardiographic score prior to the procedure.
3.4.6. Complications of PTMC
3.4.6.1. Death: Reasons contributing to mortality in post PTMC
scenario include:
1. Cardiac perforation
2. Cardiac tamponade
3. Systemic or cerebrovascular embolisation
4. Severe acute mitral regurgitation
5. Acute right heart failure due to a sudden massive increase in
pulmonary hypertension in a severely pressure overloaded right
ventricle.
Mortality rates ranged from 0.1-1% in various studies and were
comparable to that of surgical commissurotomy, with very minimal
mortality rates in experienced hands.
3.4.6.2. Cardiac tamponade: This is a very serious although very rare
complication of PTMC with a high mortality rate. It may result from
either perforation of the heart as a complication of trans septal
catheterization or from ventricular perforation caused by the guide wires
or the dilating balloon catheters which may slip towards the apex of the
is very negligible in various studies and is almost nil in experienced
hands.
3.4.6.3. Mitral regurgitation: Mild mitral regurgitation occurs in many
patients undergoing PTMC with no significant clinical outcome. Severe
mitral regurgitation occurring immediately after the procedure is
deemed as failure of PTMC but occurs in a much less percentage of
patients. It may be due to the tearing of the mitral leaflets and rupture of
chordae or a papillary muscle. Severe mitral regurgitation has been
reported to be higher with the Inoue technique compared to double
balloon techniques. [29]
3.4.6.4. Atrial septal defect: Left-to-right atrial shunting is a very
common echocardiographic finding immediately after transseptal
PTMC. Clinically insignificant septal defect has been reported in up to
85% of patients if a sensitive technique is used but this is usually well
tolerated with no significant hemodynamic outcome. Several studies
have tried to determine the mechanisms and factors predicting a shunt
across the septum. Factors predicting a shunt included the following:
c. mitral valve calcification,
d. smaller left atria and
e. low cardiac output. [30][31][32]
The long term clinical concern in these patients is that when they
develop a restenosis, it is difficult to identify them early since the shunt
effectively decompresses the left atrium and this leads to progressive
pulmonary hypertension. The other clinical outcome to be watched for
is paradoxical embolisation. Although most shunts are clinically and
hemodynamically insignificant, they should be carefully observed over
the following years.
3.4.6.5. Embolic events: Embolism may occur due to dislodgment of
left atrial thrombus or debris from the mitral valve. The incidence of
embolism may be higher in patients with atrial fibrillation with
undiagnosed thrombus prior to the procedure. Authors recommend
meticulous evaluation for left atrial thrombus with trans-oesophageal
echocardiography prior to PTMC to avoid this complication. Gas
embolism may also occur as a result of balloon rupture.
3.4.6.6. Vascular complications: Vascular complications are mainly
injury to the femoral vessels in experienced hands is very less since
patients are relatively younger without the presence of generalised
vascular disease.
3.4.6.7. Minor complications are mainly the usual complications
encountered in ordinary heart catheterization. Infective endocarditis is a
rare occurrence.
3.4.6.8. Restenosis: Restenosis rate varies from 10-30% in various
studies and is the major long term complication of PTMC. A surgical
commissurotomy may be recommended in such subset of patients with a
higher incidence of morbidity and mortality. In general a repeat PTMC
appears to be safe but with a lower success rate than initial procedure.
Patients who benefit maximum from a repeat PTMC include those in
sinus rhythm and those with a low echocardiographic score.
3.4.7 Advantages of PTMC over surgery
PTMC is the preferred modality of treatment in isolated mitral
stenosis wherever possible especially in higher volume experienced
centres. As compared to surgical commissurotomy, PTMC is associated
absolute contraindications for a PTMC are severe mitral regurgitation
and presence of a left atrial thrombus which should be confirmed with a
transoesophageal echocardiography prior to the procedure. Amongst the
patients with mitral stenosis undergoing a PTMC, the subsets most
likely to benefit are those without atrial fibrillation, those with a low
echocardiographic score and those without a significant mitral
regurgitation. In presence of adverse factors, surgical commissurotomy
may yield better results. A high echo score is not an absolute
contraindication to PTMC since such patients still have the advantages
over surgical commissurotomy like lower mortality, absence of
anticoagulation related events, low risk of infection and resurgery. The
other advantages of PTMC are that it is non traumatic, can be safely
repeated if necessary without any additional risk, has been shown to be
a very effective palliative tool in patients with severe end stage mitral
stenosis who refuse to undergo the surgical procedure or with
unfavourable valve anatomy, and in those patients with co morbidities
that preclude surgery.
A systematic review by Xiang Hu et al from Cochrane database,
pubmed and EMBASE revealed comparative clinical outcomes after
with a higher incidence of restenosis and new onset mitral regurgitation
in those undergoing PTMC. [33] Reyeset al did a comparative study and
observed that there was a similar immediate success rate in both
procedures with comparable restenosis rates. The authors concluded that
low cost, elimination of need for a thoracotomy and better
hemodynamic results at three years made PTMC a method of choice
especially in patients with favourable valve morphology. [34] Similar
conclusions were obtained in the randomized study by Ben Farhat et
al.[35] Meneses et al studied the immediate and the long term outcomes
of patients undergoing PTMC over a period of ten years. They observed
that the procedure was safe and effective in at least two thirds of the
patients with a sustained long term outcome, this being much superior to
the previously available methods of commissurotomy. [36]
3.5 THE RIGHT VENTRICLE IN MITRAL STENOSIS
The right ventricle plays a very important role in mitral stenosis
both in terms of symptomatology and in the management. The right
ventricle can be indirectly involved in mitral stenosis either by back
pressure from the LA or directly by the rheumatic process. Systematic
right ventricle, need for more sophisticated equipment and dominance of
left heart evaluation in such cases. In recent past, more importance is
being given to the right ventricle for the fact that it is the dominant
structure in mitral stenosis. [8]
3.5.1.Echocardiographic assessment of right ventricular
function[37]
The common parameters and echocardiographic views measured
[image:36.612.132.497.392.670.2]for RV functional assessment are shown in table 5.
Table 5: Echocardiographic assessment of RV
Echocardiographic views Parameters
RV focussed Apical four chamber
view
RV and RA size
Subcostal view IVC dimension
Apical four chamber view
PSAX at basal level
Apical four chamber view
Apical four chamber view
Apical four chamber view
Apical four chamber view
Apical four chamber view
Apical four chamber view
RV systolic function
RV-MPI,
TAPSE,
2D RV FAC,
2D RV EF,
3D RV EF,
S’ of tricuspid annulus,
Abbreviations: EF: Ejection fraction; FAC: Fractional area
change; IVA: Isovolumic myocardial acceleration index; IVC: Inferior
vena cava; TAPSE: Tricuspid annular plane systolic excursion
3.5.2 Definition of parameters used for assessment of RV function
1. Fractional Area Change (FAC): It is a measure of RV
systolic function which has been shown to correlate well with RV
ejection fraction on MRI. It is currently one of the recommended
methods of quantitative estimation of RV function. The formula for
estimation of FAC is as follows
EDA-ESA x 100
ESA
Where EDA is RV end diastolic area and ESA is RV end systolic
area.
2. 2D RV EF estimation: This is measured using the area length
method or disc summation method using the apical four chamber view
predominantly. The major disadvantage with the use of this parameter is
that the RV volumes are underestimated because of exclusion of RVOT.
of methods and geometric complexity of the RV. The formula for
estimation of RV EF is as follows
EDV-ESV x 100
EDV
EDV is the end diastolic volume and ESV is the end systolic
volume.
3.5.3 Definition of parameters used for hemodynamic assessment:
1. RVSP/SPAP: This is estimated using TR velocity with a
simplified Bernoulli equation and combining this value with an estimate
of RA pressure. RA pressure is estimated from IVC diameter. In the
absence of a gradient across the pulmonary valve or RVOT, SPAP
equals RVSP. It is recommended that Doppler sweep speeds of
100mm/sec be used for all tracings. If the signal is weak, it may be
enhanced with agitated saline or contrast. Overestimation of spectrum
can be avoided by ensuring that only well defined dense spectral profile
is measured. This parameter is measured using the following formula
RVSP = 4V2 + RA pressure where V is peak TR velocity in
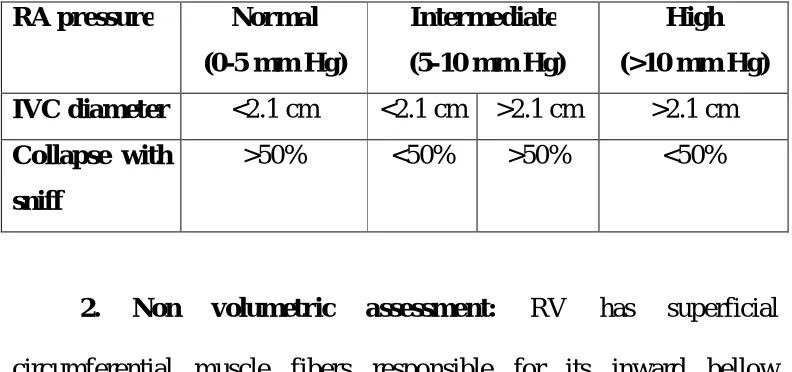
The cut off value for peak TR velocity is 2.8-2.9 m/sec, whereas
the peak gradient is usually less that 35-36 mm Hg. Estimation of RA
pressure on the basis of IVC diameter and collapse is shown in the
[image:39.612.115.511.245.431.2]following table.
Table 6: RA pressure versus IVC diameter
RA pressure Normal
(0-5 mm Hg)
Intermediate
(5-10 mm Hg)
High
(>10 mm Hg)
IVC diameter <2.1 cm <2.1 cm >2.1 cm >2.1 cm
Collapse with
sniff
>50% <50% >50% <50%
2. Non volumetric assessment: RV has superficial
circumferential muscle fibers responsible for its inward bellow
movement as well as inner longitudinal fibers that result in base apex
contraction. Assessment of RV function includes global and regional
assessment. Global assessment includes RV-MPI, RV dp/dt, RVEF,
RVFAC and IVA. Regional assessment includes Doppler derived
systolic annular velocity (S’) and TAPSE.
(a) RV dp/dt: This gives the rate of pressure rise in the ventricle and is
calculated by measuring time required for TR jet to increase in velocity
from 1 to 2 m/sec. A value of <400mmHg/sec is considered as
abnormal.
(b) RV-MPI: This is also known as the RV Tei index. It gives a global
measure of both systolic and diastolic function of the RV. It is basically
derived from the following formula:
RV Tei index = ratio of IVCT+IVRT/ET
This parameter can be measured by two methods:
(i)PW method: ET is measured with PW of RVOT and TV
closure-opening time is measured from PW Doppler of tricuspid inflow or
continuous wave Doppler of TR jet. These measurements are taken from
different images.
(ii) Tissue Doppler method: All time intervals are measured from a
single beat by pulsing the tricuspid annulus.
A value of >0.40 on PW Doppler and >0.55 on tissue wave
Doppler is considered as abnormal. The advantages of measuring this
parameter include reproducibility and feasibility and avoidance of
and is also unreliable when measured with different R-R intervals as in
[image:41.612.125.504.182.376.2]atrial fibrillation.
Figure 1: Measurement of RV Tei index
(c): Isovolumic contraction myocardial acceleration index
(IVA): This is defined as peak isovolumic myocardial velocity divided
by time to peak velocity. It is measured by Doppler tissue imaging at the
lateral tricuspid annulus and is considered as the most consistent tissue
Doppler index for evaluation of RV function. It has been demonstrated
to correlate with severity of illness in conditions affecting RV function
like mitral stenosis. It normally lies between 1.5-3 m/sec2. The
advantages include that it measures global RV function and is less load
Figure 2: Measurement of IVA
Regional assessment of RV function:
(i)TAPSE: Tricuspid annular plane systolic excursion: This is
a method to measure the distance of systolic excursion of RV annular
segment along its longitudinal plane. It is measured in the apical four
chamber view and represents the longitudinal function of the RV. The
greater the descent of the base in systole, the better the RV systolic
function. It is acquired by placing the ‘M’ mode cursor through the
tricuspid annulus. TAPSE correlated strongly with radionuclide
advantages include simplicity and reproducibility. The disadvantages
are that it is angle dependent and load dependent. It has been
recommended that TAPSE should be routinely used as a simple method
of estimating RV function.
(ii) Tissue Doppler imaging: This measures the longitudinal
velocity of excursion and termed as RV S’ or systolic excursion
velocity. The PW Doppler sample volume is placed in either the
tricuspid annulus or middle of the basal segment of RV free wall. An S’
value of <10cm/sec raises the suspicion of abnormal RV function. The
advantages are that it is simple and reproducible. The disadvantage is
that it is angle dependent.
3.5.4 Evidence for altered RV function in mitral stenosis
In general, it has been considered that correction of mitral
stenosis by surgery or repair in any form improves the prognosis of
these patients even in the presence of depressed RV function. However,
certain studies have shown that in the presence of RV failure or severely
depressed RV function, there may be an increase in the perioperative
mortality and the long term success of reparative procedures are
compromised.[38][39] In a study by Johnston et al which compared LV
attenuated response of right ventricular function to exercise whereas the
LV hemodynamics remained normal.[40] Sitaram Mittal et al performed
a Doppler echocardiographic assessment of the right ventricle in
asymptomatic patients with mitral stenosis. They observed a significant
increase in RV thickness as well as end systolic and end diastolic long
axis measurements with a decrease in fractional shortening of these
measurements. This suggested an RV dysfunction even in the absence
of clinical symptoms. In this study, the authors did not find systolic
movement of tricuspid annulus and RV mid cavity short axis dimension
sensitive in detecting RV systolic dysfunction. [41]
A study by Yildirimturk et al revealed that RV isovolumic
acceleration index and RV systolic performance was significantly
reduced in patients with mitral stenosis whereas RV myocardial
performance index was significantly increases, revealing an impaired
RV systolic and diastolic dysfunction. This study was done in patients
with mild to moderate mitral stenosis without symptoms thus suggesting
that subclinical RV dysfunction was present even in asymptomatic
patients. [42] In a study by Mahfouz et al, RV dysfunction was identified
in all patients with mitral stenosis irrespective of the presence of
pulmonary hypertension. Echocardiographic parameters most useful in
tricuspid annulus Doppler indices.[43] Sadeghpour et al observed that
measurements of dP/dt and dP/dt/Pmax, have a good correlation with
RV systolic function and functional capacity.[44]
3.5.5 Evidence based medicine: improvement in RV function after
PTMC
Recent times have witnessed several studies which have
addressed the issue of right ventricular function after PTMC in
rheumatic mitral stenosis. Burger et al evaluated right ventricular
hemodynamics in 19 patients with rheumatic mitral stenosis at rest, after
supine bicycle exercise and after valvuloplasty. They found a significant
depression of RV function at rest in such patients with further
worsening during exercise and with dramatic improvement immediately
after PTMC, both at rest and after exercise. This improvement was
mainly attributed to an increase in RV stroke volume in this study. [45] In
another study done by Mohan et al, 25 patients underwent RV
functional assessment immediately after PTMC and at one year after
PTMC with the help of Doppler method. They found a significant
prolongation of right ventricular ejection times with a decrease in
isovolumic intervals, which gradually improved over time. In this study,
Drighil et al studied RV function indices in 12 consecutive
female patients with isolated rheumatic mitral stenosis and observed that
there was a significant improvement in infundibular and global RV
function after PTMC as evidenced by RVOT fractional shortening and
Tei index. However, this study also observed a decrease in RV
contractility immediately after PTMC, which the authors partly
attributed to the echocardiographic methods.[47] Rahmanet al measured
TAPSE, RV Tei index and systolic myocardial velocities by Doppler
studies and concluded that there was a decrease in RV contractility
immediately after PTMC but other RV function parameters measured by
the RVOTfs and Tei index showed a significant improvement.[48] In a
study by Hamdy et al, the use of 3D echocardiography in post PTMC
scenario revealed a significant improvement of RV systolic dysfunction
after 3 months in 38.46% of patients, with significant improvement of
dp/dt/EDV 3D index, with a near doubling of this percentage after 6
months.[49] Kundu et al assessed the RV function before and after
PTMC in 50 patients with mitral stenosis. They observed that there was
a significant improvement in global and regional RV function as
measured by the RVOT FS% and the RV Tei index which showed a
significant increase. This study showed a significant decrease in RV
4. MATERIALS AND METHODS
4.1 STUDY DESIGN
The present study was a prospective study based on an
interventional procedure conducted in the Department of Cardiology,
Madras Medical College and Rajiv Gandhi Government General
Hospital for a period of three months starting January 2014. Informed
written consent was obtained from all patients prior to the start of the
study. Institutional Ethics committee approval was obtained.
4.2 STUDY POPULATION: PATIENT SELECTION
The target number of patients for this study was 30. The criteria
for selection of patients were as follows:
Inclusion criteria:
Symptomatic patients with moderate to severe MS with MVO
<1.5 cm2 with valve morphology suitable for PTMC.
Exclusion criteria:
1. MR grade>2
3. Bicommissural calcification.
4. Wilkins score >8
5. Associated significant aortic valve lesions
6. Associated congenital heart defects requiring surgical repair
7. Patients unwilling for the procedure.
4.3 METHODS
All eligible patients underwent a detailed history and clinical
examination. Echocardiographic evaluation was done for all patients
with Philips HD7XE echocardiographic machine. Various
echocardiographic parameters measured were as follows:
1. LV EF%
2. MVO by planimetry and pressure half time
3. Trans mitral mean gradient
4. Trans mitral peak gradient
7. TAPSE by apical four chamber view
8. TRPG by apical four chamber view
9. RVOT FS% by parasternal short axis view at aortic valve level
10.RV Tei index by pulse Doppler method
11.RV IVA by tissue Doppler method at lateral tricuspid annulus.
All parameters were measured before and within 48 hours after
completion of the interventional procedure. The patients’ clinical details
and echocardiographic values were entered in a proforma and later
tabulated for statistical analyses.
4.4 INTERVENTION DETAILS
All eligible patients were administered intravenous pre operative
antibiotics 30 minutes before the procedure. Catheterisation was done
through both femoral vein and femoral artery on the right side by
modified Seldinger technique. Interatrial septal puncture was performed
by Hung’s technique using the Mullins sheath and Brockenbrough
needle. A coiled LA guidewire was introduced through the sheath into
the LA. The puncture site was dilated with septal dilator. Accura mitral
using Hung’s formula) was positioned into the LA. The coiled
guidewire was replaced with a stylet. By various techniques, mitral
valve was crossed with Accura balloon and the balloon was inflated to
dilate the orifice. The procedure was done under transthoracic
echocardiographic and fluoroscopic guidance. After each dilatation, the
mitral valve area by planimetry and severity of MR were assessed. The
dilatation was repeated until the MVO increased by >50% from baseline
or development of MR grade >2.
4.5 RESULTS TABULATION AND ANALYSIS METHODS
The results obtained were tabulated in Microsoft Excel format.
The results were analysed using the student’s t tests for paired data with
the help of the SPSS version 20 statistical software. Weighted kappa
agreement statistics was used for comparing the various methods of RV
5. RESULTS AND ANALYSIS OF
OBSERVED DATA
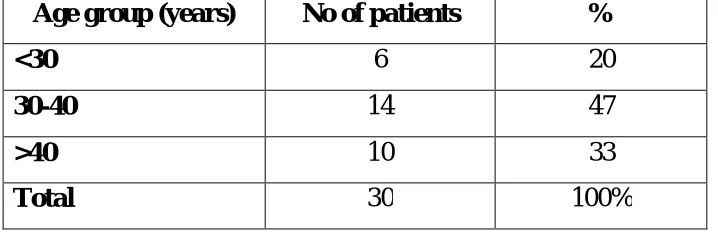
This prospective intervention based study comprised of 30
consecutive eligible patients who underwent PTMC at the department of
Cardiology, Rajiv Gandhi Government General Hospital. The mean age
of the patients in this study was 35+6.6 years (range 21-48 years). Forty
seven percent of patients were between 30 and 40 years, whereas 33%
of patients were between 40 and 50 years. The age distribution of
[image:53.612.135.494.444.560.2]patients is shown in table 7.
Table 7: Age distribution of patients
Age group (years) No of patients %
<30 6 20
30-40 14 47
>40 10 33
Total 30 100%
The study predominantly comprised of female patients with 83%
Table 8: Sex distribution
Sex No of patients %
Male 5 17
Female 25 83
Total 30 100
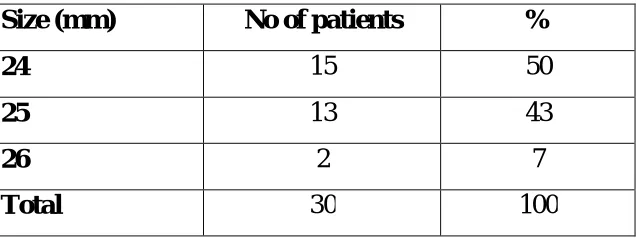
The size of the catheter used was 24 in 50% of patients (n=15),
25 in 43% of patients (n=13) and 26 in 7% (n=2)
Table 9: Size of catheter used
Size (mm) No of patients %
24 15 50
25 13 43
26 2 7
Total 30 100
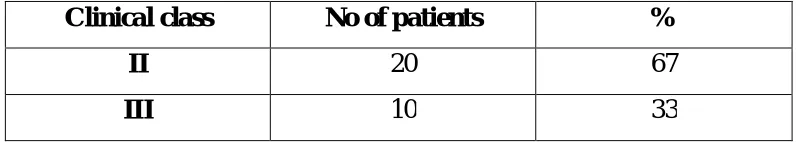
Twenty patients (67%) had NYHA class III symptoms prior to the
start of the procedure. LV function was normal in all patients at the start
of the procedure and remained normal throughout the procedure and
thereafter. There was no significant change in LV function after the
procedure. Mitral regurgitation was present in 22 patients at baseline
with 16 patients having trivial MR and six patients having mild
[image:54.612.156.476.339.458.2]having trivial MR, 16 patients with mild MR and two patients with
moderate MR. None of the patients had >grade 2 MR as to define an
[image:55.612.118.509.222.384.2]unsuccessful PTMC. The results are shown in tables 10.and 11
Table 10: Mitral regurgitation at baseline and post procedure
Severity
Baseline Post procedure
No of
patients %
No of
patients %
Nil 8 26 2 7
Trivial 16 53 10 33
Mild 6 21 16 53
Moderate 0 0 2 7
Table 11: Pre procedure NYHA Clinical class
Clinical class No of patients %
II 20 67
III 10 33
The mean values of various echocardiographic parameters pre
and post procedure is shown in table 12. A comparison of values before
and after the procedure was done to determine the success of the
[image:55.612.113.514.462.533.2]II/III to class I. All patients had a successful PTMC by standard
[image:56.612.115.510.219.589.2]definition using MVO as the gold standard parameter.
Table 12: Echocardiographic parameters: pre procedure versus
post procedure
Parameter
Pre
procedure
Post
procedure P value
Mean + SD Mean + SD
TAPSE (mm) 17 + 2.3 25 + 3.3 <0.001
RVOT FS (%) 32 + 4 45 + 4.6 <0.001
RV Tei index 0.35 + 0.1 0.22 + 0.1 <0.001
IVA (m/sec2) 2.9 + 0.7 2.0 + 0.5 <0.001
TRPG (mm Hg) 57 + 7.7 38 + 4.2 <0.001
MVO (cm2) 0.8 + 0.1 1.57 + 0.12 <0.001
LA size (cm) 4.5 + 0.3 4.1 + 0.2 <0.001
Mean gradient (mm Hg) 15 + 2.3 6.5 + 1.2 <0.001
Peak gradient (mm Hg) 28 + 4.36 13 + 2.6 <0.001
The major LV parameters measured were the MVO, LA size,
mean gradient and peak gradient. All parameters correlated with a
Changes in LV parameters: MVO
All patients had an increase in pre procedure MVO to > 1.5 cm2.
The mean MVO at baseline was 0.8+0.1 cm2 which increased to
1.57+0.12 cm2 after the intervention. The increase was statistically
significant with a ‘p’ value of 0.001. Of the 30 patients, 14 patients
(46%) had an increase of 50-100%, 13 patients (44%) had an increase of
100-150% and three patients (10%) had an increase of >150% in the
[image:57.612.136.490.372.558.2]MVO as compared to the baseline. The results are shown in table 18.
Table 18: Change in LV parameters: MVO
Percentage increase No of patients %
50-100% 14 46
100-150% 13 44
>150% 3 10
Total 30 100
P value <0.001
Changes in LV parameters: LA size
The LA size decreased from a mean of 4.5+0.3 cm to 4.1+0.2 cm
LA size immediately after the procedure. The results were statistically
[image:58.612.130.495.188.347.2]significant (p<0.001) and are shown in table 19.
Table 19: Change in LV parameters: LA size
Percentage decrease No of patients %
<10% 18 60
>10% 12 40
Total 30 100
P value <0.001
Changes in LV parameters: Mean and peak gradient
The mean gradient across the MV decreased from a mean of
15+2.3 mm Hg to 6.5 + 1.2 mm Hg. The peak gradient also decreased
from 28+4.3mm Hg to 13+2.6mm Hg. The decrease in gradient was
between 40-60% in about two thirds of patients. The values were
statistically significant (p<0.001 for mean gradient and p<0.001 for peak
Table 20: Change in LV parameters: mean gradient
Percentage decrease No of patients %
<40% 2 6
40-60% 20 66
>60% 8 28
Total 30 100
P value <0.001
Table 21: Change in LV parameters: peak gradient
Percentage decrease No of patients %
<40% 2 6
40-60% 20 66
>60% 8 28
Total 30 100
[image:59.612.136.490.384.568.2]Changes in RV parameters: TAPSE
The mean baseline TAPSE was 17+2.3mm as compared to the
post procedural TAPSE of 25+3.3mm.There was a significant increase
in post procedural TAPSE with 63% of patients (n=19) having an
increase of 30-60%. Eight patients had an increase in TAPSE of >60%
from baseline (27%). The difference was statistically significant with a
‘p’ value of <0.001. The results are shown in table 13.
Table 13: Change in RV parameters post procedure: TAPSE
Percentage increase No of patients %
<30% 3 10
30-60% 19 63
>60% 8 27
Total 30 100
[image:60.612.127.496.351.719.2]P value <0.001
Figure 3: Change in TAPSE
10 15 20 25 30 35
Changes in RV parameters: RVOT FS%:
The mean RVOT FS% increased from 32+4% at baseline to
45+4.6% post procedure. The increase in RVOT FS% was also
statistically significant with 83% of patients having an increase in
RVOT FS% of 30-60%. Four patients had an increase of <30% from
baseline whereas one patient had an increase of >60% from baseline.
[image:61.612.134.488.315.686.2]The ‘p’ value obtained was <0.001. The results are shown in table 14.
Table 14: Change in RV parameters: RVOT FS%
Percentage increase No of patients %
<30% 4 13
30-60% 25 83
>60% 1 4
Total 30 100
P value <0.001
Figure 4: Change in RVOT FS%
25 30 35 40 45 50 55 60
Changes in RV parameters: IVA
A comparison of IVA values pre and post procedure was done.
The mean IVA decrease from 2.9+0.7 m/sec2 to 2.0+0.5 m/sec2 after the
intervention It was observed that all patients had a decrease in IVA after
the procedure, of which 30% of patients had a decrease of <20% and
46% of patients had a decrease of 20-40%. Seven patients had a
decrease of >40% in IVA. The values were statistically significant with
a ‘p’ value of <0.001. The results are shown in table 15.
Table 15: Change in RV parameters: IVA
Percentage decrease No of patients %
<20% 9 30
20-40% 14 46
>40% 7 24
Total 30 100
[image:62.612.141.476.354.682.2]P value <0.001
Figure 5: Change in IVA
0.5 1.0 1.5 2.0 2.5 3.0 3.5 4.0
Changes in RV parameters: RV Tei index
The RV Tei index decreased significantly in all patients with 40%
of patients having a decrease of <25% and 36% of patients having a
decrease of 25-50% from baseline. Seven patients had a decrease of
>50% from baseline. The post procedure Tei index was 0.22+0.1 as
compared to baseline mean of 0.35+0.1 The results were statistically
[image:63.612.135.494.350.488.2]significant (p<0.001) and are shown in table 16.
Table 16: Change in RV parameters: RV Tei index
Percentage decrease No of patients %
<25% 12 40
25-50% 11 36
>50% 7 24
Total 30 100
P value <0.001
Figure 6: Change in RV Tei index
0.0 0.1 0.2 0.3 0.4 0.5
[image:63.612.146.475.359.679.2]Changes in RV parameters: TRPG
All patients had a decrease in TRPG immediately after the
procedure. The TRPG decreased significantly from baseline by 20-40%
in 21 patients (70%) and by >40% in six patients (20%). The mean
TRPG value decreased from 57+7.7mm Hg to 38+4.2mm Hg. The value
was statistically significant with a p value of <0.001. The results are
[image:64.612.141.478.276.682.2]tabulated in table 17.
Table 17: Change in RV parameters: TRPG
Percentage decrease No of patients %
<20% 3 10
20-40% 21 70
>40% 6 20
Total 30 100
[image:64.612.144.483.320.463.2]P value <0.001
Figure 7: Change in TRPG
20 30 40 50 60 70
Agreement and Weighted kappa statistics
A comparison of the various RV parameters was done with MVO
as the gold standard to determine the better parameter of assessing
improvement in RV function immediately after a successful procedure.
The statistical method used was the inter observer agreement with
weighted kappa statistics. According to the definition of weighted kappa
statistics, the agreement was rated as fair, moderate or good. It was
observed that the parameter having the best agreement with MVO
(successful PTMC) was IVA ( =0.50) followed by the RV Tei index
=0.44). This was better than the agreement scores obtained for the
other standard RV parameters like TRPG ( =0.21, moderate agreement)
TAPSE ( =0.11, fair agreement) and RVOT FS% ( =0.34, moderate
agreement). The results were statistically significant and are
[image:65.612.117.509.442.665.2]shown in table 22.
Table 22: Kappa statistics
Parameter Kappa value
(95% CI) P value Agreement
TAPSE 0.11(0.02-0.36) <0.001 Fair
IVA 0.50(0.25-0.74) <0.001 Moderate
RV Tei index 0.44(0.22-0.67) <0.001 Moderate
TRPG 0.21(0.04-0.45) <0.001 Fair
Post procedural Complications:
Major complications like death, pulmonary oedema and severe
MR were not seen in our patients. Local vascular complications in the
form of hematoma were seen in two patients which resolved with
conservative management. None of the patients had AV fistula or
6. DISCUSSION
Rheumatic heart disease and the long term consequences of mitral
stenosis pose a major challenge even today in many developing
countries including India. Over the years, there has been a lot of
research to understand the enigmatic pathophysiology and timing of
intervention in the management. Though there has been good progress, a
lot of questions still remain unanswered, thus contributing to the
morbidity associated with this condition. In the recent past, the focus
has shifted from the left ventricle to the right ventricle and it has been
reasonably established that it is the right ventricle which is responsible
for the symptoms occurring due to mitral stenosis. Several studies have
also established the fact that the functional status of the right ventricle is
the key to timely intervention and has often been referred to as the
“forgotten chamber”.
The best assessment of the functional status of the RV has still
not been established due to its complex morphology and heterogeneity
of the available methods. Currently the best parameter available for
assessment of RV functional status appears to be cardiac MRI, due to
the advantages of higher image resolution and ability to calculate three
equipment and reporting personnel which may not be feasible at all
centres. Echocardiography is a useful alternative which is as effective as
MRI and is advantageous in terms of wide availability, lesser cost and
simplicity of the procedure. It can also be performed in patients who
have standard contraindications for MRI. Among the various parameters
available for the assessment of RV function, there is no gold standard at
present due to lack of standardization. This study was mainly conducted
to assess the functional changes occurring in the right ventricle after a
PTMC and also to assess the parameter that correlated best with a
successful PTMC.
The mean age of patients in our study was 35+6.6 years which is
in concordance with world literature. The study population was
predominantly female, which is consistent with the epidemiology of the
disease. The average age of patients in various studies ranges from
28-36 years with a predominance of patients over the age of 30 years.
The mean mitral valve orifice increased from 0.8+0.1cm2 before
the procedure to 1.57+0.12 cm2 immediately after the procedure.
This is similar to that observed in several studies as shown in the
Table 23: Change in mitral valve area after PTMC
Study Pre procedure
(cm2)
Post procedure
(cm2)
P value
Hasan Ali[51] 0.9+0.2 2.0+0.4 <0.0001
Drighil[47] 0.91+0.29 1.86+0.43 0.0001
Kundu[50] 0.8+0.1 4.4+0.3 <0.001
Toufiqur
Rahman[48]
0.82+0.11 1.75+0.27 <0.01
Sadeghian [52] 1.0+0.2 1.7+0.4 <0.001
Our study 0.8+0.1 1.57+0.12 <0.001
The changes in RV parameters after PTMC obtained in the
present study were similar to those observed in other studies. The mean
TAPSE in our study was 17+2.3 mm and this is comparable to that seen
in a study by Drighil et al where it was observed to be 17+2.3 mm. [47]
There was a significant increase in the post procedural TAPSE in this
study (25+3.3 mm).
Similar results were also observed with RVOTfs%. The baseline
RVOTfs% observed in our study was 32+4% which significantly
observed that the RVOTfs% increased from 57+15% to 72+12% after
the procedure (p=0.002).[47]Similar values were obtained in the study by
Kundu et al where the RVOTfs% increased from 54.9+4.6 % to
74.9+4.8% (p<0.001). [50]Rahman et al observed an increase of
RVOTfs% from 55+13 % to 71+13% (p=0.002). [48]Although the
absolute values obtained in the present study are lesser than those
observed in other studies, the extent of change is comparable.
The RV Tei index decreased from 0.35+0.1 to 0.22+0.1 in the
present study (p<0.001) and is comparable to that obtained in the studies
by Drighil et al (0.44+0.25 to 0.29+0.17; p=0.02), Kundu et al (0.5+0.1
to 0.3+0.1; p<0.001), and Rahman et al (0.42+0.02 to 0.27+0.11;
p=0.021). [47][50][48]There was a significant decrease in the RV Tei index
in the present study which indicates improvement of global RV
function. Similar conclusions were obtained in studies done by Drighil
et al and Kunduet al.[47] [50]
The IVA values in our study decrease by about 30% from
baseline (2.9+0.7 to 2.0+0.5 m/sec2, p<0.001) and this is comparable
with results obtained by Kundu et al and Rahman et al where a similar
concluded that IVA was the most useful parameter in assessing
RV function. [47] IVA has been found to be a very valuable marker for
assessment of RV function and has shown to have highest correlation
with RV systolic function as obtained by MRI in a few studies. It has
also been found to have a good correlation with the severity of mitral
stenosis and also in predicting RV systolic dysfunction even before the
onset of symptoms. In two different studies by Tayyareci et al, the IVA
proportionately decreased with increasing severity of MS and also had a
significant negative correlation with the RV Tei index in patients with
MS. The authors concluded in this study that it was a very useful non
invasive tool to detect early RV dysfunction. [53][54]The major drawback
with use of IVA is the lack of standardization. Its role as the marker for
RV function needs to be evaluated in large scale trials for it to become
the gold standard.
Agreement statistics in the present study concluded that IVA had
highest correlation with the increase in mitral valve area ( =0.50;
p<0.001) closely followed by the RV Tei index ( =0.44; p<0.001). This
agreement was significantly higher than that obtained for the standard
parameters such as TRPG and TAPSE. Drighil et al concluded that the
with subsequent decrease in RV contractile function. They also found
that IVA was more sensitive marker of RV function than myocardial
systolic velocities because of the reason that myocardial motion
disturbances occurred most commonly during the isovolumic phases.
They also concluded that since Tei index is sensitive to load, it may be
less sensitive in predicting global RV function improvement when
compared with IVA which is not load dependent. [47]
Limitations of the study:
1. There were several limitations in this study. There was no
control population and hence a comparison of parameters with
those of study group was not possible, leading to absence of
standardization in this population.
2. The study sample was small, hence it needs to be evaluated
whether the results obtained in this study would generalize to
other patients groups or not. Clinical trials with larger study
populations are needed to assess this.
3. This study evaluated only the immediate effect of PTMC on
on RV function parameters need to be evaluated in follow up
studies to assess the usefulness of the parameters.
4. IVA values have not been standardized using a control
population; hence there is a lack of standard reference values.
Another disadvantage with using IVA as a marker of RV
function is that it is angle dependent and hence there is a
possibility of inter-observer and intra-observer variability.
5. All patients in this study had severe mitral stenosis and it
remains unclear whether similar results would apply to
patients with moderate MS also.
The results of this study need to be validated in larger trials with a
larger number of patients. IVA is a newer echocardiographic parameter
for assessing the RV global function rather than regional function which
is more important in mitral stenosis. However, there is very limited
number of studies to assess the usefulness of IVA in MS with no
standard reference values. Once the parameter is validated in large scale
studies, it will probably become an important marker of RV systolic