Abstract: Machine learning is an application of artificial intelligence which has proved to be a major breakthrough in the field of medical sciences to take care of healthcare sector especially in diagnosing of diseases. In recent times, various studies have shown there is a high percentage of population across the worlds who are suffering from diabetes. It is quite well-known fact that due to high content of blood sugar levels in human beings results in such a metabolic disordered disease. The rapid growth of diabetes is well known reality in today’s world due to unhealthy lifestyles, processed food, lack of health awareness and proper physical exercises. It is important to note that diabetes can cause visual disturbances, pancreas malfunction, nerve damage, heart diseases, kidney damage, fatigue and lack of energy, excessive urination, gastroparesis, damaged blood vessels, foot problems, dry and cracked skin etc and few other chronic diseases. Therefore, it becomes necessary to detect and diagnose diabetes at an early stage. The proposed work in this research deals with the classification of people who are diagnosed with diabetes using Classification algorithms such as Logistic Regression (LR), Random forest, SVM, KNN, Gradient boosting (GB) and Decision tree(DT). The experiment showed that KNN algorithm gave better results than when compared with other classified algorithms. The results showed an accuracy of 85% was achieved.
Index Terms: Accuracy, Classification, Data mining, Algorithms
I. INTRODUCTION
Data science has played important role in providing vital source of information which has helped business establishments, IT sectors and others research organizations. The collection large volume of data (structured/unstructured) has helped many organizations to make opportunities to make a mark in research fields.
Data Science solutions has provided revolution in Healthcare sectors have benefited from data science in exploring drugs, genetic diseases etc. Thus, there is a lot potential in this area that needs to be explored further to benefit society as a whole. There are many algorithms that are available in Machine learning that provide a greater degree of accuracy in predicting outcomes based on the input data and with use of statistical analysis.
Revised Manuscript Received on May 06, 2019
Dr. Y. J. Nagendra Kumar, Professor, Department of Information Technology, Gokaraju Rangaraju Institute of Engineering and Technology, JNTUH, Hyderabad, India.
N. Kameswari Shalini, Department of Information Technology, Gokaraju Rangaraju Institute of Engineering and Technology, JNTUH, Hyderabad, India.
P.K. Abhilash, Department of Information Technology, Gokaraju Rangaraju Institute of Engineering and Technology, JNTUH, Hyderabad, India.
K. Sandeep, Department of Information Technology, Gokaraju Rangaraju Institute of Engineering and Technology, JNTUH, Hyderabad, India.
D. Indira, Department of Information Technology, Gokaraju Rangaraju Institute of Engineering and Technology, JNTUH, Hyderabad, India.
A classification is a division in a system which divides things into groups or types. Various Classification algorithms used to predict the target class. Some of the commonly used algorithms are regression techniques, KNN, Gradient Boosting, Random forest method, SVM etc.
An analysis is done on algorithms like Logistic regression, SVM, KNN, Random forest, gradient boosting and Decision tree to compare their classification accuracy in diagnosing diabetes.
II. LITERATURESURVEY
Deepti Sisodia, Dilip Singh Sisodia [1] (2018): In order to predict diabetes, they have use classification algorithms like naïve Bayes, decision tree and SVM. The highest accuracy obtained was 76.3% which was given by naïve Bayes algorithm.
Tejas N. Joshi, Prof Pramila N. Chawan [2] (2018): They proposed an effective system for early detection of diabetes and used algorithms like SVM, ANN, and Logistic Regression for prediction.
Dr. Y. Jeevan Nagendra Kumar et. al [3] (2017): Projected that Map centered spatial analysis of rainfall data of AP and TS states is made using Hybrid machine learning methods.
Priyanka Indoria, Yogesh Kumar Rathore [4]: proposed a system for prediction of diabetes. They have used algorithms like artificial neural networks and Bayesian network for their system. Their work focuses on recent developments in machine learning which have made significant impact in detection and diagnosis of diabetes.
Dr. Y. Jeevan Nagendra Kumaret. al [5] (2016): For supervision of knowledge discretion and get reasonable grain access control.
Akansha Rathore, Simran Chauhan [6]implemented decision tree and SVM classification algorithms for the analysis and prediction of diabetes. They have used R Framework for their system.
Dr. Y. Jeevan Nagendra Kumaret al [7] (2014): Proposed a new symbol-based tree traverse searching scheme.
Hrushikesh N. Mhaskar et al [8]used MATLAB data mining tool for classification process to predict glucose level in diabetic patients.
Aishwariya R, Gayathri P, Jaysankar N [9] (2013) proposed algorithms for prediction of diabetes. The promising machine learning algorithm used by them was Support Vector Machine (SVM).
Dr. Y. Jeevan Nagendra Kumaret al [10] (2013): Provided a thorough information of the exertions of this area and our world is advancing with a lot of concerns on bio-diversity, science and technology and many more.
Prediction of Diabetes using Machine Learning
Abdullah A. Aljumah et al [11] (2013) used regression-based machine learning techniques for predictive analysis of diabetes. Theyemployed Oracle Data Mining software tool. Algorithm used for analysis was SVM.
IoannisKavakiotis et al [12] (2017)implementedsupport vector machine (SVM) classification algorithm for their proposed work.
Dr. Y. Jeevan Nagendra Kumar et al [13] (2013): developed a greedy method in minimizing number of points and spatial mining is used to recognise solution for it.
NongyaoNai-aruna, RungruttikarnMoungmaia [14] (2015) developed a system to determine the occurrence of diabetes. The algorithms used by them wereDT, ANN, Random Forest, LR and NB classifier.
Sajida Perveena et al[15] (2016), implemented three classifiers which are bagging, adaboost and J48 decision tree for prediction of diabetes. J48 produced better results. D. Asir Antony Gnana Singh et al[16] (2017), Machine learning algorithms like naïve Bayes, random forest and MPL are used for analysis and prediction of diabetes. Better results were obtained with random forest classification algorithm.
III. METHODOLOGY Diabetic dataset:
The dataset for prediction of diabetes is obtained with the help of medical reports of patients from Kaggle community. The dataset consists of 768 rows and 9 attributes which contribute in prediction of diabetes. The parameters chosen from dataset include various attributes Blood Pressure, Skin Thickness, Insulin, BMI, Diabetes_Pedigree_Function, Age etc.
Diabetes database
Data pre-processing
Applying various Classification algorithms KNN, SVM, Logistic Regression, Random forest, Decision tree, Gradient Boosting
Performance evaluation of algorithms
Comparative analyses of algorithms based on accuracy
[image:2.595.315.545.99.286.2]Result
Fig 1: Model of the process Data Pre-processing:
1. Outlier analysis:
It is a point in the observation which is isolated from all other observations. The exact cause of outlier is due to measurement variability or due to experimental error. There are two types of outliers which includes univariate and multivariate. Outliers observed in a single space feature are called univariate outliers while those observed in n-dimensional space are called Multivariate outliers.
2.
Discover outliers with visualization tools:
i.
Univariate plot:
[image:2.595.49.279.450.589.2]Box Plot:It is a graphical method describing numerical data through their quartiles. Such graphical figures have vertical lines extended from boxes and variability part is displayed outside upper and lower quartiles as shown below:
Fig-2: Box Plot
Above plot shows few points which are outliers as they are not included in the box of other observation.
ii.
Multivariate plot:
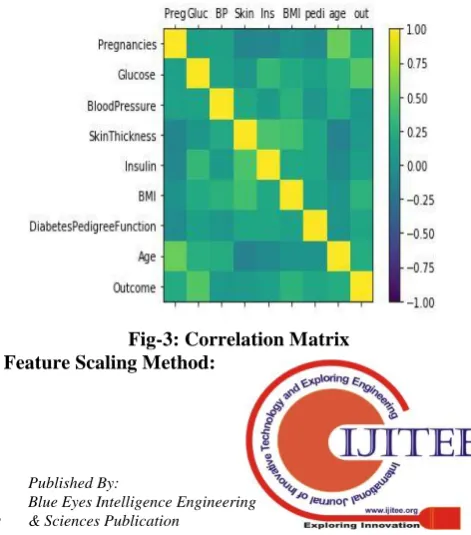
1) Correlation Matrix Plot:Correlation is a statistical tool that helps in understanding how two variables are correlated and effect of one over the other,that is whether they are positively or negatively correlated.If both variables move in the same direction that is increase or decrease in one variable, increases or decreases the other then they are said to be positively correlated while if they move in opposite directions then they are negatively correlated.In case if there is no effect in directions between two variables then there is no correlation.
Correlationbetween each pair of attributesis calculated and represented in matrix form and then these variables are plotted to understand degree of correlation. These techniques will help in predicting the behaviour of how machine learning algorithms work.It is important to note that whether linear or logistic regression can show poor performance even if there is highlydegree of correlated input variables in the data.
[image:2.595.307.543.567.835.2]It is a standardized method for studying independent variable range data. Data is normalized during pre-processing stage.
Min Max ScalarMethod:
It is a Min-max normalization strategy. This method uses linearly transformation technique such as
x to y= (x-m)/(M-m). Where, m=min, M=max
Z-score:
It is ameasure of number of standard deviations over or above the population mean.
The formula is:
z = (x – μ) / σ
Algorithms: The following algorithms are used in the study and some salient features of each algorithm are discussed in brief. For further details of each of the algorithms used in our proposed workcan be referred from the available sources. 1. KNN:KNN model uses K nearest neighbours that stores
possible cases and differentiates them based on measure of similarity to arrive at new cases. This algorithm mainly used for statistical estimation and pattern recognition. It is a non-parametric technique. Majority vote among its neighbours is measured by a distance function. The various distance functions available are:
-Distance Function: i. Euclidean ii. Manhattan iii. Minkowski
2. LR:This is used in the analysis of dataset containing independent variables through which results can be determined. This is obtained by a variable having only two possible outcomes. The logistic function is given below:
Where t stands for the real input value. 3. SVM: It is a supervised learning algorithm. In this, each
data point is plotted with respect to the number of features available. Then, differentiation is done by finding the hyper-plane that separates the two chosen classes.
4. Random Forest:This algorithmcan be used for both regression and classification challenges. This algorithm produces great results even without hyper-parameter tuning. 5. DT:This algorithm falls under supervised learning. Incongruous to other algorithms, DT is used to solve classification challenges.Firstly, a training model is created that can be used topredict target variables by learning decision rules can be well-ascertained from training data.
pilog2pi
6. GB:This algorithm generates a predictive model through weak predictive models, unlike DT.The model is built in a gradation manner compared to other models; it also optimizes loss function.
IV. RESULTSANDDISCUSSION
This research work is implemented in Anaconda Distribution which is a free and open- source distribution. The programming languages used were Python and R languages for scientific computing applications and for analysis purposes(data science, machine learning applications, predictive analysis, etc.) were used.
In this experiment, the classification algorithms are applied on all 9 attributes and the results are based on the following terms:
True Positives (TP): It stands for the correctly predicted positive value that is if the value of actual class and predicted class are yes. It is denoted by tp.
True Negatives (TN):It stands for the correctly predicted negative value that is if the value of actual class and predicted class are no. It is denoted by tn.
False Positives (FP): It stands for if actual class is no and predicted class is yes. It is denoted by fp.
False Negatives (FN):It stands for if predicted class is noand actual class is yes. It is denoted by fn.
i.
Precision (p)
:It is defined as the number of positive observations which are truly predicted divided by the total number of positive observations predicted.
p =
ii. Recall (r):It is defined as the fraction of accurately positively predictedobservations to the total predictedobservations in the class.
r =
iii. F1 score: It is described as the measure of accuracy of tests performed. It takes measuresthat are recognised as both false positives and negatives into consideration.
F1 Score =
iv. Accuracy: It is the most intuitive performance measure parameter and is defined as accurately predicted observation divided by the total observations.
Accuracy =
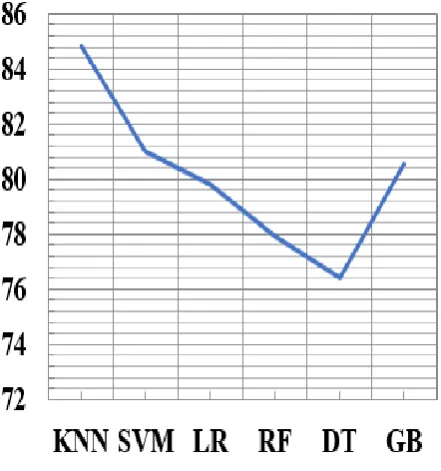
Fig-4: Accuracy
The figure shows there is steep fall from gradient boosting to decision tree and there is a monotonically sharp rise in the curve for each of the algorithms.
From the plot it is clear that KNN algorithm showed better results for chosen data set and gave a greater degree of accuracy.
[image:4.595.295.548.100.667.2]v. Classification report:The classification report deals with scores in the tabular form for the above identified parameters chosen for the study of the proposed work.
Fig-5: Precision
Fig-6:Recall
Fig-7: F1-score
AUC (Area under curve): AUC provides a comprehensive measure of performance across all possible classification thresholds. It measures how well predictions are ranked, comparatively than their absolute values. This is shown in figure below for each of the
algorithms under study. 0.7
0.75 0.8 0.85
KNN SVM LR RF DT GB
Recall
Fig-8:AUC
V. CONCLUSION
Identification of diabetes at an early stage is main objective which of course is true to say. In this work, a comparative analysis is performed on six different algorithms and performance is evaluated by using various set of parameters identified for the given data set. The analysis is done on a diabetes database collected from Kaggle community. Our experimental results showed that KNN classification algorithm has produced better accuracy in predicting diabetes in comparison to other algorithms used for analysis.
The work done in the paper can be further improved in the future by identifying some more machine learning algorithms to achieve better accuracy and results.
REFERENCES
1. Deepti Sisodia, Dilip Singh Sisodia,”Prediction of Diabetes using Classification Algorithms”, Science direct
2.Tejas N. Joshi, Prof Pramila N. Chawan,“Diabetes Prediction Using Machine Learning Techniques “, ISSN: 2248-9622, Vol. 8, Issue 1, IJERA.
3. Y. Jeevan Nagendra Kumar, Dr. T. V. Rajini Kanth, “GIS-MAP Based Spatial Analysis of Rainfall Data of Andhra Pradesh and Telangana States Using R”, International Journal of Electrical and Computer Engineering (IJECE), Vol 7, No 1, February 2017, Scopus Indexed Journal, ISSN: 2088-8708.
4.Priyanka Indoria, Yogesh Kumar Rathore,“A Survey: Detection and Prediction of Diabetes Using Machine Learning Techniques”, ISSN: 2278-0181, Vol.7, IJERT
5.Y. J. Nagendra Kumar, M Chander“A Better Search Optimization for Multidimensional Queries over Cloud on Encrypted Data”, International Journal for Research on Electronics and Computer Science (IJRECS), May-June 2014, V-1,I-2 ISSN: 2321-5484
6.Akansha Rathore, Simran Chauhan,“Detecting and Predicting Diabetes Using Supervised Learning: An Approach towards Better Healthcare for Women”, ISSN No. 0976-5697, Volume 8, IJARCS.
7.Y. Jeevan Nagendra Kumar,M. Swetha “An Encryption Scheme with Supportable Allocation in Cloud Computing”, International Journal of Innovation Technology and Research (IJITR), Volume No. 4, Issue No. 6, October – November 2016, ISSN: 4783 – 4785.
8.Hrushikesh N. Mhaskar, Sergei V. Pereverzyev, Maria D.van der Walt,” A Deep Learning Approach to Diabetic Blood Glucose Prediction”, frontiersin.
9.Aishwariya R, Gayathri P, Jaysankar N, “A Method for Classification Using Machine Learning Technique for Diabetes”, International Journal of Engineering and Technology (IJET), 5 (2013), pp. 2903-2908 10. [10]Y. Jeevan Nagendra Kumar, Dr. T.V. RajiniKanth,“Web GIS Mining
for Effective Retrieval of Remote Sensed Data: A Survey Paper”, International Conference on Advanced Computing Methodologies 2013. ISBN No: 9789351071495
11. [11]Abdullah A. Aljumah, Mohammed GulamAhamad, Mohammad Khubeb Siddiqui, “Application of data mining: Diabetes health care in
young and old patients”, Journal of King Saud University-Computer and Information Sciences, 25 (2013), pp. 127-136
12. [12]IoannisKavakiotis, Olga Tsave, Athanasios Salifoglou, NicosMaglaveras, IoannisVlahavas, IoannaChouvarda,“Machine Learning and Data Mining Methods in Diabetes Research”, Computational and Structural Biotechnology Journal, 15 (2017), pp. 104-116
13. [13]Y. JeevanNagendra Kumar, Dr. T. V. Rajinikanth, Mohana Krishna, “Optimal Distribution of mobile network towers: an approach through Geo Spatial Data Mining”, International Conference on Advanced Computing Methodologies 2013. ISBN No: 9789351071495
14. [14]NongyaoNai-aruna, RungruttikarnMoungmaia,“Comparison of Classifiers for the Risk of Diabetes Prediction”, Procedia Computer Science, 69 (2015), pp. 132-14
15. [15]Sajida Perveena, Muhammad Shahbaza, Aziz Guergachib, Karim Keshavjeec,“Performance Analysis of Data Mining Classification Techniques to Predict Diabetes”, Procedia Computer Science, 82 (2016), pp. 115-121
16. [16]Dr. D. Asir Antony Gnana Singh, Dr. E. JebamalarLeavline, B. ShanawazBaig, “Diabetes Prediction Using Medical Data”, ISSN 0973-385X Volume 10, Number 1 (2017) pp. 1-8
AUTHORSPROFILE
Dr. Y. Jeevan Nagendra Kumar, obtained his Ph.D in Computer Science and Engineering from Acharya Nagarjuna University, Guntur, AP in 2017 and M.Tech Computer Science Technology from Andhra University in 2005. He is working as Professor and Dean - Technology and Innovation Cell in GRIET since 2005.
He has about 12 Research Papers in International / National Conferences and Journals and also attended many FDP Programs to enhance his knowledge. With his technical knowledge he guided the students in developing the useful Web applications and data mining related products. As B O S member was able to introduce new subjects, topics in UG / PG Courses. Students are encouraged to work on research projects, engineering projects as well as for industrial training.
He is acted as Coordinator for 3 International Conferences and Technical Committee member for several International Conferences. He is Coordinator for J Lab under J Hub JNTUH and Robotic Club. Also, Coordinator for NBA and NAAC at College Level.
.