Abstract
:
In the field of electrical power sector frequency as a
parameter plays an important role. The value of frequency is not
constant, varies according to the load conditions. The power
system functionalities like operation, monitoring and controlling
of electric device are having lots of contribution to it. So it is
required to measure the accurate value of this slowly varying
frequency. The total power generated by generating stations is
equal to the power consumed and losses under steady state
conditions. Due to sudden mismatch in the appearance of
generation and load can deviate the frequency from its nominal
value. Frequency is an important parameter which influences
functions of different relays. This study was performed to
calculate the frequency of voltage or current signal in the
presence of noise and distortion. In this paper Least Mean
Square (LMS) Filter is studied and its frequency estimations are
discussed.
Index Terms
:
Adaptive Filters, LMS, RLS, DFT, Frequency
Estimation.
I.
INTRODUCTION
[image:1.595.61.269.515.653.2]In a power system, the conventional techniques of phasor
estimation which is based on the constant frequency
modeling are affected mostly due to the dynamic variation
of the frequency. Further the change in reactance
component which results from the nominal value of the
system frequency affects the functionality of different
relays. Therefore, the frequency plays an important role in
relaying, monitoring and operation and controlling of
electrical devices using digital techniques.
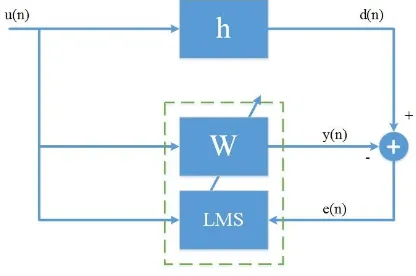
Fig.1. LMS filter with Signaling
Revised Manuscript Received on September 03, 2019
Bibhu Prasad Ganthia, PhD Research Scholar, School of Electrical Engineering, KIIT University, Bhubaneswar, Odisha, India.
Rosalin Pradhan, Assistant Professor, Department of Electrical Engineering, IGIT, Sarang, Dhenkanal, Odisha, India.
Priya Pritam Panda, Assistant Professor, Department of Electrical Engineering, IGIT, Sarang, Dhenkanal, Odisha, India.
Dr. Subrat Kumar Barik, Associate Professor, School of Electrical Engineering, KIIT University, Bhubaneswar, Odisha, India.
By considering the purely sinusoidal voltage waveform, the
system frequency is indicated by the time difference between
two zero crossings. However, in general, the distorted forms
of measured signals are available therefore numbers of
techniques are there for the power system frequency
estimation. In this paper Least Mean Square (LMS) filtering
technique is used for the study of frequency estimation. In
figure 1 the use of least mean square filter is used at signaling
purposes.
II.
MODELLING OF POWER SYSTEM
In power system with no loss performance is considered for
estimation. So for a better power quality it is significant to
have a purely sinusoidal voltage or current signal. But in
practical poor power quality results due to over voltage,
under voltage, change in frequency, harmonics and
generation-load mismatches. Therefore it is required to
estimate the frequency accurately without any delay for the
better power quality even in the presence of disturbances. To
find the frequency of a pure sinusoidal voltage waveform
there are some basic methods such as zero crossing detection
and number of cycles calculation within a time interval are
available. Discrete Fourier transform (DFT), Kalman
filtering, least square error, and iterative techniques are some
of the other well-known techniques in this area. In this
chapter Adaptive Filters has been implemented for frequency
estimation. A power system voltage or current in discrete
time signal can be expressed in the form of
(2.1)
Where,
= instantaneous value of signal
= Amplitude
= Sampling instant
= Time of sampling
= angular frequency
= phase
= Additive noise
Eq.(2.1) can be written as
(2.2)
Where,
is the estimated signal.
It is known that the samples of this sinusoidal signal should
satisfy the following relationship.
(2.3)
Power System Frequency Estimation using Least
Mean Square Filter based Algorithm
Now, the problem is to find out the value of ω from the above
equation (2.3).
III. ADAPTIVE FILTER
An Adaptive filter is a linear filter which has a transfer
function that is controlled by variable parameters and those
parameters are adjusted by an optimization algorithm. The
adaptive filters are digital filters for the complexity in the
algorithm.
PROCESSOR
ADAPTATION ALGORITHM INPUT
SIGNAL
OTHER DATA
OUTPUT SIGNAL
ADAPTATION ALGORITHM PROCESSOR
PERFORMANCE CALCULATION INPUT
SIGNAL
OUTPUT SIGNAL
OTHER DATA
Fig.2. Open Loop Adaptive Filter Structure and Closed
Loop Adaptive Filter Structure
IV. LEAST MEAN SQUARES (LMS) FILTER
LMS (Least Mean Square) algorithms are the set of adaptive
filters used to imitate a desired filter by finding the
co-efficient of filters which are related in producing error
signals of the least mean squares. The algorithm starts by
taking weights as zero(in most cases) and for each step the
weights are updated by finding the mean square error. It acts
as a Low-Pass filter.
The least-mean-square (LMS) algorithm consists of two
basic processes:
1. A filtering process that includes (a) Evaluation of
transversal filter output which is generated by tap inputs, and
(b) Error estimation from the comparison between this output
with desired output.
2. An adaptive process that includes automatic adjustment of
the tap weights in accordance with the estimated error.
-+
e(n)
d(n) ) / ( ˆ
n u n d
u(n)
TRANSVERSAL FILTER
ADAPTIVE WEIGHT CONTROL MECHANISM
) (
ˆ n
w
(2.4)
Where, R = correlation matrix
p = cross-correlation matrix
w(n) = weight of the system
J(n) = mean square error
= gradient vector
(2.5)
Where, u(n) = input signal of the system
= Hessian matrix of u(n)
(2.6)
Where,
= desired response of the signal
V. COMPLEX LMS BASED FREQUENCY
ESTIMATION ALGORITHM
In power system the three phase voltage signal can be
expressed in discretized form as
(2.7)
(2.8)
(2.9)
Where
is peak value of the voltage signal,
is the noise
component,
is the sampling time,
is the sampling
instant, is the phase of the signal, and is the angular
frequency (
with being the system frequency)
[1]. The complex form of signal originated from the
three-phase voltages is obtained by
transform written as
follows
(2.10)
A complex voltage
can be obtained from above as
(2.11)
Where is amplitude of the complex signal
, and
is its
noise component and
.
VI. RESULTS AND DISCUSSION
This chapter discusses the MATLAB/Programming software
implementation of LMS filter for system identification and
frequency estimation.
Fig.4. Error waveform of LMS Filter for System
identification
For system identification the input x(n) was given as
and the desired input d(n) was given as
. Where f is the frequency (50Hz). Here the
LMS filter identified the system after 0.06 Sec.
B. Complex LMS Filter for Frequency Estimation
Fig.5. Approximation analysis of 49.5 Hz frequency
initialized at 50 Hz by LMS
At t=0.00198 sec the LMS Filter tracked the
Frequency.
Fig.6. Error waveform of LMS Filter for the estimation
of frequency 49.5 Hz
For estimating the frequency 49.5 Hz using the LMS
Filter the error becomes zero after 0.0013sec.
Fig.7. Approximation analysis of 50.5 Hz frequency
initialized at 50 Hz by LMS
At t=0.0016 sec the RLS Filter tracked the
Frequency.
Fig.8. Error waveform of LMS Filter for estimating of
frequency 50.5 Hz
For estimating the frequency 50.5 Hz using the LMS
Filter the error becomes zero after 0.0015sec.
C.For System Identification
An algorithm is applied to identify the signal. The systems
are identified for LMS Filters with a sampling rate of 1kHz in
MATLAB. The influencing parameters of the algorithm are
For LMS Filters two signals are given to the Filters. They are
input signal i.e.
and the desired signal i.e.
. Here is the frequency and the value of the
frequency is 50 Hz.
Here the LMS Filter identified the desired signal after 0.06
sec.
D. For Frequency Estimation
Frequency Estimation for LMS Filter
Table.1. Estimation of frequency for LMS Filter
Frequency in Hz
Time in sec. when the frequency is tracked
Time in sec. when the error becomes zero
49.5 0.00198 0.0013
The 49.5 Hz fundamental frequency has a signal-to-noise
ratio (SNR) of 30 dB is employed to the filter which is
initialized at 50 Hz and the corresponding graph is plotted in
Fig.4. It is seen that after 0.00198sec the LMS Filter detects
the frequency. Here the error becomes zero after 0.0013 sec.
Again the 50.5 Hz fundamental frequency of 30dB
signal-to-noise ratio (SNR) is employed to the filter which is
initialized at 50 Hz and the graph is plotted in Fig.6. It is seen
after 0.0016sec the LMS Filter detects the frequency. Here
the error becomes zero after 0.0015 sec.
VII.
CONCLUSION
Based on studies which are conducted in this project, the
following conclusions may be derived from the above
algorithm for frequency estimation. For the power system
frequency estimation the least square method is the simplest
one. This algorithm gives good accuracy and convergence
speed. The frequency of the signal can be estimated from this
least square algorithm by minimizing the squared error
between the actual signal and assumed model signal. The
formulation of this LMS based approach is very simple by the
use of the sampled values voltage signals. The frequency
estimation done here by using the distorted signals of single
phase voltage waveform. The results obtained from the
simulation are accurate and the estimation speed is also less
even in the presence of noise. By considering different
aspects the LMS based frequency estimation approach gives
better rate of convergence and efficiency.
REFERENCES
1. Y. Xia, L. Qiao, Q. Yang, W. Pei and D. P. Mandic, "Widely linear adaptive frequency estimation for unbalanced three-phase power systems with multiple noisy measurements," 2017 22nd International Conference on Digital Signal Processing (DSP), London, 2017, pp. 1-5. 2. T. R. F. Mendonça, M. F. Pinto and C. A. Duque, "Least squares optimization of zero crossing technique for frequency estimation of power system grid distorted sinusoidal signals," 2014 11th IEEE/IAS International Conference on Industry Applications, Juiz de Fora, 2014, pp. 1-6.
3. Bibhu Prasad Ganthia, Aditi Abhisikta, Deepanwita Pradhan, Anwes Pradhan, A Variable Structured TCSC Controller for Power System Stability Enhancement, Materials Today: Proceedings, Volume 5, Issue 1, Part 1, 2018, Pages 665-672, ISSN 2214-7853, https://doi.org/10.1016/j.matpr.2017.11.131.
4. H. M. M. Alhaj, N. M. Nor, V. S. Asirvadam and M. F. Abdullah, "Power system fundamental frequency estimation using variable step size NLMS," 2013 IEEE International Conference on Smart Instrumentation, Measurement and Applications (ICSIMA), Kuala Lumpur, 2013, pp. 1-6.
5. Bibhu Prasad Ganthia, Prashanta Kumar Rana, Tapas Patra, Rosalin Pradhan, Rajashree Sahu, Design and Analysis of Gravitational Search Algorithm Based TCSC Controller in Power System, Materials Today: Proceedings,Volume 5, Issue 1, Part 1,2018, Pages 841-847, ISSN 2214-7853, https://doi.org/10.1016/j.matpr.2017.11.155.
6. L. Yunlu, W. Dazhi, H. Wei and L. Zhen, "A novel predictive control for active power filter using a variable-step LMS algorithm," The 27th Chinese Control and Decision Conference (2015 CCDC), Qingdao, 2015, pp. 4688-4692.
7. R. W. Wies, J. W. Pierre and D. J. Trudnowski, "Use of least mean squares (LMS) adaptive filtering technique for estimating low-frequency
8. J. C. M. Bermudez and N. J. Bershad, "Time-varying system identification using the quantized LMS algorithm," 38th Midwest Symposium on Circuits and Systems. Proceedings, Rio de Janeiro, Brazil, 1995, pp. 247-250 vol.1.
9. P. A. C. Lopes, G. Tavares and J. B. Gerald, "A New Type of Normalized LMS Algorithm Based on the Kalman Filter," 2007 IEEE International Conference on Acoustics, Speech and Signal Processing - ICASSP '07, Honolulu, HI, 2007, pp. III-1345-III-1348.
10.B. P. Ganthia, R. Pradhan, S. Das and S. Ganthia, "Analytical study of MPPT based PV system using fuzzy logic controller," 2017 International Conference on Energy, Communication, Data Analytics and Soft Computing (ICECDS), Chennai, 2017, pp. 3266-3269.
11.Junmin Zhang and Kaipei Liu, "Harmonic detection for three-phase circuit based on the improved analog LMS algorithm," 2008 International Conference on Electrical Machines and Systems, Wuhan, 2008, pp. 3978-3982.
12.Ganthia B.P., Pritam A., Rout K., Singhsamant S., Nayak J. (2018) Study of AGC in Two-Area Hydro-thermal Power System. In: Garg A., Bhoi A., Sanjeevikumar P., Kamani K. (eds) Advances in Power Systems and Energy Management. Lecture Notes in Electrical Engineering, vol 436. Springer, Singapore
13.A.K. Pradhan, A. Routray and A. Basak, “Power System Frequency Estimation using Least Mean Square Technique” IEEE Transactions on Power Delivery, Vol.20, No.3, PP.: 1812-1816, July 2005.
14.Vullings, B.D. Vries and J.W.M. Bergmans “An Adaptive Kalman Filter for ECG Signal Enhancement” IEEE Transactions on Biomedical Engineering, Vol.58, No.4, PP.: 1094-1103, April 2011.
AUTHORS
PROFILE
Bibhu Prasad Ganthia is currently working as Assistant Professor in the Department of Electrical Engineering at Indira Gandhi Institute of Technology, Sarang, Odisha, India. He has received his Master’s degree in the year 2016 from IGIT, Sarang in Power Electronics & Drives specialization and pursuing his Ph.D at Kalinga Institute of Industrial Technology, Deemed to be University, Bhubaneswar, Odisha, India. He has both teaching as well as industrial experience in his profession. In the short duration he has published 27 journal, book chapters and conference papers in reputed publishers like IEEE, Elsevier and Springer etc. with editor of 3 Scopus index journals and reviewer of many journal and conferences like BEEI, Indonesia, MDPI Journal, IASTER, The Institute of Engineers, Springer etc. He is also the member of national and international scientific associations such as IAENG, SESI, ISRD, IFERP, BEIESP, SCIEI and NSPE and many more. He has software proficiency in MATLAB, ANSYS, LabView, DSpace and VLSI designing. He has got Certificate of Merit for excellence in Mater degree from BPUT, Rourkela, Odisha. He is awarded as “Best Ed Tech Teacher of the Year” by Indian Education Award 2019 sponsored by Techpro Labz and IIT Patna. Moreover he is awarded as “Young Teacher Award” by International School Award 2019, India. He owned Best Researcher Award and Young Researcher Award from DFIRF and Vedant Academics Bangkok Awards in the year 2019 respectively. He has also awarded Innovative Researcher of the Year in renewable energy for the year 2019 by Research Under Literal Access and World Research Council. His Ph.D research is on meta-heuristic artificial neural network optimization, control, protection of wind energy conversion system Hardware-In-Loop in Real Time System.
Electrical Engineering. She has six years of teaching experience and published paper in reputed journals and conferences like IEEE, Elsevier Proceedings. Her areas of interest are Power System, Renewable Energy and Smart Grid.
Priya Pritam Panda is graduated (B.E) from Hindustan University, Chennai in 2014 in Electrical and Electronics engineering. He perused Master degree (M.Tech) from Indian Institute of Technology Guwahati in the year 2018 with Radio frequency and photonics specialization. Now working as Assistant Professor in department of Electrical Engineering, Indira Gandhi Institute of Technology, Sarang, Odisha. He has teaching experience of more than three year. He was awarded by IEEE, Madras section sight for developing low cost solar lamp from waste material. He has done research in vibration analysis of single later grapheme plate in his master course. His area of interest is high frequency study, engineering optics, renewable energy, Internet of Thing and micro grid. His software proficiency includes MATLAB, Multisim, CAD, Optispice, OptiWave and Comsol Multiphysics..