Abstract: This paper present the investigation on tensile behavior of syntactic foam using finite element analysis (FEA). Tensile properties which is important to discover especially for isotropic materials such syntactic foam. Different weight percentage (wt.%) of glass microballoon might be effected on developing of stress concentration (Kt) their stress on surface area. Comparative study on tensile syntactic foam using FEA approach was not explored yet. Hence, it is showed that the stress concentration more sensitive impact on lower modulus elasticity compared to the higher elasticity for syntactic foam.
Index Terms: Finite element analysis, Glass microballoon Stress concentration, Tensile.
I. INTRODUCTION
Stress concentration in panels particularly with geometrical discontinuities in the form of cut outs (various shape) and holes have received wide attention in the literature cause to the fact that they often lead to failure. Previous study proposed that the stress concentration factor (SCF) can be reduced by using the functionally graded layer [1]. For homogeneous material panels the problem has been widely studied and a number of analytical, numerical and experimental techniques are available for reduction of the stress concentration factor (SCF) around discontinuities. In Nagpal et al. [2] an overview of various techniques developed to reduce SCF is presented: some authors proposed, for example, removing material around the hole by using auxiliary holes or reinforcing the hole with composite material rings. Chao et al. [3] obtained a general solution for a reinforced elliptic hole embedded in a matrix subjected to remote uniform load. The solution, based on the technique of conformal mapping, permits one to find the optimum design of the reinforcement layer in order to reduce stress concentration and interfacial stresses. Recently, in Batista [4] attention was devoted to the study of SCF for different complex geometries of holes in homogenous plates subjected to uniform loads at infinity by using a modified Muskhelishvili method.
In order to determine the SCF area in the panels mainly structural analysis was implied. Nowadays, there are two type of testing which is purposely to detect this failure mode either by destructive testing (DT) is using experimental work and Non-destructive testing (NDT) is mainly used as a
Revised Manuscript Received on October 05, 2019.
Zulzamri Salleh, Marine Engineering Technology Section, Malaysian Institute of Marine Engineering Technology/ Universiti Kuala Lumpur/ Lumut, Perak, Malaysia.
Md Mainul Islam, School of Mechanical and Electrical Engineering, Faculty of Health, Engineering and Sciences, University of Southern Queensland, Toowoomba, Australia.
Jayantha Epaarachchi, School of Mechanical and Electrical Engineering, Faculty of Health, Engineering and Sciences, University of Southern Queensland, Toowoomba, Australia.
diagnostic tool to test complex numerical engineering components and structures to locate, size and characterize defects in engineering components and structures. NDT mainly is very important for the preventive maintenance in structural construction, failure analysis by using finite element analysis (FEA), and post treatment (PT) of damages [5, 6]. Prior to determine the SCF in NDT methodology, it is always involved with the computational fractured analysed by using the sophisticated software such as ANSYS, CATIA V5, Solid Works and NX, or using diagrams obtained experimentally for various geometric configurations involving abrupt changes in geometry [12]. Basically, all these software’s are based on some of numerical method involving finite element analysis (FEA) and finite volume method (FVM). Rizzi et al. (2000) using ABACUS in FEA work on uniaxial tension/compression, biaxial compression and Three Point Bending (TPB) compared with experimental data analysed [13]. Sun and Tong (2004) have been used Strand7 in the finite element analysis to investigate fracture toughness analysis of inclined crack in cylindrical shell repaired with bonded composite patch [14]. While Guades et al. (2014) also used Strand7 to investigate the mechanical properties pultruded fibre-reinforced polymer tube in FEA [15]. Jain and Mittal (2008) used the finite element commercial package, ANSYS to analyse the effect of the ratio of the diameter D and the width W of the hole on the stress concentration factor and the deformation of an isotropic, orthotropic laminated composite plate subjected to various transverse static loading conditions [16]. They found, that the peak stress concentration factor occurs on the boundary of the hole and that the stress concentration factor was also strongly influenced by the uniformly distributed normal and equivalent stresses. Limitation of availability the characteristic in tensile properties such as modulus elasticity and Poisson’s ratio in functional graded material like syntactic foam lead to focus in this study using the modelling FEA methodology.
This paper presents the characterisation of the tensile properties of a dog bone specimen glass microballoon/vinyl ester syntactic foam. The main objective of this work is to investigate the behaviour of syntactic foam under tensile loading by using FEA in stress concentration factor. Tests on coupons and full-scale specimens were undertake to determine the tensile properties of syntactic foam. The tensile tests on coupons were conducted following the standards defined in ASTM: D638-10 [17]. On the other hand, the tests on full scale specimen were performed using the procedures available in previous studies. The details of these tests are presented in the next sections. Aside from these tests, a finite
Zulzamri Salleh, Md Mainul Islam, Jayantha Epaarachchi
element analysis (FEA) particularly stress concentration factor (SCF) was carried to simulate the tensile behaviours of full-scale specimen by using the Strand7 software. The results obtained from the experiment were compared with those of FEA.
II. METHODLOGY
Mechanical Testing
[image:2.595.317.536.53.180.2]The tensile test was performed in a 100 kN capacity MTS with model machine Insight Electro-mechanical testing machine using a crosshead speed of 1.25 mm/min. The test was conducted in accordance with standard ASTMD-638-10. An extensometer was also provided at the gauge length to measure the longitudinal and transverse deformations for determination of strength, modulus and the Poisson’s ratio glass microballoon/vinyl ester syntactic foam. Strain data also were measured through an extensometer with a 25 mm gauge length. The experimental set-up used in conducting the tensile test is shown Figure 1.
Fig. 1 Tensile test coupon
Stress Concentration Factor (SCF)
Stress Concentration factors (Kt’s) for numerous “simple” geometries have been determined by researchers (analytical equations). Warren and Richard have compiled these into easy to use tables [20]. Determining stress concentration factors (Kt) for complex geometries can be difficult because are highly localized effects on functions of geometry and loading. In order to predict the “actual” stress resulting from a geometric stress raiser, a theoretical stress concentration factor is applied to the nominal stress. For a part subjected to a normal stress, the true stress in the immediate neighbourhood of the geometric discontinuity is calculated as mention at Equation (1);
σmax = Kt×σref (1)
Where max is maximum stress, Kt is stress concentration factor and nom or ref is nominal stress. While for ref can be determined by using the Equation (2) below;
σref = σ∞×w
w −2h (2)
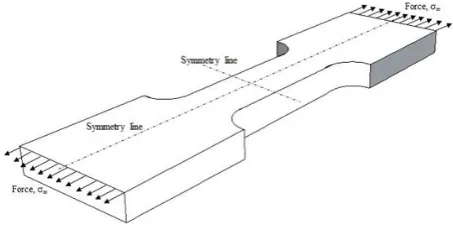
Equation (2) was derived based on the stress is infinite with 100MPa, w is width of specimen and h is total length including with radius semicircle to the symmetry line [21]. The dimension geometry loading for Equation (2) show at Figure 2 for details;
Fig. 2 Schematic diagram for geometry loading of the strip [22]
[image:2.595.54.288.300.417.2]From the Figure 3, it is shows that the resultant stress/strain/displacement field in each quarter will be same when it is divided by the both horizontal and vertical symmetry lines. Therefore, it is necessary to build only one quarter strip as long as the applied force along at the edges where symmetry conditions exist to make quarter model behave in the completed strip. Similar with the geometry loading for tensile specimen. In the case of dimension geometry tensile loading shown at Figure 3 used in this study.
Fig. 3 Schematic diagram for geometry tensile loading of the strip
Timoshenkor and Goodier also found that the stress distribution in a rectangular filleted bar in simple tension obtained through photoelastic procedures was observed in their research [22]. In this study, the SCF, Kt was calculated according to Roark’s formula shows at Equation (3) for details;
Kt= C1+ C2 2h
D + C3
2h D
2 + C4
2h D
3
(3)
Where C1= 1.006 + 1.008 h
r− 0.044
h r
C2= −0.115 − 0.584 h
r+ 0.315
h r ,
C3= 0.245 − 1.006
h
r − 0.257
h
r , C4= −0.135 +
0.582 h
r− 0.017 h
r for the case of 0.1 ≤ h r ≤ 2.0.
Finite Element Analysis (FEA)
[image:2.595.313.540.311.428.2]Physically to implement FEA in engineering application particularly mechanical engineering may had difficulties when considered to design a machine without permitting some changes in the cross sections of the members. For example the rotating shaft must have shoulders designed on them so that the bearings can be properly seated and so that they will take thrust loads, also the shafts must have key slots machined into them for securing pulleys and gears, etc. [24]. Hence, when considering all these items, it is abrupt changes in geometry can give rise to stress values that are larger than would be expected [12]. This can be a source of difficulty for machine designers when it develop which play important role in the design stage. In order to apply the FEA in this case let consider, for example, the state of stress in the tension member of two widths illustrated in tensile shape of the specimen. Spotts et al. (2004) considered the stress geometry for the near each end of the bar the internal force is uniformly distributed over the cross sections [25]. The nominal stress in the right part can be found by dividing the total load by the smaller cross-sectional area, the stress in the left part can be found by dividing by the larger area. However, in the region where the width is changing, a redistribution of the force within the bar must take place. In this part, the load is no longer uniform at all points on the cross section, but the material in the neighbourhood of points B in Figure 4 is stressed considerably higher than the average value. The maximum stress occurs at some point on the fillet, as at B, and is directed parallel to the boundary at that point. By using the Strand7 software, the stress maximum occurred at B can be investigated by using the FEA 2D model.
Fig. 4 Stress distribution over the cross sectional for tensile specimen
The quater symmetry lines in vertical position at middle of tensile specimens for 2D FEA have been used in this study to investigate the SCF syntactic foam. The model also called as two dimensional solid model used for plane stress analysis. Darwish et al. (2013) used the quarter two dimensional model in order to determine stress concentration for countersunk rivet holes in orthotropic plates [26]. Pilkey (2008) also summarized and reported that nnumerous studies on the stress concentration of two dimensional (2-D) plates with circular holes subjected to several loading types [27]. While Shivakumar and Newman (1992) used 3D finite element results of the SCF were presented by for plates with circular straight-shank holes subjected to remote tension [28]. Their results showed that the maximum SCF lies at the mid-thickness of the isotropic plate and drops near the free surface. The FEA also can be performed for both isotropic and orthotropic plates as long as SCF occurred near to the holes area. Wu and Mu (2003) performed FEA on uniaxial and biaxial loaded isotropic and orthotropic plates with
circular holes and examined the SCF of holes in a plate structures and pressure vessels [29]. Kotousov and Wang (2002) presented analytical solutions for (3-D) stress distribution around typical stress concentrators in an isotropic plate of arbitrary thickness [30]. In the present study, FEA is integrated with the software called Strand7 to determine the SCF syntactic foam material. In strand7 the surfaces of specimen can be subdivided into element and will meshing for each of them as well. The nodes are created based on the specimen size of tensile in millimetre units. In Strand7 work, the nodes and elements were identified according to the actual size of tensile specimens. Then the subdivide section have been used to refine the mesh of the quarter size of tensile specimen before it was given the force at edge area. Figure 5 is shown the nodes with subdivided it into plate elements. The total of nodes is 70 nodes and plate elements is 47 plates have been used in this study.
Fig. 5 The nodes and plate elements using Strand7[21]
III. RESULTSANDDISCUSSION
Tensile properties
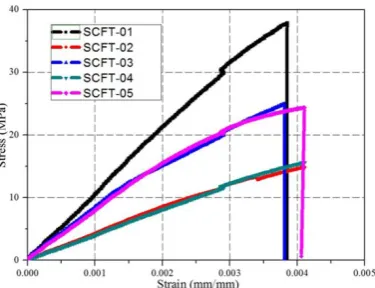
[image:3.595.74.260.427.516.2]Fig. 6 Overview representative tensile stress-strain curve for (a) SCFT-01 (b) SCFT-02 (c) SCFT-03 (d) SCFT-04 (e)
SCFT-05
The tensile strength is observed is decreased to 20 MPa for SCFT-02. But then it was increased 5% for SCFT-03 to 25 MPa and decreased again for SCFT-04. While it is continued to reduce for SCFT-05 at 24 MPa before it is fractured. Hence, there is no trend shows for tensile strength particularly when added with glass microballoon contents into the matrix resin as well. For the reduction of strength value of the syntactic foam are might be concerned with matrix phase in system which is act as load bearing phase as suggested by Wouterson et. al [33]. They were tested glass microballoon in epoxy resin as matrix system. From their observation, it was found that matrix-microballoon interface does not appear to be very strong in these composites, and the presence of higher volume fraction of microballoons only reduces the volume fraction of epoxy resins in the structure, causing the lower strength of syntactic foams.
Stress Concentration Factor properties
The stress concentration factor was calculated according to the Equation (3) for all the specimens. Generally the SCF
values are comparable with the SCF from modelling FEA by considering the maximum stress at the particular area and stress reference as 238 MPa. Starting from the SCF-01 with the composition of glass microballoon 2 wt.% has higher SCF, Ktf at 1.95. Table 1 shows the SCF values with the maximum stress distribution at four locations area on plate elements (GP1 to GP4).
From the Table 1 shows that the maximum stress also belong to SCF-01 with 464 MPa which is matrix bonding of vinyl ester resin is higher than other specimens. This is cause of the calculation by using the Equation (3) was involved with the parameters such as radius (r) of curvature tensile and distance (h) are important to measure in this study. The maximum measurement for distance h is 60 mm while the maximum for radius r is 28 mm. Another parameter has involved for this SCF value is width of grip area for tensile specimen, D1 with maximum value 200 mm. The comparison between SCF for modelling and experimental also can be shown at Fig. 14. Mbandezi and Mabuza use the formula maximum stress before refinement meshing and after refinement meshing to compute the numerical error percentage [36]. Numerical comparison also done by Collins between maximum normal stress in experimental and simulation [37]. In this study, the comparison between experimental and modelling was compute using the stress concentration factor method. From this graph, SCF experiment led the highest for SCFT-01 with difference 11 % when compared with SCF modelling. The SCF values for modelling is not much varied for all specimens while SCF for experiment show the trend is decreased when addition of glass microballoon in the composite accepted for SCFT-05. The percentage different between stress concentration factor Ktm and Kte showed that SCFT-05 has lower percentage with 8% error while SCFT-04 at maximum percentage with 34% error.
Table. 1 Stress concentration factor values using FEA method
Specimen Radius r(mm)
Distance h(mm)
Width D1(mm)
SCF Ktm
SCF Kte
Differences (Ktm – Kte) %
SCFT-01 28 58 200 1.95 1.73 11
SCFT-02 26 60 197 1.30 1.72 24
SCFT-03 28 60 198 1.37 1.71 20
SCFT-04 28 57 199 1.15 1.74 34
SCFT-05 28 60 197 1.57 1.70 8
Finite Element Analysis (FEA) Distribution Stress Analysis
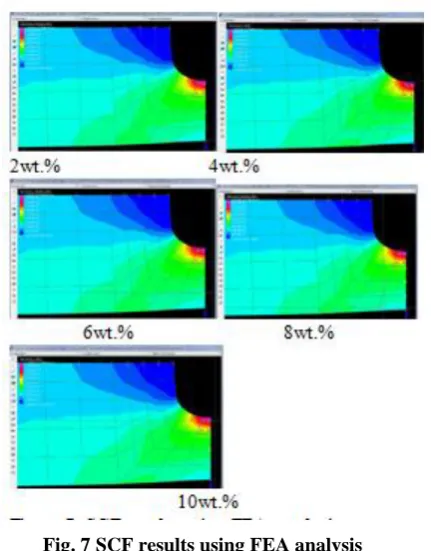
The stress concentration factor for all specimens which is analysed using the Strand7 shown at Figure 7. The contour pattern among all specimens showed the stress intensity area are focused on the narrow neck of tensile specimens. The plate property for each SCF can be determined from the Strand7 software at four point in the selected area as G1, G2, G3, G4 and centroid point. Table 2 shows all the related values for very each point in xy-direction with z-direction considered as zero because it occurred for 2D modelling. The centroid point was located at the middle cross between G1 to G2 and G3 to G4. In Strand7 the centroid is not appeared in
[image:4.595.113.484.510.607.2]Table. 2 Stress distribution values using FEA method
Specime n
Centroi d XY(103 MPa)
G1 XY(10 3 MPa)
G2 XY(10 3 MPa)
G3XY(10 3 MPa)
G4XY(10 3 MPa)
SCFT-0
1 4.0390 4.8789 3.2846 4.7768 3.2156 SCFT-0
2 2.4329 2.9557 1.9701 2.8820 1.9236 SCFT-0
3 2.8287 3.4169 2.3004 3.3454 2.2520 SCFT-0
4 2.3976 2.8961 1.9498 2.8355 1.9088 SCFT-0
5 2.9510 3.5852 2.3897 3.4958 2.3333 From the Table 2 it is shows that the maximum stress also belong to SCF-01 with 4.0390 x 10³ MPa at centroid area. For other specimens from SCFT-02 to SCFT-05 the maximum stress is varied between 2.4 to 2.9 x 10³ MPa. The results also shows that the maximum stress distribution occurred at the plate element property no. 3. This result is confirmed with by referred the Figure 6 with a higher stress distribution particularly SCFT-01 because the matrix resin content is higher than other specimens due to plasticity. This is valid results by using the numerical modelling when determine their SCF individually after simulated using Strand 7 showed ad Figure 7
Fig. 7 SCF results using FEA analysis
Effects on Axial and Transverse Stress-Strain in Poisson’s ratio
The Poisson’s ratio for all specimens can be determined by using the standard method according to the ASTM D-638. The gradient of the graph give the Poisson’s ratio value for all the specimen show in Figure 8a. The Poisson's ratio (νVE) and the Young's modulus (EVE) of neat vinyl ester resin specimens are measured as the first step. The value of νVE is found to be 0.57, while EVE is measured to be 11 GPa. This value is used to estimate the Poisson's ratio of various
syntactic foam composites (νc) using a recent theoretical
model, where the material properties of the
[image:5.595.325.529.188.536.2]microballoonglass material are taken as EMB=60 GPa and νMB=0.21 [35]. From the graph in Figure 8b, shows that SCFT-02 has higher Poisson’s ratio with 0.46 and minimum at 0.37 for SCFT-03 if compared with vinyl ester is still has higher value at 0.57. Generally, the Poisson’s ratio is decreased while increasing the glass microballoon contents in the composite. Similar to the previous worked, Wouterson et al. [33] was found the Poisson’s ratio is varied from 0.30 to 0.35 in his study when added with nanoparticles.
Fig. 8a The axial strain versus load for tensile characteristic
[image:5.595.329.532.191.343.2]Fig. 8b Graph for Poisson’s ratio for all specimens
IV. CONCLUSION
The analyses using finite element method by the Strand7 software was established to analyse the stress concentration factor (SCF) for different weight percentage (wt.%) of glass microballoons in vinyl ester matrix resin syntactic foam. Five compositions with different wt.% were figured out using the formula SCF comparable between experimental and theoretical values. It was found that the both of SCF experimental and the theoretical values are varied but no trend shows among of them when the weight percentage of glass microballoons is increased in syntactic foam.
Relatively, it is showed that the SCF for experimental is not much different between 1.70 –1.74. While SCF for modeling more varied with minimum
[image:5.595.67.283.379.655.2]It was occurred when increased the glass microballoon content in syntactic foam. It is also indicating that, the SCF is more sensitive to material with small modulus elasticity than the large modulus elasticity for the experimental SCF values. While it also indicates that, the SCF is sensitive to the small Poisson’s ratio than the large Poisson’s ratio for the theoretical SCF values. Finally from the FEA Strand7 modelling, it shows that the stress distribution are varied with the different weight percentage (wt.%) of glass microballoons, which is higher values particularly for lower weight percentage of glass microballoons SCFT-01 specimen.
ACKNOWLEDGMENT
The authors would like to thank Majlis Amanah Rakyat (MARA), Malaysia and Universiti Kuala Lumpur Malaysian Institute of Marine Engineering Technology, Malaysia for providing scholarship to the first author on doing this work.
REFERENCES
1. Sburlati R., Atashipour S. & Atashipour S, “Reduction of the stress concentration factor in a homogeneous panel with hole by using a functionally graded layer”. Composites: Part B, 61, (2014), pp. 99-109. 2. Nagpal S., Jain N. & Sayal S,“Stress concentration and its mitigation techniques in flat plate with singularities: a critical review”. Engineering Journal, (2012), 6, pp. 1-16.
3. Chao C., Lu L., Chen C. & Chen F, “Analytical solution for a reinforcement layer bonded to an elliptic hole under a remote uniform load”,International Journal Solids Structure, (2009) 46, pp. 2959–65. 4. Batista M, “On the stress concentration factor around a hole in an
infinite plate subjected to a uniform load at infinity”,International Journal Mechanic Science,(2011), 53,pp.254–61.
5. Abdul Aziz A., Abumeri G., Garg M., Young P, “Structural Evaluation of a Nickel Base Super Alloy Metal Foam Via NDE and Finite Element. In: Monitoring SSSaMNEaH”, editor. Behavior and Mechanics of Multifunctional and Composite Materials II, Conference SSN04. San Diego, California USA: SPIE; (2008), 9-13.
6. Reale S., Tognarelli L., Crutzen S, “The use of fracture mechanics methodologies for NDT results evaluation and comparison”. Nuclear Engineering and Design.(1995),158, pp. 397-407.
7. Ingraffea A. & Wawrzynek P, “Computational Fracture Mechanics: A survey of the field. European Congress on Computational Methods in Applied Sciences and Engineering, ECCOMAS.(2004).
8. Poveda R., Gupta N. & Porfiri M, “Poisson's ratio of hollow particle filled composites”. Materials Letters, (2010), 64, pp. 2360–2362. 9. Gupta N., Woldesenbet E. & Mensah P.,“Compression Properties of
Syntactic Foams: Effect of Cenosphere Radius Ratio and Specimen Aspect Ratio”.Composites: Part A, 2004, 35,pp.103-111.
10. Gladysz G. B. B.P. GM G. &Lula J.,“Three-phase syntactic foams: structure property relationships”. Journal Material Science, 2006,41, pp.4085–4092.
11. Porfiri M., Nguyen N.Q. & Gupta N.,“Thermal conductivity of multiphase particulate composite materials”. Journal Material Science, 2009, 44, pp.1540–1550.
12. Adis J., Muminovic, Saric I. & Repcic N.,“Analysis of Stress Concentration Factors using Different Computer Software Solutions”. Proocedia Engineering, 2014, 69,pp.609 – 6015.
13. Rizzi E., Papa E. & Corigliano A.,“Journal Syntactic Foam Modelling”. International Journal Solids Structure,2000, 37,pp.5773-5794.
14. Sun X. & Tong L.,“Fracture toughness analysis of inclined crack in cylindrical shell repaired with bonded composite patch”. Composite Structures, 2004, 66,pp.639–645.
15. Guades E., Aravinthan T. & Islam M.,“Characterisation of the mechanical properties of pultruded fibre-reinforced polymer tube”. Materials and Design, 2014, 63,pp.305–315.
16. Jain N. & Mittal N.,“Finite element analysis for stress concentration and deflection in isotropic orthotropic and laminated composite plates with central circular hole under transverse static loading”. Material Science and Engineering, A, 2008, 498,pp.115-124.
17. International A. ASTM D 638-10 Standard Test Method for Tensile Properties of Plastics. USA: ASTM International; 2010.
18. Gupta N., Woldesenbet E., Kishore & Sankaran S.,“Studies on Compressive Failure Features in Syntactic Foam Material”. Journals of Sandwich Structures and Materials, 2001,4,pp.249-272.
19. Islam M.M. & Kim H.S.,“Novel syntactic foams made of ceramic hollow micro-spheres and starch: theory, structure and properties”. Journal of Materials Science,2007, 42,pp.6123-6132.
20. Warren C. & Richard G., Stress Concentration Factor. Roark’s Formula for Stress and Strain 7th edition ed. USA: Mc Graw- Hill,2002,pp.784-785.
21. Strand7. Introduction to the Strand7 Finite Element Analysis System. 3rd edition ed. Sydney, Australia 2010.
22. Timoshenko S. & Goodier J., Theory of Elasticity. Third Edition ed: McGraw-Hill, Inc; 1969.
23. Yang L., Zhu H., Tan D.,Influence of Soft Filler on Stress Concentration Factor of Elliptic Holes in a Rectangular Plate. Tianjin University and Springer-Verlag Berlin Heidelberg. 2012, 18,pp.117-120.
24. Shigley J.E., Mischke C.R. & Budynas R.G. Mechanical Engineering Design. New York USA: McGraw-Hill; 2004.
25. Spotts M.F., Shoup T.E., Hornberger L.E. Design of Machine Elements. 8th ed. New Jersey: Prentice Hall; 2004.
26. Darwish F., Tashtoush G. & Gharaibeh M., “Stress concentration analysis for countersunk rivet holes in orthotropic plates”. European Journal of Mechanics A/Solids, 2013, 37,pp.69-78.
27. Pilkey W. & Pilkey D. Peterson’s,Stress Concentration Factors. 3rd ed. New York USA: John Wiley & Sons; 2008.
28. Shivakumar K. & Newman J.,“Stress Concentrations for Straight-shank and Countersunk Holes in Plates Subjected to Tension, Bending, and Pin Loading”. In: National Aeronautics and Space Administration OoM, Scientific and Technical Information Program, editor. NASA Technical Paper 1992.
29. Wu H. & Mu B.,“On stress concentrations for isotropic/orthotropic plates and cylinders with a circular hole”. Composites: Part B, 2003,34,pp.127-134.
30. Kotousov A. & Wang C.,“Three-dimensional stress constraint in an elastic plate with a notch”. International Journal of Solids and Structures,2002, 77,pp.1665-1681.
31. Gupta N., Ye R. & Porfiri M.,“Comparison of tensile and compressive characteristics of vinyl ester/glass microballoon syntactic foams”. Composites Part B: Engineering,2010, 41,pp.236-245.
32. Gupta N. & Nagorny R.,“Tensile properties of glass microballoon-epoxy resin syntactic foams”. Journal of Applied Polymer Science, 2006, 102,pp.1254-1261.
![Fig. 5 The nodes and plate elements using Strand7[21]](https://thumb-us.123doks.com/thumbv2/123dok_us/8172235.252345/3.595.334.512.260.428/fig-nodes-plate-elements-using-strand.webp)