Edited by Tim Callan
September 2012
Edited by Tim Callan
RESEARCH SERIES
NUMBER 28
September 2012
Available to download from
www.esri.ie
The Economic and Social Research Institute (Limited Company No 18269)
Registered office: Whitaker Square, Sir John Rogerson's Quay, Dublin 2
The Economic Research Institute was founded in Dublin in 1960, with the assistance of a grant from the Ford Foundation of New York. In 1966 the remit of the Institute was expanded to include social research, resulting in the Institute being renamed The Economic and Social Research Institute (ESRI). In 2010 the Institute entered into a strategic research alliance with Trinity College Dublin, while retaining its status as an independent research institute.
The ESRI is governed by an independent Council which acts as the board of the Institute with responsibility for guaranteeing its independence and integrity. The Institute's research strategy is determined by the Council in association with the Director and staff. The research agenda seeks to contribute to three overarching and interconnected goals, namely, economic growth, social progress and environmental sustainability. The Institute's research is disseminated through international and national peer reviewed journals and books, in reports and books published directly by the Institute itself and in the Institute's working paper series. Researchers are responsible for the accuracy of their research. All ESRI books and reports are peer reviewed and these publications and the ESRI's working papers can be downloaded from the ESRI website at www.esri.ie
The Authors
Tim Callan and John FitzGerald are Research Professors, John Walsh is a Senior Research Analyst, Claire Keane is a Research Analyst and Michael Savage and Kevin Timoney are Research Assistants at the Economic and Social Research Institute.
Mike Brewer is a Professor of Economics at the University of Essex, Institute for Social and Economic Research.
This paper has been accepted for publication by the ESRI. The authors are solely responsible for the views expressed, which are not attributable to the ESRI, which does not itself take institutional policy positions.
Acknowledgements
Table of Contents
FOREWORD ... vii
Frances Ruane
1. FISCAL POLICY FOR 2013 AND BEYOND ... 1 John FitzGerald
2. BENEFIT INTEGRATION IN THE UK: AN EX ANTE ANALYSIS OF UNIVERSAL CREDIT ... 25 Mike Brewer; James Browne; Wenchao Jin
Foreword
Frances Ruane
The annual Budget Perspectives Conference provides a forum for discussing key public policy issues of both immediate and longer term concern. In the context of the current fiscal and economic crisis, research insights are needed at both the macro and micro level. The former are central to understanding and managing the significant reductions in the budget deficit needed to put Ireland's public finances on a sustainable footing. The latter are essential because a successful budgetary adjustment requires restructuring of both public expenditure and taxation. This in turn requires that policy adjustments take full account of both efficiency and equity issue and are seen to do so. The research papers presented at this year's annual Budget Perspectives Conference continue in this tradition, providing an opportunity for policymakers, social partners and researchers to engage with some of the major current issues.
In the opening session of the conference, David Duffy sets out the economic context in which the Minister for Finance will frame the 2013 Budget. This draws on the recently published Quarterly Economic Commentary (see www.esri.ie). While the context looks somewhat more favourable to that in which the Budget 2012 was framed, it remains uncertain due to the slow rate of progress in resolving the Euro-area challenges.
The second paper, by John FitzGerald (ESRI), looks specifically at the fiscal position out to 2015 and explores what should happen beyond that date. The paper reviews progress to date in stabilising the public finances, and argues for retaining our fiscal stance even if growth in the Euro Area undermines our meeting the specific targets that have been set. As long as there is no new information suggesting that structural deficit is higher than had been anticipated, there are merits in sticking with the medium term fiscal plan. The paper suggests that it would make sense to run a fiscal surplus over the economic cycle post 2015, with the aim of reducing the debt to prepare for the increasing costs of ageing, especially post-2030, and to make the economy more robust to any future shocks.
2013. Many of the issues examined have parallels in the Irish context, where moves to a Single Working Age Payment are under consideration.
The final paper by Tim Callan, Claire Keane, Michael Savage, John Walsh and Kevin Timoney (ESRI) uses the ESRI's tax-benefit model to build a nationally representative profile of financial incentives to work in Ireland. This paper builds on earlier research in this area, presented at various Budget Perspectives Conferences over the past decade.
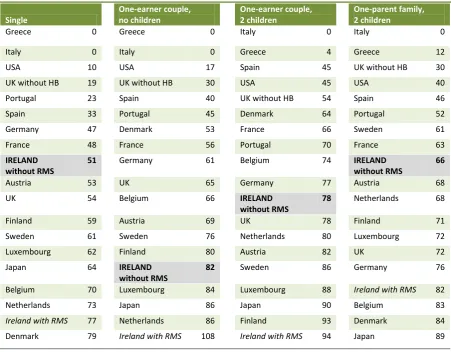
This paper focuses specifically on three topics. Firstly, it reviews how OECD data and analysis, based on illustrative examples, and not properly weighting the composition of Irish unemployment, overestimate replacement rates for Ireland: when appropriate adjustments are made, Ireland's replacement rates are in the middle of the European rankings. Secondly, microsimulation estimates for the UK and Ireland also suggest that the extent of high replacement rates is similar in the two jurisdictions – with Rent and Mortgage Supplement generating very high replacement rates in Ireland. Thirdly, estimates of replacement rates based on new CSO data for 2010, uprated to 2012, take into account the cost of childcare and travel to work. Even when these are taken into account, the paper finds that over 90 per cent of Irish people are better off in work than out of work.
1.
Fiscal Policy for 2013 and Beyond
John FitzGerald
1
I
NTRODUCTIONThe problems for Ireland today are very different from the problems of the last decade and, as a consequence, the priorities for fiscal policy in 2013 are very different. Instead of concerns about potential housing market bubbles, the issue today is how fiscal policy can best restore the public finances to sustainability and the wider economy to growth. The trajectory chosen for the restoration of sustainable public finances must take account of a range of factors, which will impact on the welfare of the Irish population. This paper considers the appropriate stance of fiscal policy for 2013 and subsequent years.
The economic crisis in Ireland is the most serious since the Second World War. While the fall in output has been greatly affected by the wider recession in the EU, the position of Ireland is particularly difficult because of multiple policy mistakes made over the past decade. A combination of inappropriate fiscal policy and a failure of financial regulation have resulted today in a legacy of huge government debts and a very large government borrowing requirement. While a substantial part of the increase in indebtedness since 2007 is directly attributable to the banking crisis (approximately 40 percentage points of GDP), a majority of the debt is the result of the dramatic deficit in the government's finances since 2007.
The challenge which has faced successive Irish governments since 2008 is how to return the public finances to a sustainable path by means of appropriate fiscal policy and how to bring the banking crisis under control. This imperative is not imposed from outside. Even before aid was sought from the EU Commission, the ECB and the IMF (the Troika)1, it was clear what needed to be done. While the broad parameters
for fiscal policy are now enshrined in a series of agreements and laws, there still remain fiscal policy choices open to the government. This paper considers the appropriate stance of fiscal policy over the coming years within the context of the EU legal framework and the related agreement with Ireland's partners in the Troika. In making these fiscal policy choices, consideration must be given to how they will affect growth in Ireland in the medium term.
Section 2 of this paper considers the EU rules on fiscal policy, which now form the essential backdrop for Irish policy making. In Section 3 the problems in measuring the fiscal stance are discussed and the magnitude of the adjustment made to date is assessed. Section 4 considers the lessons from the past experience with large scale fiscal adjustment in Ireland and elsewhere. Section 5 looks at the fiscal adjustment in Ireland to date and Section 6 draws conclusions on the appropriate approach to fiscal policy in Ireland over the next few years.
2
F
ISCAL RULESFiscal policy in Ireland must be framed within the context of a series of EU and domestic regulations. This framework includes the Stability and Growth Pact (SGP), as updated and enhanced by the Treaty on Stability, Coordination and Governance in the EMU. However, for Ireland, the key set of rules governing fiscal policy out to 2015 is contained within the agreement reached with the Troika in December 2010. Once the fiscal adjustment set out in this agreement has been completed by bringing the deficit within the limits placed by the Stability and Growth Pact (a deficit of no more than 3% of GDP), the Treaty rules will then apply to Irish fiscal policy.2
The agreement with the Troika on how the Irish fiscal position is to be brought into conformity with the Treaty, sets out the key parameters within which Irish fiscal policy is to be developed, including the broad path of adjustment of the deficit to be achieved over the period to 2015. This plan is designed to bring the government deficit under the SGP limit of 3 per cent of GDP by that date. In particular it specifies in billions of euro the amount of fiscal "effort" to be undertaken each year to 2015. It is this latter commitment on fiscal "effort" which is especially binding.3
The present plan sees the final stage of the adjustment being completed in 2016 or 2017. While this agreement on the fiscal "effort" each year is binding as a lower limit, it is open to the Irish government to undertake a more rapid adjustment than specified. It is also open to the Irish government to choose the fiscal instruments, taxes and expenditure, that it uses to meet the target in each year.4
2 The debt reduction benchmark in the Treaty comes into play from 2018 onwards.
3 The IMF in their summer 2012 report said, "Staff continues to support the accommodation of revenue shortfalls in the
event of significantly weaker growth out-turn in order to protect the fragile economic recovery, and spreading over subsequent years the closure of any emerging fiscal gap arising from this accommodation." IMF, 2012, paragraph 33. In other words, if the deficit target was missed because of a cyclical downturn, additional fiscal measures might not be appropriate. However, it is not clear how the EU Commission or the ECB would view such a shortfall.
4 While the composition of the adjustment needs to be discussed with the Troika, it is clear that, in practise, they generally
Once Ireland conforms to the Treaty requirements and what is called the EU "excessive deficits procedure" ends at the end of 2015 (because the deficit has been reduced below 3 per cent of GDP), the Treaty rules themselves will provide the framework for fiscal policy choices in subsequent years.
The fiscal rules which underpinned EMU since its foundation were enshrined in the Stability and Growth Pact. These rules placed a limit on the government deficit of 3 per cent of GDP and the government was meant to balance its budget over the cycle. However, over the last decade a number of countries, among them Germany and France, broke these rules without facing serious consequences. In the case of Ireland, up to the current crisis these rules were generally observed. However, as discussed later, this did not mean that fiscal policy was either wise or safe. The position in Spain was rather similar to that in Ireland, with the government running surpluses in 2005-7, Conefrey and FitzGerald, 2010.
However, the existence of the SGP rules and the fact that the government was observing them gave a false sense of security in both Ireland and Spain. It also meant that key external observers of the Irish economy tended to look first to the rules and their implementation rather than to the innate wisdom of domestic fiscal policy. O'Leary, 2009, has analysed the contemporary assessment made by the IMF and the EU of Irish fiscal policy and he shows that these external observers did not pick up the dangers inherent in the very rapid growth then under way. The presence of the fiscal rules, embodied in the SGP, provided a smoke screen distracting observers from what was really happening. This highlights the potential danger of relying too much on simple rules, whether the rules are those enshrined in the SGP or in the Treaty passed earlier this year. The wisdom of fiscal policy still needs to be tested against a broader range of indicators.
The origin of the recent Treaty establishing enhanced fiscal rules for the EU lies in the current crisis, which has demonstrated a serious failure in public policy in many EU members. The need for enhanced solidarity between EU members, arising from the crisis, has seen the provision of very substantial loans on generous terms by the bulk of EMU members to Ireland, Portugal and Greece. In turn, the lenders have understandable concerns that measures be taken to ensure that these loans will be repaid: hence the desire of the creditor countries to see all EMU members incorporate legal restrictions on fiscal policy in their states, which will ensure that loans will be capable of being repaid.
economic dangers was the rapidly rising imbalance on the current account of the balance of payments. This indicator does not figure in the treaty. Thus nothing in the Treaty would prevent a repetition of the current disasters in Ireland and Spain. However, the EU Commission is also empowered to start an "excessive imbalances procedure" in the future, should it feel that it is appropriate. While much weaker than the Treaty provisions, this does give scope for action at an EU level if fiscal policy mistakes were to be made in the future along the lines of the mistakes made in Ireland and Spain over the last decade.
3
M
EASURINGF
ISCALS
TANCEIt is important to consider how fiscal policy – high level decisions on taxation and expenditure – actually impacts on the macro-economy. A frequently expressed view equates a government deficit with a stimulatory policy and a government surplus with a contractionary policy – this is an inappropriate simplification.5 In fact, a
surplus could actually reflect a stimulatory fiscal policy, where the government, through tax and spending policies, was raising the level of demand in the economy. A deficit could also reflect a contractionary policy, as it does today, where the government is implementing major cuts. While the government over much of the last decade observed the Stability and Growth Pact by running a surplus, it was actually pursuing a stimulatory policy, adding to demand in an inappropriate manner, Kearney, 2012. This was because the surplus arose from exceptional revenues that resulted from an abnormally high level of activity in the economy. By contrast, the fact that the government is today running a huge deficit does not mean that the government is stimulating the economy. In fact, the large deficit masks a fiscal policy which, of necessity, involves raising taxation and cutting expenditure – taking more money out of the economy - with a major negative impact on domestic demand.
To understand the impact that fiscal policy has on the economy using published data takes some unravelling.
Firstly the data that are most readily available on the public finances do not properly capture what is going on. Government accounting practises date back to the 19th
century British administration. To understand what is going on, it is necessary to use data on a standard national accounting basis. These data are consistent and readily reconcilable with the approach used by the EU Commission. However, because the budgetary process is not based on these data, they appear with a significant lag. Among other things, these national accounting data avoid double counting as they net out transfers within the government sector and they include extra-budgetary
funds, which are properly part of the government sector. It would help the policy making process if the approach to government accounting in Ireland was changed so that the data published in a timely manner better reflected what was actually happening, FitzGerald, 1986 and 2012a. In particular, it would help inform debate on fiscal policy in the Oireachtas and in civil society generally.
Secondly, to estimate the macro-economic impact of fiscal policy it is important to separate the effects of the economy on the public finances from the effects of discretionary changes in fiscal policy on the wider economy – separate the chicken from the egg! The recent EU Treaty on fiscal responsibility acknowledges the importance of this task by casting targets for government borrowing in terms of the structural deficit7. However, while this is the correct approach to understanding
what fiscal policy is doing, it is difficult to implement in practise.
One example of the approach used to calculate the structural deficit is that employed by the EU Commission. They derive the structural deficit by applying the same economic model to each member state; some of the key parameters in the model are identical for each country, in spite of clear differences in economic structure. They use this model to first calculate potential output – the level of output that is sustainable on a long-term basis. They then calculate the implications of this level of output for the public finances and show the difference compared to the actual outturn for a particular year (where the actual outturn is conditional on actual rather than potential output). The difference between the structural deficit and the actual deficit is then attributed to cyclical factors.
However, there are a number of problems with this approach when it is applied to the Irish economy, Bergin, et al., 2010a and 2010b. The structure of the Irish economy is different from that of other economies in terms of the share of capital and labour in value added. Also, these shares are changing over time, rather than being constant. However, the most serious problem with the EU mandated methodology8 is that it derives the "non-accelerating wage rate of unemployment"
(NAWRU), a crucial element of the model, using a moving average of past unemployment rates. As the process gives a substantial weight to recent experience, it produced a very low NAWRU for Ireland up to the crisis, underestimating the inflationary pressures in the labour market. By contrast, it produces a very high
6 Last year the government national debt figure double counted one element of the debt because of a failure to take
account of the complexities of the accounting approach being used. See http://www.finance.gov.ie/documents/ publications/reports/2012/externalrevdept.pdf.
7 The structural deficit is the deficit that would exist if the economy was producing at its potential. The difference between
the actual deficit and the structural deficit is then attributed to cyclical factors, which result in the economy producing below potential.
8 EU officials stress that this is the methodology they are mandated to use. In private they accept that it has limitations and
structural (NAWRU) unemployment rate for Ireland after the crisis that takes no account of how the labour market actually operates. In turn, this produces very strange results for potential output.
As long ago as 2003, the Department of Finance drew attention to the problems with the methodology used by the EU Commission, Department of Finance, 2003. When the methodology was applied to Ireland it produced perverse results. For example, the Stability Programme Updates using this methodology published with the Budgets for 2005, 2006 and 2007 all suggested that budgetary policy in the relevant year was contractionary whereas, as Kearney 2012 shows, it was expansionary. De facto the Department of Finance, in repeatedly raising concerns with the methodology, recognised that this was an incorrect conclusion. If anyone had believed this interpretation of the economy they would have concluded that fiscal policy was appropriate whereas, even at the time, it was clear that it was too stimulatory, FitzGerald et al. 2005. This year, in the Stability Programme Update published with Budget 2012, the application of the EU methodology to Ireland suggested that that the Irish economy would show signs of overheating in 2014 and 2015. In the face of such a conclusion, the Department of Finance, in a rather deadpan way, said that such a conclusion "does not appear realistic".
FIGURE 1 Estimate of Fiscal Stance
Source: Kearney, 2012.
There is a range of different approaches to estimating the impact of fiscal policy on the economy and Kearney et al., 2000, discussed their advantages and disadvantages. Kearney, 2012, has applied one of these approaches, which appears robust and straightforward, to derive the results set out in Figure 1. In that paper she
-2.5 -2.0 -1.5 -1.0 -0.5 0.0 0.5 1.0 1.5
2008 2009 2010 2011 2012*
Fiscal Stance % of GDP
used the indexation rules in the HERMES macro-economic model to compare what would have happened to government borrowing each year if the government had adopted a "neutral" budgetary stance – neither pumping money into the economy through discretionary changes nor taking it out – with the actual outturn. In this case a neutral policy is characterised as one where there is no change in tax rates (excepting indexation of specific excise taxes) and no change in real welfare rates9 or
in the volume of government expenditure.
The results, shown in Figure 1, indicate that the budgets of 2010-2012 were seriously contractionary, given the amount of money that the government, of necessity, had to take out of the economy. This come as no surprise. However, on the face of it, the rather limited contraction arising from the 2009 budget looks surprising. The fact that the 2009 budget was not seriously contractionary was due to the fact that prices were falling. This meant that, even with cuts in expenditure in nominal terms, the real value of that expenditure in some cases increased. This was particularly important in the case of transfers (welfare payments). While payment rates were held constant (or suffered a limited reduction), the real value of the transfers increased and this is reflected in the results in Callan et al., 2012. The analysis in this latter paper indicates that the 2009-11 budgets, when taken together, were quite redistributive in their impact.
Kearney, 2012, also puts the current fiscal adjustment in the context of the previous major fiscal adjustment in Ireland in the 1980s. This shows that the current period of fiscal adjustment, while more severe than that of the average of the 1982-6 period, is actually less severe than the adjustment over the period 1987-9. While this does not make the current period of austerity feel any better, the fact that the economy recovered in the 1990s from the after effects of the cuts of the 1980s does provide some reassurance that austerity does not necessarily do serious lasting damage to the potential growth rate of the economy10.
Having identified the size of the "discretionary" change in fiscal stance in each of the years 2010-2012, it is useful to consider what has been the impact of this "austerity" on the wider macro-economy. In modelling the impact of a tightening of fiscal policy in any country there are four main channels through which it can affect output.
9 Hermes uses a weighted average of the private consumption deflator and the average wage rate to index welfare
payments.
10 The economy in 1990 was significantly below EU average output levels leaving significant scope for catch up. This is not
Firstly, a contractionary fiscal policy, by taking money out of the economy, serves to reduce domestic demand. In turn, this has negative multiplier effects affecting output and employment. While in a small and very open economy these effects will be more limited than in closed economies, Barrell, et al., 2009,, they are, nonetheless, quite significant. Such a contraction in domestic demand has other more complex effects on the economy. For example, it reduces inflationary pressures, especially in the labour market, improving competitiveness and raising potential output in the future. To estimate the final impact on an economy of a contractionary fiscal policy requires an economic model that captures these different mechanisms. Below we describe the results obtained using the HERMES model to undertake this analysis for Ireland.11
Secondly, where a country has a separate currency with an independent Central Bank and a separate monetary policy, a tightening of fiscal policy, ceteris paribus, will generally result in a loosening in monetary policy.12 This is because a tightening
of fiscal policy has a deflationary effect allowing the Central Bank to cut interest rates. Such a loosening can, to some extent, offset the negative impact on domestic demand of the fiscal tightening. However, this is not applicable to individual EMU members as the ECB sets monetary policy conditional on inflation expectations at the level of the Euro Area. Thus fiscal action in any individual member of the EMU will not result in offsetting monetary policy action by the ECB. In addition, when interest rates are already very low (as they are in EMU, the UK and the US), it is not possible to use standard monetary policy to offset a contractionary fiscal policy.
The third channel through which fiscal policy can affect the economy is by means of its effect on financial markets' perception of risk. Before EMU, the potential effects of exchange rate changes resulted in a substantial risk premium attaching to cross border lending. However, with the advent of EMU and the ending of exchange rate risk this channel was largely ignored within EMU until the crisis hit.13 However, since
2008 we have seen how the bond markets have reacted in an extreme manner to the uncertain state of the public finances in countries such as Ireland. It is now clear that financial markets' perceptions concerning the sustainability of the public finances in Ireland have had a very big impact on interest rates. For example, the high risk premium charged on government borrowing in Ireland and Spain is also
11 The HERMES model was specifically designed for such a task, Bradley et al., 1993 and Bergin et al., 2003. The results
discussed here are based on the work of Kearney, 2012.
12 This depends on the objectives of the Central Bank.
13 Honohan, 1999, considering the pre-EMU period, comments on how interest rates in Ireland rose in 1986 when it
affecting domestic utilities and business in those economies. What this means is that even within EMU, the interest rate charged to the government, and also to domestic agents, is affected by fiscal policy. A sustained reduction in borrowing will, over time, produce a reduction in interest rates. When this factor is taken into account, it significantly affects the interpretation of the more standard multiplier approach to assessing the impact of fiscal policy. The IMF in their World Economic Outlook provided a good discussion of the literature on the importance of this channel, IMF, 2010. This issue was addressed in Bergin et al., 2010b in analysing the impact of the fiscal policy stance on the Irish economy.
The fourth channel by which fiscal policy affects the economy is through its effect on the stock of debt. While borrowing money to fund expenditure in the current year may raise demand and GDP, the interest paid on that debt in future years will reduce growth in the second and subsequent years. Whether the effect on national welfare of the cumulative cost of future interest payments offsets the benefits of the impact effect of the stimulus depends on the rate of interest paid and the rate of time discount of the public.
Here we analyse the possible impact of the fiscal policy stance for the years 2010-2012 taking account of only the first channel – the multiplier effects on domestic demand. The major drawback to this analysis is that, while it captures the negative impact effects of the austerity, it takes no account of the impact of the austerity on interest rates for government borrowing in the long term, where domestic government bond rates include a very substantial risk premium relative to German rates. However, this analysis is, nonetheless, useful in helping understand the recent performance of the Irish economy, in particular in the year in which the cuts were implemented.
Since Ireland entered into the agreement with the Troika in December 2010, interest rates for government borrowing have been set exogenously as part of that evolving agreement with the lenders. Thus government interest rates in the short run in Ireland have not been directly reduced as a result of the contractionary stance of fiscal policy.15 This has meant that the full negative multiplier impact of the
contractionary fiscal stance has been felt by the economy. However, we are seeing how fiscal policy action to bring the public finances under control is beginning to influence the market rate for government bonds. It is this latter rate which will be
14 The contrast between the experience of Irish companies and companies in stronger EMU member states is illustrated by
what happened in the first week in September 2012 when the Irish Electricity Supply Board raised funds at 6.25% a year whereas Electricité de France paid 2.7%.
15 However, it is clear that the Troika would not have funded the Irish adjustment without such a fiscal stance- the cut in
relevant if and when the Irish government returns to funding itself on the market from 2014 onwards.
Here we use the HERMES model to analyse the impact of the discretionary changes in fiscal policy, shown in Figure 1, over the period 2010 to 2012. The discretionary changes in different categories of taxation and different categories of expenditure were analysed in Kearney, 2012, and we use the model analysis underlying that paper to estimate the overall multiplier effect. When the effects of the different fiscal measures are aggregated for each year we arrive at the overall impact on the economy in that year. For simplicity we do not consider the effects in the second and subsequent years after each budget.
The results suggest that the effect of discretionary fiscal policy on the growth of GDP ranged from minus 0.6 per cent in 2010 to minus 1.0 per cent in 2012. Thus, in the absence of the necessary contractionary fiscal policy, there would have been no fall in output in 2010 and real growth in 2011. This year, 2012, the effect of the necessary tightening of fiscal policy is to reduce the rate of growth in GDP from around 3 per cent to the current forecast of 2 per cent. As indicated above, these estimates take no account of favourable effects of austerity on interest rates, future interest payments and, hence, future growth.
4
P
ASTE
XPERIENCE OFF
ISCALA
DJUSTMENTSIn understanding how the current sustained period of fiscal adjustment may affect the economy, it is useful to look at previous Irish experience in the 1980s and also at the experience of one or two other countries that also had periods of sustained adjustment. The Irish experience of fiscal adjustment in the 1980s has been analysed in many papers (Honohan, 1999 and Honohan and Walsh, 2002, Perotti, 2011). Some of the conclusions drawn in early research in the 1990s (the "expansionary fiscal contraction") have not stood the test of time.16
A good summary of the literature on fiscal adjustment is provided in IMF, 2010. Among the more robust conclusions are that fiscal consolidation is, generally, contractionary, Guajardo, Leigh and Pescatori, 2011, and cutting expenditure is generally more successful than increasing taxes. If nothing else, because of the difficulty in implementing cuts in expenditure their implementation demonstrates greater commitment to reform than increases in taxation; this may prove more convincing to citizens and to markets. In practice, both cuts in expenditure and increases in taxation are generally necessary for a successful adjustment. Because of
the low tax take in Ireland at the beginning of the current crisis both Honohan, 2008, and Lane, 2008, recommended increasing taxation as well as cutting expenditure as part of the necessary fiscal adjustment this time out.
In the last major economic crisis in Ireland, the early 1983-4 period of that crisis saw increases in taxation and cuts in capital expenditure, but no major cuts in current expenditure. As Kearney, 2012, shows, there was then a premature easing off in the fiscal adjustment in 1986 and it had to be recommenced with renewed vigour in the 1987-9 period. In this latter period a major part of the adjustment involved cuts in current expenditure. With the benefit of hindsight it would have been better to have undertaken the 1980s adjustment in a tighter time scale, Honohan, 1999. Also, in the initial phase it should have prioritised cuts in current expenditure. Nonetheless, the adjustment of the 1980s also necessitated an increase in taxation, though this increase should have been implemented in a different manner than was actually the case, Honohan and Irvine, 1987.
The experience of Ireland in the 1980s and of Finland and the UK in the 1990s is interesting in the current context as they all had to undertake large fiscal and current account adjustments. This is similar to the situation in Ireland and Spain in 2008 and 2009. In each case the countries involved were living beyond their means and both the imbalance on the current account of the balance of payments and the imbalance in the government accounts needed to be addressed.
FIGURE 2 Adjustment in Government Borrowing and in the Current Account, Ireland and Finland
On the x axis the years are numbered from the beginning of the adjustment in each country. Source: EU AMECO database.
-20 -15 -10 -5 0 5 10
1 2 3 4 5 6 7 8 9 10 11 12
Years of adjustment
%
o
f G
DP
The experience of Ireland in the 1980s, and Finland and the UK in the early 1990s all suggest a certain pattern to such adjustments. The tough fiscal adjustment, when commenced, results in a major fall in domestic demand affecting output (GDP). In turn, this results in a big improvement in the current account of the balance of payments (Figures 2 and 3). This initial improvement in the current account normally occurs as a result of the reduction in domestic demand and, hence, in imports. However, the improvement in the underlying government structural deficit is masked by the negative cyclical effects of the reduction in growth arising from the contraction in domestic demand. It is only when the necessary adjustment in the structural deficit nears completion, and the negative multiplier effects of the contractionary fiscal policy ease off, that the full reduction in government borrowing becomes apparent.
FIGURE 3 Adjustment in Government Borrowing and in the Current Account, Ireland and the UK
On the x axis the years are numbered from the beginning of the adjustment in each country. Source: EU AMECO database.
[image:22.595.72.526.300.611.2]only once the contractionary fiscal policy neared completion that the cyclical effects on the deficit disappeared and the actual deficit then improved more rapidly.
In each case the adjustments took the best part of a decade and the improvement in the current account preceded the improvement in the government balance. When accompanied by world growth, as was the case for Ireland in the late 1980s, the adjustment was less painful. In the case of Finland the fact that there was also a financial crisis aggravated the initial loss in output. Also, in these three cases the exchange rates of the relevant economies were not fixed.
We are seeing a rather similar adjustment pattern in Ireland in recent years. There has already been a very substantial turnaround in the current account of the balance of payments in Ireland, with a substantial surplus in prospect this year, following on surpluses in 2010 and 2011. The progress on government borrowing, as measured by the actual deficit rather than the structural deficit, is much slower. However, if Ireland in the future follows the pattern of these three earlier adjustment episodes, once the structural deficit has been eliminated and austerity ends, a return to "normal" growth is likely to result in a further reduction in the cyclical component of the deficit.
5
F
ISCALA
DJUSTMENT TOD
ATEFrom the summer of 2008 onwards the Irish fiscal position deteriorated very rapidly. Beginning in autumn 2008 with the Budget for 2009, the authorities responded to this deterioration with an austerity package designed to stabilise the deficit. However, the speed with which the deficit widened over the autumn and winter of 2008, even in the face of these measures, warranted a supplementary budget in the spring of 2009. It was not until 2010 that the measures undertaken were sufficient to see the deficit begin to stabilise (excluding once-off funding for the banking system). Table 1 summarises the ex ante17 measures undertaken over the period 2008-2012; in total they were equivalent to almost €24 billion or 14.8 per cent of GDP18. By the
end of 2010 the general government deficit had stabilised, albeit at the very high level of 11 per cent of GDP (excluding costs of bank recapitalisation).
In November 2010, the then Irish government published plans for a fiscal adjustment programme for the period 2011 to 2015. This was designed to bring the deficit below
17 As discussed later, the effect of announced cuts on the government deficit is typically substantially less than the amount
of the actual cut because of the negative multiplier effects. In addition, many "changes" in government expenditure and taxation are not meaningful changes in an economic sense as they are just compensating for the effects of inflation – they don't involve a volume change.
18 The total fiscal adjustment is first expressed as a percentage of the nominal GDP for each year and the numbers for each
3 per cent of GDP by the end of the adjustment period in 2015. This plan was then adopted without significant change in December 2010 as part of an agreement underpinning the package of loans from the EU/IMF designed to help fund Irish debt over the period 2011-2013. In this sense it is an Irish strategy for addressing the crisis, not one imposed from outside.
TABLE 1 Summary of Actual and Planned Austerity Measures over Period 2008-2015, €bn.
2008-2010 2011 2012 2013 2014 2015 2011-2015 Revenue 5.6 1.4 1.6 1.3 1.1 0.7 6.1 Expenditure 9.2 3.9 2.2 2.3 2.0 1.3 11.7
of which Capital 1.6 1.9 0.8 0.6 0.1 0.0 3.3
Total 14.7 5.3 3.8 3.5 3.1 2.0 17.7 Per cent of GDP 9.2% 3.3% 2.3% 2.1% 1.8% 1.1% 10.6%
Source: Department of Finance Budgets. GDP figures revised based on CSO: National Income and Expenditure, 2011 and Duffy, et al., 2012.
As shown in Table 1, roughly two-thirds of the actual and planned austerity package over the period 2011-15 relates to cuts in expenditure, both current and capital. In 2009 and 2010 significant cuts in public sector pay levels19 were introduced,
equivalent to up to 15 per cent of gross salary. There have also been very large cuts in expenditure on capital projects. On the revenue side, taxes on income have been raised substantially over the period 2009-11. In the next three years, 2013-2015, the planned consolidation measures total €8.6 billion, or 5 per cent of GDP. This means that approximately three quarters of the planned cuts over the period 2008-2015 of almost 20 per cent of GDP have already been implemented.
TABLE 2 Official Target Deficit on General Government Balance (excluding banking transfers).
2011 2012 2013 2014 2015
€ billion 14.7 13.1 12.4 8.1 5.0
% of GDP 9.2 8.0 7.3 4.6 2.7
Target deficit at end 2010:
% of GDP 10.6 8.6 7.5 5.1 2.9
Source: Department of Finance Stability Programme Update. The figures for the GGB in € billion in that document have been expressed as a percentage of the rebased numbers for nominal GDP using the latest CSO National Income and Expenditure, 2011.
Table 2 takes the revised target General Government Balance (GGB) in € billion, announced by the previous government, and updated by the incoming government in Budget 2012, and expresses it as a percentage of the latest estimates for GDP. These GDP figures have been revised to take account of the latest CSO National Income and Expenditure, 2011. Table 2 shows that the outturn for the GGB for 2011 and the forecast outturn for 2012 are significantly ahead of the target set at the end of 2010. No account has been taken here of knock-on effects of the outperformance
[image:24.595.70.531.201.286.2] [image:24.595.72.527.516.588.2]in 2012 on the deficit for later years. However, in Table 2 we have taken account of the upward revisions to the GDP figures by the CSO in the summer of 2012. Assuming that the fiscal effort remains as planned (defined in terms of € billion of cuts) and that there is no major change to the economic forecasts for 2013-15, this would suggest that a continued outperformance is possible. This leaves significant leeway to ensure that the deficit targets are met, even if there were a downward revision in GDP forecasts for the period 2013-15.
With the benefit of hindsight, the plan drawn up in November 2010 by the Department of Finance and the outgoing government did not over-promise, which was a wise decision. By making very conservative assumptions on the response of the public finances to economic performance, they built in very considerable scope for outperformance. However, while the economic forecasts at the time looked conservative, as it has turned out they were not conservative enough because of the unexpected continuation of the crisis at an EU level. Thus, even with a more disappointing background economic performance, the public finances have continued to outperform the targets set in the 2010 plan. This is reassuring to the financial markets.
A second aspect of the 2010 plan was that it did not promise to make the adjustment to the public finances more rapidly than was readily deliverable by the outgoing government or, even more important, by the incoming government. At the time, in autumn 2010, in order to minimise the long-term economic damage it might have been wise to make the fiscal adjustment more rapidly. However, if a more accelerated adjustment programme had been chosen and if it had proved undeliverable politically this would have served only to demoralise, damaging consumer and investor confidence.
TABLE 3 Spanish Targets for Government Borrowing, % of GDP
Stability Programme Update of: 2010 2011 2012
2010 9.8 7.5 5.3
2011 6.0 4.4
2012 9.3 8.5 5.3
Source: Spain, Stability Programme Updates.
has turned out, partly because of the renewed slump in the EU economy, the deficit for 2011 proved to be 8.5 per cent of GDP, not 6 per cent. In addition, the target for 2012 has now had to be revised back up to 5.3 per cent of GDP, the same target that had originally been set in the Stability Programme Update in early 2010, Spain, 2011 and Spain, 2012.
The adjustment in the Spanish public finances planned in April 2011, Spain, 2011, was much more ambitious than was the case in Ireland. However, because of a failure to meet this more ambitious target, the financial markets have now lost faith in the ability of the new Spanish government to deliver and Spanish bond yields have risen above bond yields for Ireland. By contrast, in the case of Ireland, sure but steady progress has been rewarded.
6
S
TRATEGY FORF
ISCALP
OLICY2013-2015
6.1 Budget 2013
As argued above, the fiscal strategy for tackling the current crisis, which was put in place at the end of 2010, was broadly appropriate. The chosen adjustment path was predicated on an assessment of the prospective growth in the potential output of the economy. Having agreed an appropriate strategy, and having successfully implemented it over nearly two years, it should only be changed if new information appears suggesting that the potential output of the economy is significantly lower than previously understood (and hence the structural deficit is higher than expected). To date the tradable sector20 of the economy has behaved as one would
expect – it has proved reasonably robust in the face of the huge shock to the rest of the economy21 – indicating that the potential output of the economy is robust.
The overriding priority for fiscal policy next year will be to continue the process of restoring the public finances to sustainability. Because of the uncertainty inherent in any forecasts of the future it is important to try and frame policy on a "no regrets" basis: to ensure that whatever the outcome on economic growth, fiscal policy will not be inappropriate. As discussed above, with the current plan there was significant scope for outperformance. That means that, even if growth in the EU is disappointing next year, the target for the deficit may still be achievable. However, if the EU economy continues in recession, and if that were the reason that targets might not be met, a resulting higher than expected deficit would be attributable to cyclical factors, not a change in the structural deficit. Under these circumstances the fiscal stance should not be adjusted as the cyclical factors, of their nature, would
20 The tradable sector includes manufacturing and a significant part of the market services sector that also exports
extensively.
eventually be reversed. This is also the approach to policy taken by the IMF in their recent report on the Irish economy where they recommend sticking to the current adjustment plan, even if the targets were to be missed due to lower than expected EU growth, IMF, 2012.22
While the public finances have outperformed the plan to date, there is still a long way to go before sustainability is guaranteed. Thus it is much too early to start "coasting" and ease off on the adjustments required in 2013-15. Hence the cuts planned for 2013 should be implemented in full in the coming Budget, as is required by the agreement with the Troika. (This would be the correct policy to follow even if there were no agreement with the Troika.) This will involve cuts or tax increases amounting to €3.5 billion ex ante next year. There will be some carryover from the decisions announced in the Budget for 2012 which will reduce, to a limited extent, the new measures to be taken next year. Nonetheless, achieving the full planned cut in expenditure next year of €2.3 billion will be very difficult.
A rather different approach was proposed by the Irish Fiscal Advisory Council (IFAC, 2011 and IFAC 2012). They argued for a much more rapid adjustment in the public finances. In particular they sought cuts for 2012 of €4.4 billion rather than the €3.8 billion implemented in the Budget. They argued that such a change in policy was warranted because the government might not meet their target for the deficit, especially in 2012, and also because they felt that it was desirable to reduce the actual deficit more rapidly than planned to 1 per cent by 2015.
The arguments concerning the likely outturn for 2012 centred on the unexpected weakness in economic activity, not a reassessment of the potential output of the economy. As argued above and in IMF, 2012, fiscal strategy should not be altered where targets are not met because of purely cyclical factors. In any event, as discussed above, in spite of the unfavourable external economic environment, it now seems likely that the deficit for 2012 will still come in ahead of target, Duffy, Durkan and Casey, 2012.23
As discussed earlier, previous experience with fiscal adjustments suggested that there might have been advantages to targeting a more rapid adjustment than was eventually agreed in 2010. This is a view clearly shared by IFAC. However, having
22 Outside the range of "normal" forecasts there is still the unlikely possibility that the euro area could collapse over the next
eighteen months. Today this seems very unlikely, not least because of the very adverse consequences for all EMU members. If it did happen the consequences for Ireland would be very serious. However, there is no way of "insuring" against these very serious consequences through the choice of an appropriate use of fiscal policy.
23 The assessment by IFAC may also have been affected by the very unsatisfactory nature of the statistics available, which
adopted a workable plan and having implemented it successfully for two years, a lot of credibility has been built up with financial markets and with the people of Ireland. To signal a change in policy now could discredit the policy. The question could then be asked of the planned fiscal adjustment "if it is not broke why fix it?". In addition, when comparing the Irish adjustment with that in Spain, there is a lot to be said for setting politically achievable targets which will actually deliver the planned fiscal adjustment. Hence there are good reasons why the "bar" should not be raised today by planning for even tougher measures in 2013.
In summary, having set out an appropriate medium-term fiscal plan, it is best to stick to it unless there is new information suggesting that the size of the structural deficit is substantially greater than previously estimated. This approach builds credibility with citizens and with financial markets. To date this has meant that the outperformance on the public finances has been reflected in lower deficits rather than in any modification in fiscal stance. However, should the effects of cyclical factors see the deficit exceed the target in a particular year, it would also be appropriate to leave the fiscal stance unchanged.
6.2 Medium-Term Fiscal Strategy
The medium-term fiscal plan involves further fiscal tightening in 2014 and in 2015. As with 2013, in the absence of any new information about the structural deficit, it is appropriate to stick to this plan. It is possible that by 2015 the structural deficit might still be significant but it is also possible that it could have disappeared by that date. As argued in Bergin et al., 2010b, much will depend on the timing of a return to growth in the EU economy. With reasonable EU growth in 2013, once the fiscal adjustment is largely completed, there is a likelihood that the Irish economy will also return to significant growth. Even if the response were somewhat less satisfactory, with a substantially delayed EU recovery, so that a small structural deficit (but a larger than planned actual deficit) remained in 2015, the task of eliminating it would be still be manageable. However, if events in the coming years suggest that the growth rate of potential output is much lower than that currently envisaged, then a further tightening in fiscal policy would be necessary. Until we get closer to the end date of the current adjustment (2015) and there is greater clarity about the potential output of the Irish economy (and hence the structural deficit) it is best to stick to the agreed package of cuts and tax increases.
deficit by the middle of the decade will produce higher growth in the long run and will be welfare improving in the long run.
Once the structural deficit has been eliminated, what should happen to fiscal policy? It will almost certainly be appropriate to run a surplus over the economic cycle post 2015. However, as discussed earlier, it should be stressed that a surplus does not constitute a contractionary fiscal stance. It is the change in the structural surplus or deficit which affects the economy. Once the desired surplus is achieved, maintaining a structural surplus unchanged over time would not involve contractionary (or stimulatory) effects on the economy: it would be neutral in its economic effects, contrasting with the strong negative impulse coming from fiscal policy today.
6.3 Reducing the Debt
As well as eliminating current borrowing, an important task of fiscal policy will be to reduce the burden of debt to a safe level over a period of years. A lot of attention has focused elsewhere at EU level on this need to reduce the indebtedness of states. This is undoubtedly important to ensure that states will in future be in a position to deal with new shocks. In the case of Ireland there is also the issue that, while it faces favourable demographics out to 2025 or 2030, it would be appropriate to rebuild a buffer of assets (reduce debt) to insulate against the economic costs of ageing post 2030.
The traditional approach taken by the EU and the IMF to the issue of debt reduction suggests that Ireland run a substantial surplus over the period to 2030 to get the debt/GDP ratio back down to 60% by that date. The objective of debt reduction is correct but much of this discussion on debt reduction has ignored the most appropriate and least costly way to bring about a substantial once off reduction in Ireland's indebtedness. This would involve returning the nationalised banks to profitability and eventually selling them off later this decade to recoup a substantial part of the state's forced investment in them.
As of July 2011, according to the stress tests, the book value of the not-so-bad banks24 was around 20% of GDP. Nonetheless, if sold today they would not find a
buyer and the valuation of the state's investment in the banks by the National Pension Reserve Fund is very low. This reflects the continuing uncertainty about the future of the economy and of the banks themselves. A key objective for the government must be to first return the economy to growth and then to return the banks it owns (or part owns) to profitability. Later in the decade these profitable banks should be sold. This could achieve a once off major reduction in the debt/GDP level.
The big danger to such a favourable outcome is, firstly, that the EU and Irish economies do not return to growth within a reasonable time scale. However, if growth is restored then the second policy danger is that the state, as shareholder, could fritter away its investment in these banks by forgiving debt that would otherwise be repaid, or selling assets at fire-sale prices. Such a mistake could be very costly for the people of Ireland and it would also necessitate running a significantly larger government surplus over the longer term than would otherwise be necessary.
A simple way of ensuring value for money from the surviving banks (excluding the IBRC) would be to swop the government's equity in the banks, valued as at July 2011, with the EU ESM, in return for debt. This would involve no further payment by the ESM to Ireland – it would merely swop debt owed by Ireland for equity (shares in Irish banks) currently owned by the government. Such a deal would ensure that the debt/GDP ratio fell dramatically at an early date, further facilitating the return to sustainability. The ESM would also have a stronger and clearer incentive to ensure that the banks are returned to profitability than does the Irish government. In the ownership of the EU (through the ESM) the banks could prove to be a more valuable long-term asset than if left in Irish hands.
As a result of developments at the European Council in June 2012 such a solution, which might previously have been unthinkable, is now being seriously discussed. Hopefully these discussions will reach a successful conclusion before the end of the year. However, a successful outcome must await a similar deal being implemented for Spain.
6.4 Fiscal Policy – the Details
So far the focus of this paper has been on the overall stance of fiscal policy, not its composition. However, there is extensive evidence to guide us on how best to make the necessary cuts in expenditure and increases in taxation. Some of this evidence is provided by papers at this Budget Perspectives Conference, as well as at previous Conferences. In choosing the appropriate mix of instruments the priority for policy should be to maximise the future growth in employment. Reversing the dramatic rise in unemployment is clearly a primary goal for policy, with both economic and social benefits.
Conefrey et al., 2012, provide a ranking of taxes in terms of their impact on employment. The results of this research are consistent with the conclusions of the Commission on Taxation, 2009. This research suggests that a tax on property would have less damaging effects on employment than carbon taxes (followed by other indirect taxes). Taxes on labour – income tax and social contributions – are likely to have the most negative impact on employment.
This suggests the importance of implementing a significant tax on property. Callan et al., 2010 and Keane et al. 2012, show how a property tax can be designed to meet a range of objectives, including distributional objectives. Even with some links to ability to pay, a property tax would have little impact on marginal tax rates in employment and would have a minimum negative impact on employment.
Water charges, if implemented as part of the development of a new efficient water service, are also likely to bring efficiency gains, offsetting some of the negative effects of their cost for households, FitzGerald and Morgenroth, 2012. What will be important will be to structure the new utility to ensure that these efficiency gains are realised in practise.
Callan et al., 2009a and 2009b, have considered a range of other issues. In particular, there appear to be significant advantages to bringing child benefit payments within the tax system. This would have a less negative impact on employment than would increases in other direct taxes; it would also have favourable distributional effects and could be implemented in a way that reduced potential poverty traps. The extent and causes of "unemployment traps" is examined in detail in another paper to this conference, Callan et al., 2012.
R
EFERENCESBarrell, R., Tatiana Fic and Iana Liadze, 2009. "Fiscal Policy Effectiveness in the Banking Crisis", National Institute Economic Review, No. 207 January, pp. 43-50. Bergin, A., J. Cullen, D. Duffy, J. FitzGerald, I. Kearney and D. McCoy, 2003.
Medium-Term Review: 2003-2010, Dublin: The Economic and Social Research Institute. Bergin, A., T. Conefrey, J. FitzGerald and I. Kearney, 2010a. "Fiscal Policy for
Recovery: The Case of Ireland", Paper presented at EUROFRAME Conference, Amsterdam,
http://euroframe.org/fileadmin/user_upload/euroframe/docs/2010/EUROF10_ Bergin_et_al.pdf
Bergin, A., T. Conefrey, I. Kearney and J. FitzGerald, 2010b. "Recovery Scenarios for Ireland: An Update", in ESRI Quarterly Economic Commentary, Summer. Bergin, A., J. FitzGerald, I. Kearney and C. O'Sullivan, 2011. "The Irish Fiscal Crisis",
National Institute Economic Review, No. 217, July 2011, p. R47-
Bradley, J., J. FitzGerald, D. Hurley, L. O'Sullivan and A. Storey, 1993. "HERMES: A Macrosectoral Model for the Irish Economy" in Commission of the European Communities ed., HERMES: Harmonised Econometric Research for Modelling Economic Systems, North Holland.
Bradley, J. and K. Whelan, 1997. "The Irish Expansionary Fiscal Contraction: A Tale from One Small European Economy", Economic Modelling, Vol. 14, No.2. Callan, T., C. Keane, M. Savage, J.R. Walsh, 2012. "Distributional Impact of Tax,
Welfare and Public Sector Pay Policies: 2009-2012" special article in Quarterly Economic Commentary, Winter 2011/Spring 2012
Callan, T., C. Keane and J.R. Walsh, 2009a. "Tax Reform: Selected Issues" in T. Callan (ed.) Budget Perspectives 2010, Dublin: The Economic and Social Research Institute, Research Series No. 12.
Callan, T., C. Keane and J.R. Walsh, 2009b. Pension Policy: New Evidence on Key Issues, Dublin: The Economic and Social Research Institute, Research Series No. 14.
Callan, T., C. Keane and J.R. Walsh, 2010. "What Role for Property Taxes in Ireland?", The Economic and Social Review, Vol. 41, No. 1, pp. 87-107.
Callan, T., C. Keane, M. Savage, J.R. Walsh, K. Timoney, 2012. "Work Incentives: New Evidence for Ireland", in T. Callan (ed.) Budget Perspectives 2013, Dublin: The Economic and Social Research Institute, Research Series Number 28
Commission on Taxation, 2009, Report 2009. Dublin: The Stationery Office. http://www.commissionontaxation.ie/downloads/Commission%20on%20Taxati on%20Report%202009.pdf
Conefrey, T. and J. FitzGerald, 2010. "Managing Housing Bubbles in Regional Economies Under EMU: Ireland and Spain", National Institute Economic Review, Vol. 211, No. 1, pp. 211-299.
Conefrey, T., J. FitzGerald, L. Malaguzzi Valeri, R.J. Tol, 2012. "The Impact of a Carbon Tax on Economic Growth and Carbon Dioxide Emissions in Ireland", Journal of Environmental Economics and Management, forthcoming.
Dowling, B.R., 1978. "Budget Deficits and Fiscal Policy", in eds. B.R. Dowling and J. Durkan, Irish Economic Policy: A Review of Major Issues, Dublin: The Economic and Social Research Institute.
Duffy, D., J. Durkan and E. Casey, 2012. Quarterly Economic Commentary, Summer. Dublin: The Economic and Social Research Institute.
FitzGerald, J., 1986. Contribution to Symposium on Statistics for Policy and Research, Journal of the Statistical and Social Inquiry Society of Ireland, Volume XXV Part III, 1985/6.
Fitz Gerald J., A. Bergin, I. Kearney, A. Barrett, D. Duffy, S. Garrett, and Y. McCarthy, 2005. Medium-Term Review: 2005-2012, Dublin: The Economic and Social Research Institute.
FitzGerald, J., 2012a. "Restoring credibility in policymaking in Ireland", Public Money and Management, Vol. 32 No. 1, January, pp. 27-34.
FitzGerald, J., 2012b. "The Irish Economy Today: Albatross or Phoenix?", The World Economy, forthcoming.
FitzGerald, J., and E. Morgenroth, 2012. "Submission to the Department of the Environment, Community and Local Government on the Establishment of a Public Water Utility and the Future Funding of Water", ESRI Submission 2012/1 Guajardo, J., D. Leigh and A. Pescatori, 2011. "Expansionary Austerity: New
International Evidence", Washington: IMF Working Paper WP/11/158. Honohan, P. and I. Irvine, 1987. "The Marginal Social Cost of Taxation in Ireland".
The Economic and Social Review, vol. 19, No. 1, October, pp. 15-42.
Honohan, P., 1999. 'Fiscal adjustment and disinflation in Ireland: setting the basis for economic recovery and expansion', in Barry, F. (ed.), Understanding Ireland's Economic Growth, London, Macmillan, pp. 75-98.Honohan, P., 2008,
Honohan, P., 2008. "Not a Re-Run of the 1980s", Budget Perspectives, Dublin: The Economic and Social Research Institute.
Honohan, P. and B. Walsh, 2002. "Catching Up with the Leaders: The Irish Hare" Brookings Papers on Economic Activity, No. 1, pp. 1-78.
IFAC, 2011. Fiscal Assessment Report: October 2011. Dublin. IFAC, 2012. Fiscal Assessment Report: April 2012. Dublin.
IMF, 2010. World Economic Outlook, Washington: The International Monetary Fund, Chapter 3 "Will It Hurt? Macroeconomic Effects of Fiscal Consolidation". IMF, 2012. "Ireland: Sixth Review Under the Extended Agreement. Washington: The
International Monetary Fund, IMF Country Report 12/147, June.
Kearney, I., 2012. "Measuring the Fiscal Stance 2008-2012", article the Quarterly Economic Commentary, Autumn. Dublin: The Economic and Social Research Institute.
Kearney, I., D. McCoy, D. Duffy, M. McMahon and D. Smyth, 2000. "Assessing the Stance of Irish Fiscal Policy", in A. Barrett (ed.), Budget Perspectives: Proceedings of a Conference held on 19 September 2000, ESRI.
O'Leary, J., 2010. "External Surveillance of Irish Fiscal Policy During the Boom", Irish Economy Note No. 11, available at: http://www.irisheconomy.ie/ Notes/IrishEconomyNote11.pdf
Perotti, R., 2011. "The "Austerity Myth": Gain Without Pain?", University of Bocconi Working Paper, http://didattica.unibocconi.it/mypage/ upload/49621_20110621_121837_PEROTTIAUSTERITYMYTH20110616.PDF Spain, 2010. Stability Programme Update Spain.
Spain, 2011. Stability Programme Update Spain.
2. Benefit Integration in the UK: An E
x
Ante
Analysis of Universal Credit
1
Mike Brewer
Institute for Economic and Social Research, University of
Essex and Institute for Fiscal Studies
James Browne
Institute for Fiscal Studies
Wenchao Jin
Institute for Fiscal Studies
A
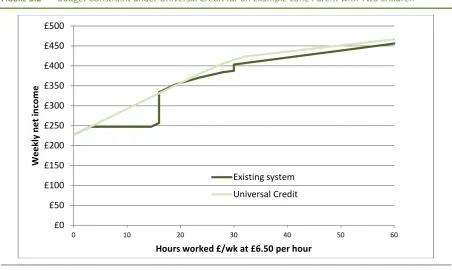
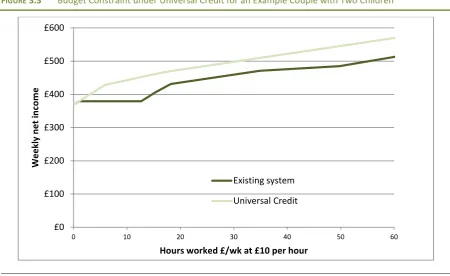
BSTRACTThe UK Government is currently preparing to implement a major reform to the welfare system by integrating (and simplifying) means-tested welfare benefits and in-work tax credits for working-age adults into a single programme, to be known as Universal Credit, and to be phased in from October 2013. The primary motivation is not to save money (although many other changes to welfare benefits have been announced since May 2010 which will save the government money). Instead, the aims are to make it easier for claimants to claim benefits, make the gains to work more transparent, and reduce the amount spent on administration and lost in fraud and error. The reform will increase entitlements to welfare payments in a way which, on average, helps low-income (working) families more than middle-income families, especially for couple families. But many details remain unclear, including how Universal Credit will interact with the new, localised Council Tax Rebate system, how tough the conditionality regime will be, particularly for working families, and whether Universal Credit can be made to respond automatically to claimants' earnings in real-time.
1 Corresponding author: [email protected]. This research was supported by the ESRC Centre for the Microeconomic
1
I
NTRODUCTIONThe UK Government is currently preparing to implement a major reform to the welfare and tax credit system by integrating means-tested welfare benefits and in-work tax credits for in-working-age adults into a single programme, to be known as Universal Credit. This paper reviews the arguments for its introduction, and updates or summarises previous work that uses microsimulation methods to examine the way that this reform will affect families' benefit entitlements and individuals' financial work incentives.
This analysis should be seen as preliminary for a number of reasons. First, full details of how entitlements to Universal Credit will be set were not available at the time of writing (August 2012). The most significant of these is that it is not yet clear how the localised Council Tax Rebate will interact with Universal Credit (and so, as we explain later, the microsimulation work analyses a world without Council Tax Rebate).2
Second, Universal Credit is likely to have complicated impacts on benefit take-up and labour supply behaviour which we have abstracted from here; these are likely to result not only from the changes to financial work incentives we describe in this paper but also the conditionality regime for Universal Credit, which will be different from, and in general tougher than, that which currently applies.
This paper is structured as follows. Section 2 gives an overview of the current system of means-tested benefits and tax credits in the UK, and the stated rationale for Universal Credit. Section 3 explains some of the key issues the Government had to confront having decided to integrate several benefits and tax credits, and outlines how entitlements to Universal Credit will be set, comparing this with the current set of means-tested benefits and tax credits. Section 4 gives a quantitative assessment of the impact of Universal Credit on household incomes and on measures of financial work incentives. Section 5 summarises and concludes. We note that the current (since May 2010) coalition UK government has announced many other changes to the benefit and tax credit system, which together will reduce welfare spending by £18 billion/year by 2014-15, but in this paper, we take those other changes as given: our analysis assesses the impact of the Universal Credit reform alone, rather than the overall changes to benefit entitlements and work incentives as will be experienced by families and individuals over the next few years; Brewer, Browne and Joyce (2011) forecast measures of income poverty in the UK through to 2020, including the impact of all welfare changes.
2
U
NIVERSALC
REDIT:
WHY IS IT NEEDED?
A
ND FROM WHERE DID THE IDEA COME FROM?
In November 2010, the UK government set out plans to integrate and simplify all means-tested welfare benefits and in-work tax credits into a single programme, to be known as Universal Credit and to be phased in from October 2013.3 The
government hopes that this will make it easier for claimants to claim benefits, make the gains to work more transparent, and reduce the amount spent on administration and lost in fraud and error.
To understand how the reform works, and why it was thought necessary, one needs to understand a little about the current system of means-tested social security benefits for working-age adults in the UK. One way to characterise this is that the UK has:
• separate, mutually-exclusive benefits providing income replacement to non-working families, or income top-ups to non-working families4, and
• separate but not mutually-exclusive means-tested benefits providing help with a family's extra costs; these can overlap both with each other and the income-replacement benefits.5
This is illustrated for a specimen family in Figure 2.1.
The current UK government argues that this leads to the following faults:
• Having separate, mutually-exclusive income-replacement benefits for families who are not in work is inefficient (for claimants and the government).
• Having separate benefits for those who are working fewer than 16 hours and for those who are working 16 or more hours adds an unwelcome barrier to those trying to move from not-in-work (or from "welfare") to work, and this particularly affects those with volatile working patterns.
3 The original announcement was Department for Work and Pensions (2010a), with the thinking developed in Department
for Work and Pensions (2010b).
4 There are: Jobseeker's Allowance (JSA), intended for unemployed people, Employment and Support Allowance (ESA),
intended for those too ill or disabled to work at the present; Income Support (IS), intended for other people, mostly lone parents with young children, who are not working and not expected to look for work; Working Tax Credit (WTC), intended for people who are in work but have a low family income.
FIGURE 2.1 Current System of Welfare Entitlements for an Example Family
Note: The entitlements are based on an assumed c