International Journal of Innovative Technology and Exploring Engineering (IJITEE) ISSN: 2278-3075,Volume-8 Issue-12, October 2019
Abstract: In this world, earthquake is a major catastrophe which creates huge amount of loss in living non living things. The prediction of an earthquake is an important task in seismology. Neural network performs a key task in the prediction of earthquake. The neural network architecture are created with different input layer and hidden layers with deep learning optimization algorithms. The input layer was developed with the parameters of historical earthquake data of India taken from India Meteorological Department (IMD). The earthquake event such as date, latitude, longitude, depth, magnitude are mathematically converted into seismic indicators depend on Gutenberg-Richter’s inverse law, are the input layers of this neural network model. The developed network model was trained with set of data items using neural network algorithms such as Backpropagation and sequential learning. The Backpropagation is used to find the magnitude prediction and sequential learning is used to find the prediction model for the cartographic risky areas. The loss and accuracy of the model are analyzed with the help of software tool, Disaster Management System which is developed for this work using Python. The deep neural network optimizers such as Stochastic Gradient Descent (SGD), Adaptive Gradient algorithm (AdaGrad) and Root Mean Square propagation (RMSprop) are used to optimize the prediction model. The optimizer produced earthquake prediction model with high ability and more accuracy. Also give the cartography which shows the seismic zone in India face earthquake in future.
Keywords : Seismology, Neural network, Deep learning optimization.
I. INTRODUCTION
A
rtificial neural network is a parallel distributed computational model based on the functions and formation of biological neural networks. The original processing elements of neural network models are called artificial neurons. Network architecture organized with nodes and layers in feedback connection manner. Each connection strength with the numerical value which is called weight[1]. Information is acquired by the network system starting its position throughout a learning process. The learning process agreed by learning algorithm, and achieve with various synaptic weights [2].Earthquakes are one of the scariest natural disasters. It creates seismic waves across the earth’s crust result of releasing huge energy. Prediction of earthquake is the foremost task in the seismology and also caring in saving human life and economy
Revised Manuscript Received on October 10, 2019
* Correspondence Author
K. Sangeetha*, PG & Research Department of Computer Science, Rajah
Serfoji Government College, Thanjavur, India. Email:
K. Mohankumar, Head, PG & Research Department of Computer Science, Rajah Serfoji Government College, Thanjavur, India. Email: [email protected]
of most of the countries. Various researchers used the computational and mathematical models for the prediction of earthquake. Now a day the neural network algorithms are used to develop the multiple prediction models. Past earthquake data taken as the input and construct the feed-forward network with Back propagation algorithm with various learning methods. Recently, the authors presented a study on earthquake prediction using various neural network algorithms [3].
The foremost intention of this work is to evaluate the accuracy of the neural network prediction algorithms using the software tool. In this paper section 2 summarize review of the neural network prediction system. Section 3 provides the neural network algorithms and their learning methods.
Section 4 explains the algorithm employed in the prediction methodology. Section 5 includes the result and discussion, and Section 6 gives the conclusion part of this work.
II. REVIEW OF NEURAL NETWORK PREDICTION SYSTEM
Many researchers are using data mining techniques to detect and forecast the natural disasters like flood, cyclones, earthquakes and tsunamis. Shaganpreet et al., (2018) suggested that clustering and classification algorithms with historical data find out the prediction pattern and recognize the similar pattern in effective way [4]. Mohankumar. K et al., (2018) developed a model using support vector machine with different kernel functions to predict the catastrophe flood [5]. Emad Amar et al., (2014) have recommended the neural network system extracts the data through learning process and analyzes nonlinear structures. Thus, the neural network gives more effective result in earthquake prediction [6].
Narayanakumar.S. et al., (2016) proposed the Backpropagation neural network model for earthquake prediction. That model provides higher prediction accuracy in the Himalayan region for the time period of 1983-2015 and concludes backpropagation artificial neural network is a best suit for the non-linear relationship [7]. Maria Moustra et al., (2011) proposed three layered Perceptron network model with Backpropagation proposed to train the network by using appropriate data and predict seismic event relatively accurate [8]. Khawaja M. Asim et al., (2017) proposed a significant computational model include various neural network architectures such as feed forward network, recurrent network, radial basis network, random forest, multi layer perceptron model and support vector machine through six mathematically calculated seismic indicators were utilized for earthquake prediction.
Prediction of Seismic zone in India using Neural
Network Algorithms
They conclude the feed forward neural network model shows higher prediction accuracy in northern Pakistan region [9].
G. Asencio-Corte´s et al., (2015) proposed the EQP-ANN model for the forecast of earthquakes of various scale magnitude in Tokyo town with five successive datasets for the year 2015. The earthquakes with the magnitude greater than 5.0 for seven days are taken for the account. The effectiveness of this method is compared to other familiar and dominant machine learning methods and concludes EQP-ANN reached better results [10]. Asim, K.M et al., (2018) proposed a hybrid Neural network prediction model with Support Vector Regressor (SVR) and Enhanced Particle Swarm Optimization (EPSO).The specified model performed the training and testing effectively with enhanced results in Chile, Hindukush and Southern California region[11].
Gueniche T et al., (2015) proposed a training model with a number of training procedures. This model is executing the predictions in sequence manner. This type of learning is used in prediction applications such as weather forecasting and stock market [12].
III. NEURAL NETWORK
The basic unit of neural network system is neurons. This system comprises of simple handling units, the neurons, and weighted associations between individual neurons. The strength of a connection between two neurons x and y is referred to as Wx,y ,which is called weight[13].
A. Backpropagation Algorithm
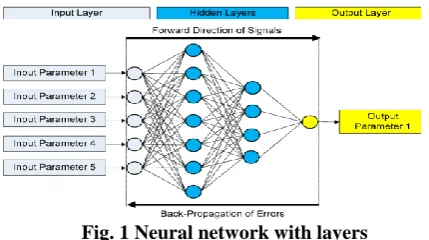
[image:2.595.56.271.499.619.2]Backpropagation is one of the most commonly used neural network learning algorithm. This algorithm executes process on a multilayer feed forward neural network. The process is iterative manner using a set of weights for prediction. This feed forward network consists of three main layers such as an input layer, hidden layers, and an output layer [14].
Fig. 1 Neural network with layers
The Fig. 1 depicts a feed forward neural network with multilayer. In this diagram the nodes represent the processing unit and the directed edges are transmitting the knowledge from one node to another node. Each processing component is able to assess a single prehistoric input data. The neural network system consists of a group of functions, which is to transform an input to output is called a network function. Each function has a specific operation and assigns the weights and biases in the network. The network errors are calculated based on the weights and biases. There are four steps in the algorithm such as feed forward computation, Backpopagation to output layer, Backpopagation to hidden layer and weight updates [15].
B. Learning Paradigm
The learning paradigm includes number of training algorithms with the optimal combination of weights. These are BFGS Quasi-Newton, Levenberg Marquardt algorithms.
Quasi-Newton Method (BFGS)
The alternative method of conjugate gradient is the BFGS (Broyden-Fletcher-Goldfarb-Shanno) Quasi-Newton method for fast optimization. The weight update of the Newton’s method is as follows,
(1) In Equation (1) Ak is the Hessian matrix of the performance
index based on the current values of the weights (w) and biases(b). The value of gk is the gradient of the error with
respect to the weight vector. To compute the value of Wk+1 is
very complex and time consuming at time of large Ak values.
The updated new weight Wk+1 is calculated using a gradient
with the current weight Wk[16].
Levenberg - Marquardt Method
The network training function of Levenberg - Marquardt Backpropagation is called trainlm. The weights (w) and bias(b) are updated based on Levenberg - Marquardt optimization. The characteristic of this algorithm is fastest and first choice supervised algorithm.
The Hessian matrix can be approximated as: H = JTJ The gradient can be computed as: g = JTe
The Jacobian matrix J includes the first derivatives of the network errors with respect to the weights (w) and biases(b). The vector of network error is represented as e. The Jacobian matrix can be calculated through a standard backpropagation technique, because it is less complex than hessian matrix [17].
C. Sequential Algorithm
A sequential training algorithm is used in the large size feed forward neural networks. This sequential training trains each and every layer separately. After successful completion of each layer, they are joined collectively. The sub optimal solution of the each network action compared to the full network training until to reach the complete optimal solution. The input is transferred into a higher space of each layer of the network. After completion of transformation, the training could be done in sequential manner [18]. The deep neural network optimizers such as Stochastic Gradient Descent (SGD), Adaptive Gradient algorithm (AdaGrad) and Root Mean Square propagation (RMSprop) are used to optimize the prediction model and find the loss function for outputs that obtain the values 1 or 0.It is called binary cross entropy. Finally the accuracy metrics is finding for the prediction model.
IV. PREDICTION METHODOLOGY
The parameters of past earthquake data are trained by back propagation and sequential algorithms.
A. Earthquake catalog
The historical earthquake data of India from the year 2012 to 2017 are collected from India
International Journal of Innovative Technology and Exploring Engineering (IJITEE) ISSN: 2278-3075,Volume-8 Issue-12, October 2019
problem. The catalog consists of 968 earthquakes recorded in India. Table I shows the preliminary data such as Date, latitude, longitude, Depth and Magnitude of earthquake [19].
Table-I: IMD Earthquake catalog
B. Calculation of Seismic Indicators for Back propagation training
The Seismic indicators are mathematically calculated values from an earthquake catalog using formulas [20].This work carried out by using eight seismic indicators taken as input given in the Table II.
Table-II: Seismic indicators -input for Back propagation neural network [19]
The three layers of the feed forward BackPropagation neural networks are input layer, hidden layer and output layer. The network model is trained by the Quasi-Newton and Levenberg - Marquardt algorithm with various training parameters. The seven input data with class values represented in Table II are fed into the input layer of prediction network model. The computation is continued until it reaches the accurate output. The difference between the predicted output and the target value is called error value. In the Back propagation calculation, the error value obtained in the preceding phase is used to adjust the weight factors of each neuron in the output layer, then the hidden layer.
The successful completion of one forward and backward calculation for each data set is called an epoch [21].The feed forward calculations uses the Equation (2) and Equation (3) to calculate the value of the neurons.
j i ij j
W
O
I
(2)j
I j
e
O
1
1
(3)
Where, Ij = net input.
Wij = Connection weight
Oi = output of unit I from preceding layer.
Θj = Bias value
Oj = Output of the activation function.
The purpose of the training is to get the predicted
magnitude of the given input parameters. Here the seismicity parameters from the year 2012-2016 are taken as training data and the seismicity parameter of the year 2017 as test data. Finally the mean average value of the output is accounted for the prediction. The below Table III give the description of the architecture and training parameter of neural network with Levenberg - Marquardt and Quasi-Newton algorithms.
Table-III: Training architecture and parameters for Backpropagation learning
C. Calculation of Seismic Indicators for sequential training
The Seismic indicators are mathematically calculated values from a catalog using formulas [22].This sequential training carried out by using eight seismic indicators taken as input given in the Table IV.
Table-IV: Seismic indicators - input for sequential learning neural network [22]
The network trained with 677 samples, validate on 145 samples. In the neural network each layer is decoupled and trained independently. After successful completion of the training each layer joint together. The purpose of the training is to get the loss value and accuracy of the prediction model of the given seismic indicators. Finally the loss value and the accuracy of the prediction model is finding with different optimization function. The following Table V gives the description of the training architecture and parameters for the sequential learning neural network.
Table-V: Training architecture and parameters for sequential learning
V. RESULT AND DISCUSSION
A. Backpropagation Learning
The computed value of backpropagation with the Levenberg–Marquardt and Quasi-Newton algorithms trained and predicted magnitude values are compared with the original recorded value in India for the year 2017.Table VI shows the original and predicted magnitudes. The Table VII shows the success rate of the magnitude prediction by both algorithms.
Table-VI: Original Recorded Magnitude and Predicted Magnitude for 2017
In Class 1 the original recorded value is 2.76. The predicted value of Levenberg - Marquardt and Quasi-Newton algorithms are 2.31 and 2.3.The success rate of the prediction
[image:4.595.315.550.210.385.2]in both ways are 83.7% and 83.3%. In class 2 the original recorded value is 3.53. The predicted value of Levenberg - Marquardt and Quasi-Newton algorithms are 3.28 and 3.13.These both predicted values are less than the original recorded value. The success rate of the prediction in both ways is 90.1% and 88.6%. In class 3 and class 4 is having the less predicted values than the original. In class 5 the original recorded value is 6.3. The predicted values are 6.0 and 5.3.The success rate of the prediction in both ways are 95.2% and 84.1%.
Table-VII: Success rate of Prediction using Levenberg - Marquardt and Quasi-Newton algorithms
The following Fig. 2 shows the prediction comparison chart, proves that the LM algorithm prediction accuracy nearly equal to the original recorded magnitude values.
Fig. 2 Magnitude prediction comparisons
B. Sequential learning
[image:4.595.323.541.435.657.2] [image:4.595.51.292.536.734.2]International Journal of Innovative Technology and Exploring Engineering (IJITEE) ISSN: 2278-3075,Volume-8 Issue-12, October 2019
Table-VIII: Testing loss and accuracy of prediction model
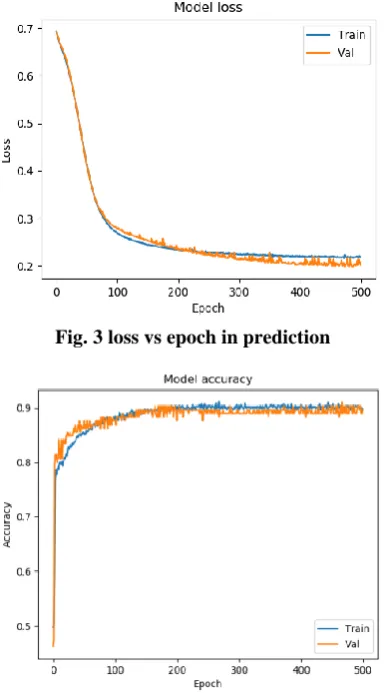
[image:5.595.79.270.69.196.2]The Adagrad optimizer give the most accurate prediction model with maximum testing accuracy and minimum loss compare to the other optimizers with the number of epochs 500, 1000.The Fig. 3 shown the training and validation loss with the Adagrad optimizer for 500 epochs. The epochs increases the loss decreases. The Fig. 4 depicts the training and validation accuracy with the Adagrad optimizer for the 500 epochs. The epochs increases the accuracy increases.
Fig. 3 loss vs epoch in prediction
Fig. 4 Accuracy vs epoch in prediction
The Fig. 3 and 4 shows that, this neural network algorithms model gives high accuracy and low loss value in prediction. So, it is an appropriate model for earthquake prediction. The cartography result given by the developed software tool for the sample data is shown in Fig. 5.In this Figure the blue dot represent the most vulnerable places in India, that will face earthquake in future. Such places are Himachal Pradesh, Andaman and Nicobar, Assam, Manipur, Meghalaya etc.
Fig. 5 Risky seismic zones in India
VI. CONCLUSION
In this work the neural network algorithms are used to find the seismic risky areas of India. The Back propagation neural network has been constructed with the Levenberg-Marquardt and BFGS Quasi Newton algorithms in order to predict the earthquake magnitude in India. The sequential learning neural network is used to find the prediction model for the cartographic risky areas. The selected earthquake parameters are used to train the new proposed neural network model and the results are tabulated. The prediction accuracy of the Levenberg–Marquardt (LM) and BFGS Quasi Newton algorithms are compared. Here the Levenberg–Marquardt (LM) algorithm gives more accurate prediction result than the BFGS Quasi Newton. In sequential learning the loss and accuracy of the model is analyzed and proved that the Adagrad optimizer which produces the high accuracy and low loss value model. Finally seismic risky areas are identified through the cartography result shown by the software tool.
REFERENCES
1. Jacek,M., Zurda, (1999), “Introduction to Artificial Neural
Systems”.West publishing company, USA, pp. 2–3.
2. Simon Haykin,(2009), “Neural Networks and Learning
Machines”.Pearson prentice Hall publication, pp. 2.
3. Mohankumar, K.; Sangeetha, K.(2018), “ A Study on Earthquake
Prediction Using Neural network Algorithms”. International Journal of Computer Sciences and Engineerings”, 6(10), pp. 200-204.
4. Shaganpreet kaur; Chinu (2018),“Comparative Analysis of Data
Mining Techniques”. International journal of Computer Science and Engineering, 6(4), pp. 301-304.
5. Mohankumar, K, Sangeetha,K.(2018), “Performance analysis on
Decision Tree and SVM Classification with reference to flood occurrences in India”. International Journal of Advanced Research in computer Science, 9(2) pp.478-483.
6. Emad Amar, Tawfik Khattab, Fatma Zada,(2014), “Intelligent
Earthquake prediction System Based on Neural network”.World Academy of Science,Engineering and Technology International Journal of Civil and Environmental Engineering, 8(12) , pp.874-878.
7. Narayanakumar, S., Raja, K. (2016), “A BP Artificial Neural Network
Model for Earthquake Magnitude Prediction in Himalayas, India”.Circuits and Systems,Scientific research publishing, 7, pp.3456-3468.
8. Maria Moustra, Marios Avraamides,Chris Christodoulou(2011),
“Artificial neural network for earthquake prediction using time series magnitude data or Seismic Electric Signals”. Expert Systems with application, Elesvier, 38(12), pp.15032-15039.
9. Khawaja M. Asim; Muhammad Awais,F.; Martı´nez–A´lvarez (2017),
[image:5.595.72.266.319.667.2]10. Asencio-Corte, G.; Martı´nez- A´lvarez, F., Troncoso, A., Morales-Esteban, A.(2015), “Medium–large earthquake magnitude prediction in Tokyo with artificial neural networks”.Springer Neural computing and Applications, 28(5), pp.1043-1055.
11. Asim, K.M., Idris, A., Iqbal, T., Martinez Alvarez,F.(2018), “Earthquake prediction model using support vector regressor and hybrid neural networks”. PLOS ONE, 13(7), pp.1-22.
12. Gueniche T., Fournier-Viger P., Raman R., Tseng V.S. (2015) CPT+:
Decreasing the Time/Space Complexity of the Compact Prediction Tree. In: Cao T., Lim EP., Zhou ZH., Ho TB., Cheung D., Motoda H. (eds) Advances in Knowledge Discovery and Data Mining. PAKDD 2015. Lecture Notes in Computer Science, vol 9078. Springer, Cham.
13. David Kriesel(2005), “A Brief Introduction to Neural networks”.
dkriesel.com, pp. 33, 2005.
14. Jaiwei Han, Micheline Kamber (2006), “Data Mining Concepts and
Techniques”.Elsevier Publication, India, pp. 327.
15. Karthick, S. (2017), “Semi supervised hierarchy forest clustering and KNN based metric learning technique for machine learning system”, Journal of Advanced Research in Dynamical and Control Systems 9(1), pp. 2679-2690.
16. Dao, V.N.P., Vemuri, V.R. (2002), “A performance comparison of
different back propagation neural networks methods in computer network intrusion detection”. Differential Equations and Dynamical Systems. 10(1&2) pp 201–214.
17. Bindu Garg, Neha Kirar, Suraj Menon,Tanya Sah (2016), “A
performance comparison of different back propagation neural networks methods for forecasting wheat production”.CSI transaction on ICT,Springer 4(2-4), pp.305-311.
18. Karthick, S. "Semi supervised hierarchy forest clustering and KNN based metric learning technique for machine learning system." Journal of Advanced Research in Dynamical and Control Systems. Vol. 9, No. 1 (2017) 2679-2690.
19. Asim, K. M., Martínez-Álvarez, F., Basit, A., Iqbal, T. (2017), “Earthquake magnitude prediction in Hindukush region using machine learning techniques”. Springer Natural Hazards, 85(1), pp.471-486.
20. Reni Suryanita, Hendra Jingga (2017), “Application of
Backpropagation Neural Networks in Predicting Story Drift of Building”, In the Proceedings of the International MultiConference of Engineers and Computer Scientists (IMECS 2017), Hong Kong, pp.20-23.
21. Ashif Panakkat and Hojjat Adeli, “Neural Network Models For
Earthquake Magnitude Prediction Using Multiple Seismicity Indicators”, International Journal of Neural Systems, Vol. 17, No. 1 (2007) 13–33.
AUTHORS PROFILE
Mrs. K. Sangeetha pursed Master of Computer Application and M.Phil from Bharathidasan University, Thiruchirappailli. Currently She is doing Ph.D as a full time research scholar in PG and Research Department of Computer Science, Rajah Serfoji Government College, Thanjavur, Affiliated to Bharathidasan University, T.N, India. She is having 12 years of teaching experience. Her main research work focuses on Data Analytics, Machine Learning and Deep learning.
Dr. K. Mohan Kumar received Master of Computer
Science, Ph.D in Computer Science from
Bharathidasan University, Tiruchirappalli, India and
M.Phil computer science from Manonmaniyam