White Rose Research Online URL for this paper:
http://eprints.whiterose.ac.uk/127139/
Version: Accepted Version
Article:
Ali, F., Aute, S., Sreedharan, S. et al. (5 more authors) (2018) Tracking HOCl
concentrations across cellular organelles in real time using a super resolution microscopy
probe. Chemical Communications. ISSN 1359-7345
https://doi.org/10.1039/c7cc09433g
[email protected]
https://eprints.whiterose.ac.uk/
Reuse
Items deposited in White Rose Research Online are protected by copyright, with all rights reserved unless
indicated otherwise. They may be downloaded and/or printed for private study, or other acts as permitted by
national copyright laws. The publisher or other rights holders may allow further reproduction and re-use of
the full text version. This is indicated by the licence information on the White Rose Research Online record
for the item.
Takedown
If you consider content in White Rose Research Online to be in breach of UK law, please notify us by
Journal Name
COMMUNICATION
!
Received 00th January 20xx, Accepted 00th January 20xx
DOI: 10.1039/x0xx00000x
www.rsc.org/
Tracking HOCl Concentrations Across Cellular Organelles in Real
time using a Super resolution Microscopy Probe
Firoj Ali,a# Sunil Aute,a# Sreejesh Sreedharan,b# Anila H. A,a Hiwa K Saeed,b Carl G. Smythe,c*
Jim A. Thomasb* and Amitava Dasa,d*c
BODIPY derivative, SF-1, exclusively shows a fluorescence ON response to HOCl and images endogenously generated HOCl in RAW 264.7 macrophages. Widefield and super resolution structured illumination microscopy images confirm localization in the Golgi complex and lysosomes, and hence specifically detects HOCl generated in these organelles. SF-1 is compatible with 3D-SIM imaging of individual cells.
Bio-imaging technologies to probe the molecular basis of life are in demand. In this context, optical microscopy has proven utility and versatility. Luminescent probes for specific biomolecules and cellular structures are particularly attractive as they provide increased contrast over traditional techniques. The ideal characteristics of cell-permeable probes are that they display low toxicity, organelle specificity, and are photostable with a bright emission. However, one of the disadvantages of conventional fluorescence microscopy is spatial resolution. Even for high-resolution methods, such as confocal laser scanning microscopy (CLSM), two close points appear to merge into one at roughly half the wavelength of the imaging light, restricting resolution to features above ~250 nm. More recently super-resolution microscopy, SRM, techniques that break these limitations have been developed.1 A case in point is structured illumination microscopy, SIM.2 Although this form of SRM provides lower resolutions (100 - 120 nm) than STORM and STED - where scaling down to <50 nm has been accomplished - it is a better candidate for live cell imaging as it requires an order of magnitude lower light intensity.2c
Optical microscopy has been used to investigate cellular processes, such as the generation of - and cellular response to - reactive oxygen species, ROS. ROS are involved in a range of m cell signaling and regulation processes and dysfunctions that lead to degenerative diseases and cancers
A panoply of processes involved in homeostasis and cell activation is controlled by regulation of the concentration and location of specific ROS. HOCl is an important ROS, which is naturally produced by the myeloperoxidase-H2O2-Cl¯ system.3a,3b This species is catabolized through oxidation by glutathione and cellular thiols and plays a key role in cell death signaling.3 Thus, detection of HOCl signaling, will plays a key role in understanding the intricacies of these complicated biological mechanisms.
HOCl also plays an important role in the immune response to pathogens,4 as it is generated during phagocytosis.5 Activated phagocytic cells generate HOCl6 as part of the inflammation response. Its overproduction is associated with cardiovascular disease, a neurodegenerative disorder, and inflammatory-related diseases.7 These effects may be due to quite specific cellular mechanisms; for example, it is suggested that HOCl plays a part in the Golgi stress response, a phenomenon linked to a number of neurodegenerative diseases.8 However, the role of the Golgi apparatus in HOCl induced oxidative stress is still unclear due to lack of suitable probes. To fully understand such signaling processes, dedicated HOCl probes that display localization in specific cellular compartments are urgently required.9
The synthesis of SF-1 is outlined in Figure 1A. The details of this method, as well as routine analytical and spectroscopic data is provided in the supporting information. The absorption spectrum of SF-1, recorded in an aqueous PBS buffer-acetonitrile (9:1, v/v) solution, shows an intense absorption band with a maximum at ~ 550 nm (ε = 40000 L mol-1cm-1) and this was assigned to S0-S1 electronic transition.
10
COMMUNICATION Journal Name
2 | J. Name., 2012, 00, 1-3 This journal is © The Royal Society of Chemistry 20xx
Figure 1. (A) Methodologies adopted for synthesis of SF-1; (B) change in emission spectra of SF-1 in the absence and presence of different ROS/NOS species (HOCl, X: H2O2, ¥OH, Na
2S2, HNO, Tyrosinase, Cysteine, NO3¯, NO2¯, Fe 2+
, Fe3+, Cu2+, Cr3+, Hg2+, Zn2+ and K+); (C) emission titration profile for SF-1 in the presence of varying
concentration of HOCl; All emission spectra were recorded using λEx = 550 nm in
aq. PBS buffer-acetonitrile (9:1, v/v) solution.
A facile charge-transfer process and a low HOMO-LUMO energy gap presumably accounts for its poor emission quantum yield.
The luminescence spectral response of probe SF-1 towards a variety of species was tested using 20 mole equivalents of the respective analytes. No observable change in luminescence profile was observed in the presence of all other analyte (e.g., X: H2O2, ¥OH, HNO, Na2S2, NO3¯, NO2¯, Fe2+, Fe3+, Cu2+, Cr3+, Hg2+, Zn2+ and K+) except for HOCl. On treatment with HOCl, a distinctive “turn-on” luminescence enhancement (Figure 1(B)) with a maximum at 586 nm (ΦSF-2586nm = 0.116;
λEx = 550 nm, with Rhodamine B used to evaluate relative emission quantum yield). Even with large excesses of other ROS/RNS and intracellular enzymes like tryosinase, the emission response of SF-1 remains unchanged, illustrating its specificity towards HOCl (ESI†). The lowest detection limit was evaluated using 3σ method to be 4.3 nM in aq. PBS buffer-acetonitrile (9:1, v/v) solution (ESI†). Further studies confirmed that SF-1 was stable across a wide pH range (pH = 4–9) (ESI†). Time-dependent luminescence assays employing 10 µM solutions of the probe in the presence of 2 mM HOCl, reveal that the reaction is completed within 15 min. The HRMS data clearly indicate that reagent SF-1 reacts with HOCl to produce SF-2. The higher emission quantum yield for SF-2 is attributed to an interrupted CT process and enhanced HOMO-LUMO energy gap.11
[image:3.595.343.511.68.237.2]As MTT assays confirmed that both SF-1 and SF-2 are non-toxic towards RAW 264.7 macrophage cells, live cell experiments using wide-field fluorescence microscopy were carried out in which HOCl was added to cells that were previously treated with SF-1. On gradual addition of HOCl, bright wide-field images were observed (ESI). As the probe shows significant emission enhancement in the presence of HOCl and it is chemically robust, we investigated its use in SIM imaging, which requires a bright, highly photostable probe.
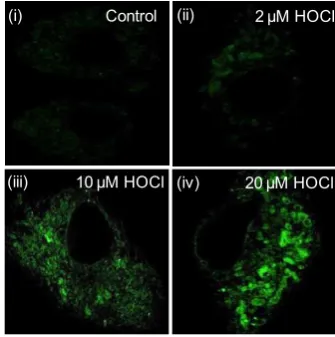
Figure 2. Detection of HOCl by SF-1: (i) SIM images of RAW 264.7 cells incubated with SF-1 (10 μM) as the control: (ii–iv) SIM images of cells incubated with SF-1
(10 μM) for 30 min and then further exposed to different HOCl for 20 min.
To determine the precise localization of SF-1 on interaction with HOCl, experiments were carried out using fixed cells. These experiments confirmed that the probe was compatible with the prolonged irradiation required for SIM, resulting in the images shown in Figure. 2.12,13
After confirming the efficient cellular internalization of the probe and its use in SIM, experiments were performed to map intracellular HOCl, either added externally or endogenously generated by a biochemical process. 3D-SIM images produced during these procedures - processed using Image J - showed a distinctive pattern of localization within the cytosol (see ESI for Images and ESI video 1 of these experiments).
As expected, RAW 264.7 cells treated with only SF-1 (10 µM) showed minimal intracellular fluorescence. However, cells exposed to increasing concentrations of HOCl show a concomitant increase in SF-1 emission. These promising results prompted us to look at imaging endogenously generated HOCl. As RAW cells generate HOCl when they are stimulated by lipopolysaccharide (LPS),14 cells were incubated with LPS (5000 ng/mL) for 12 h in DMEM culture medium with 10% FBS and then further treated with SF-1 (10 µM) for another 30 min. After employing this protocol, SIM images showed bright fluorescence signal from the cells (Figure 3).
Figure 3. Detection of Endogenous HOCl by SF-1: SIM images and emission intensity profiles of SF-1 in the presence of different concentration of LPS incubated for 12h in fixed RAW 264.7 cells.
600 650 700 0
1x10⁶ 2x10⁶
SF-2
SF-1 & SF-1 + X
In
te
n
si
ty
Wavelength (nm) 600 650 700
0 1x10⁶ 2x10⁶
[HOCl] 0.0 2.0 mM
In
te
n
si
ty
Wavelength (nm)
(B) (C)
(A)
Control 2 µM HOCl
10 µM HOCl 20 µM HOCl
(i) (ii)
[image:3.595.48.278.68.205.2] [image:3.595.309.549.560.677.2]Figure 4. 3D-SIM Images of endogenous HOCl formation and attenuated signal spread generated by LPS stimulation (2500 ng) detected by SF-1 (10 μM). (A) & (B): Signal detection on punctated structures, (B), (C) & (D): Signal spread from puncters to diffuse structures, (E): shows more diffuse structures than puncters indicating total signal transfer to diffuse structures from puncters, (F): Signal saturation due to less availability of endogenous HOCl (indication of cell death).
To understand intracellular bio-signaling mechanisms, it would be advantageous to monitor endogenous signaling spreading across multiple cellular compartments, as this would facilitate a deeper understanding of the signaling pathways between different cellular compartments. Therefore, to trace the fate of HOCl, time-dependent LPS experiments were carried out at a fixed concentration of SF-1 (10 μM) and LPS (2500 ng) at time intervals ranging from 2 minutes to 12 h and studied by 3D-SIM (Figure. 4).
Emission was initially generated from punctated structures, it then spread out to diffuse through specific areas of the cytosol; indicating that the HOCl is generated, and interacts with SF-1 in certain regions inside the cells, Figure 4. After 12 hours or more, the emission signal dies out completely. The intense signals observed during the initial LPS treatment indicates that HOCl generation is at a maximum during LPS stimulation and then slowly reduces over a period of hours by attenuation through the cytoplasm.
It was evident that SF-1 does not localize in the nucleus, but is found in specific regions of the cytoplasm. Further details of its exact sub-cellular localization were explored through co-localization experiments
Initial studies involved ER-Tracker as a co-stain. SIM Images from co-staining with SF-1 (Figure 5A), show low colocalization, with a calculated Pearson’s correlation coefficient (PCC) of < 0.05 – see the ESI for scatter correlation diagrams and SI video 2. Contrastingly, colocalization experiments with Cytopainter Golgi Green show a very close
spatial correlation between this probe and SF-1 - Figure 5B. A number of QSAR studies have shown that small molecule localization in specific organelles is highly dependent on the charge and balance of lipophilicity and hydrophilicity of the probe in question.15 These studies indicate that the low charge/intermediate amphiphilicity of probe SF-1 lead to Golgi apparatus uptake.
Figure 5. Colocalization experiments (Cells were pre-treated with LPS, 2500 ng before SF-1 and Tracker incubation): (A) SIM images of SF-1, ER-Green and merged indicating minimum colocalization, (B): Wide Field images of SF-1, Golgi Tracker Green and Merged indicating maximum colocalization, (C): SIM images of SF-1, LysoTracker Deep Red and Merged indicating preferential localization of SF-1 to lysosomes, circles showing lysosomes, (D): Comparative Pearson’s profile, ER experiment showing minimum colocalization were as Golgi and Lyso experiment showing appreciable colocalization indicating that SF-1 localizes preferentially on Golgi apparatus and Lysosomes.
A calculated Pearson’s Coefficient of 0.98 confirmed that SF-1 detects HOCl within Golgi bodies of cells, See Figure 5B & ESI† (Video-3a and scatter graphs).
Attempts to confirm the localization of SF-1 within the Golgi body using super resolution imaging proved to be unsuccessful as, due to photobleaching, CytoPainter Golgi Green was not suitable as a SIM probe (See SI Video-3b). Clearly, in this respect, the extraordinary photostability of SF-1 is superior to this commercial probe and is thus the first SR probe for HOCl in the Golgi apparatus.
To determine the identity of the punctated structures observed during the time-dependent HOCl detection, further colocalization experiments were performed. It was found the emission from SF-1 co-localised with LysoTracker Deep Red, as confirmed from the generated Pearson’s Coefficient values and 3D-SIM images as shown in Figure. 5C, confirming that the punctated structures, and initial source of HOCl, is the lysosome (See SI Video-4). Interestingly treatment with SF-2,
PCC: 0.78
Lyso PCC: 0.98
Golgi PCC= 0.0446
SIM SIM
SIM
SF-1 ER-Tracker Green Merge
ER (A)
SF 1 Golgi Tracker Green
WF WF WF
Merge (B)
WF SIM
SF-1
SIM
Lyso Tracker Deep Red Merged
SIM (C)
[image:4.595.67.268.64.348.2] [image:4.595.306.545.150.434.2]COMMUNICATION Journal Name
4 | J. Name., 2012, 00, 1-3 This journal is © The Royal Society of Chemistry 20xx
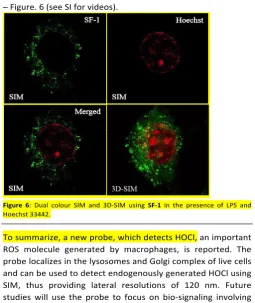
[image:5.595.40.296.211.515.2]freshly generated outside cells, showed an almost identical distrubution, See SI, indicating that HOCl is imaged within this organelle due to th probe’s localisation. To understand complex biological processes, it is often necessary to employ more than one probe so that information on simultaneous biological processes can be obtained.16 Therefore the use of probe SF-1 in two colour SIM experiments was investigated. For this technique, a organelle probe with different spectral characteristics is required. In this initial study, we used the nuclear stain Hoechst 33442 to yield dual colour SIM images. The high photostability of both probes meant that they could be used to construct striking 3D-SIM images of individual cells – Figure. 6 (see SI for videos).
Figure 6: Dual colour SIM and 3D-SIM using SF-1 in the presence of LPSand Hoechst 33442.
To summarize, a new probe, which detects HOCl, an important ROS molecule generated by macrophages, is reported. The probe localizes in the lysosomes and Golgi complex of live cells and can be used to detect endogenously generated HOCl using SIM, thus providing lateral resolutions of 120 nm. Future studies will use the probe to focus on bio-signaling involving HOCl.
Conflicts of interest
There are no conflicts to declare.
Notes and references
A.D. acknowledges SERB (India) Grants (SB/S1/IC-23/2013 & JCB/2017/000004) for funding. FA, SA and AHA acknowledge CSIR & UGC for their research fellowships. SS and JAT are grateful to the Imaging Life initiative of the University of Sheffield for the studentship to SS and access to the Wolfson Light Microscopy Facility funded by the MRC grant MR/K015753/1. HKS acknowledges KRG scholarship. FA, AD, and JAT are grateful to the GCRF for funding a visit by FA to Sheffield. Finally, we are grateful to the referees, whose constructive comments have greatly improved the quality of this report.
1 (a) M. Baker, Nature, 2011, 478, 137; (b) L. Schermelleh, R. Heintzmann and H. Leonhardt, J. Cell Biol., 2010, 190, 165; (c) C. Eggeling, K. I. Willig, S. J. Sahl and S. W. Hell, Q. Rev. Biophys., 2015, 482, 178.
2 2. (a) L. Shao, P. Kner, E. H. Rego and M. G L. Gustafsson, Nature Methods, 2011, 8, 1044; (b) M. Gustafsson, Proc. Natl. Acad. Sci. U.S.A, 2005, 102, 13081; (c) D. Li, L. Shao, B. C. Chen, X. Zhang, M. Zhang, B. Moses, et al. Science, 2015, 349, aab3500.
3 3. (a) W. M. Nauseef, Cellular Microbiol., 2014, 16, 1146; J. P. Gaut, G. C. Yeh, H. D. Tran, J. Byun, J. P. Henderson, G. M. Richter, M.-L. Brennan, A. J. Lusis, A. Belaaouaj, R. S. Hotchkiss, J. W. Heinecke, Proc. Natl. Acad. Sci. 2001, 98, 11961; (c) J. M. Pullar, M. C. M. Vissers and C. C.
Winterbourn, IUBMB Life, 2000, 50, 259.
4 4. S. Kenmoku, Y. Urano, H. Kojima and T. Nagano, J. Am. Chem. Soc., 2007, 129, 7313.
5 5. C. C. Winterbourn, M. B. Hampton, J. H. Livesey and A. J. Kettle, J. Biol. Chem., 2006, 281, 39860.
6 6. Y-ting T. Yang, M. Whiteman and Steven P. Gieseg, Biochim. Biophys. Acta, 2012, 1823, 420.
7 7. (a) Y. W. Yap, M. Whiteman and N. S. Cheung, Cell Signal, 2007, 19, 219; (b) Q. Xu, K.-A. Lee, S. Lee, K. M. Lee, W.-J. Lee and J. Yoon, J. Am. Chem. Soc., 2013, 135, 9944.
8 8. Z. Jiang, Z. Hu, L. Zeng, W. Lu, H. Zhang, T. Li and H. Xiao, Free Radic Biol Med., 2011, 50, 907.
9 9. (a) H. Zhu, J. Fan, J. Wang, H. Muand and X. Peng, J. Am. Chem. Soc., 2014, 136, 12820; (b) L. Yuan, L. Wang, B. K. Agrawalla, S.-J. Park, H. Zhu, B. Sivaraman, J. Peng, Q.-H. Xu and Y.-T. Chang, J. Am. Chem. Soc., 2015, 137, 5930; (c) P. Panizzi, M. Nahrendorf, M. Wildgruber, P. Waterman, J.-L. Figueiredo, E. Aikawa, J. McCarthy, R. Weissleder and S. A. Hilderbrand, J. Am. Chem. Soc., 2009, 131, 15739; (d) M. Ren, B. Deng, K. Zhou, X. Kong, J.-Y. Wang, G. Xu and W. Lin, J. Mater. Chem. B, 2016, 4, 4739; (e) H. S. Jung, J. Han, A.-H. Lee, J. H. Lee, J.-M. Choi, H.-S. Kweon, J. H. Han, J.-H. Kim, K. M. Byun, J. H. Jung, C. Kang and J. S. Kim, J. Am. Chem. Soc., 2015, 137, 3017; (f) X. Chen, K. –A. Lee, X. Ren, J.-C. Ryu, G. Kim, J.-H. Ryu, W.-J. Lee and J. Yoon, Nat. Protoc., 2016, 11, 1219; (g) J. Zhou, L. Li, W. Shi, X. Gao, X. Li and H. Ma, Chem. Sci., 2015, 6, 4884; (h) X. Chen, F. Wang, J. Y. Hyun, T. Wei, J. Qiang, X. Ren, I. Shin and J. Yoon, Chem. Soc. Rev., 2016, 45, 2976; (i) H. Chen, H. Shang, Y. Liu, R. Guo and W. Lin, Adv. Funct. Mater., 2016, 26, 8128.
10 . F. Ali, A. H. A., N. Taye, R. G. Gonnade, S. Chattopadhyay and A. Das, Chem. Commun., 2015, 51, 16932.
11 (a) Y. Jiang, G. Zheng, N. Cai, H. Zhang, Y.Tan, M. Huang, Y. He, J. He and H. Sun, Chem. Commun., 2017, 53, 12349; (b) J. Kim and Y. Kim, Analyst, 2014, 139, 2986; (c) W. Zhang, C. Guo, L. Liu, J. Qin and C. Yang, Org. Biomol. Chem., 2011, 9, 5560.
12 Handbook of Biological Confocal Microscopy, third edition, edited by James B. Pawley, Springer Science and Business Media, New York, 2006, pp-453.
13 M. G. Gustafsson, J. Microsc., 2000, 198, 82.
14 Y. Adachi, A. L. Kindzelskii, A. R. Petty, J. B. Huang, N. Maeda, S. Yotsumoto, Y. Aratani, N. Ohno and H. R. Petty, J.
Immunol., 2006, 176, 5033.
15 R W Horobin, F Rashid-Doubell, J. D. Pediani, G. Milligan, Biotech. Histochem., 2013, 88, 440.