Version: Published Version
Monograph:
Mazzone, P. orcid.org/0000-0003-0944-8031, Carlton, J. orcid.org/0000-0002-9373-7663 and Griffiths, H. orcid.org/0000-0003-4286-5371 (2019) Summary vision screening data : Finland. Report. Vision Screening Country Reports . EUScreen
© 2019 EUScreen. For reuse permissions, please contact the publisher.
[email protected] https://eprints.whiterose.ac.uk/ Reuse
Items deposited in White Rose Research Online are protected by copyright, with all rights reserved unless indicated otherwise. They may be downloaded and/or printed for private study, or other acts as permitted by national copyright laws. The publisher or other rights holders may allow further reproduction and re-use of the full text version. This is indicated by the licence information on the White Rose Research Online record for the item.
Takedown
If you consider content in White Rose Research Online to be in breach of UK law, please notify us by
Summary Vision Screening Data: Finland
Produced as part of Work Package 3
Paolo Mazzone1, Dr Jill Carlton2, Dr Helen Griffiths3
1. Research Assistant, School of Health and Related Research, University of Sheffield, United Kingdom (UK)
2. Senior Research Fellow, School of Health and Related Research, University of Sheffield, United Kingdom (UK)
3. Senior Lecturer, Academic Unit of Ophthalmology and Orthoptics, University of Sheffield, United Kingdom
(UK)
Information provided by Dr Hanna-Mari Jauhonen (Finnish Medicines Agency)
23rd January 2019
Disclaimer: This is a summary report representing the responses from a country representative working within eye care services of the country reported. This report does not represent conclusions made by the authors, and is the product of professional research conducted for the EUSCREEN study. It is not meant to represent the position or opinions of the EUSCREEN study or its Partners. The information cannot be fully verified by the
authors and represent only the information supplied by the country representatives.
T E U H
ii
Contents
1 Glossary of Terms: Vision Screening iii
2 Abbreviations vi
3 Population and Healthcare Overview 1
4 Vision Screening Commissioning and Guidance 3
5 Screening programme 4
5.1 Vision screening - Preterm babies 4
5.2 Vision screening - Birth to 3 months 4
5.3 Vision screening - 3 months to 36 months 4
5.4 Vision screening - 36 months to 7 years 4
6 Automated Screening 9
7 Provision for Visually Impaired 10
8 Knowledge of existing screening programme 11
8.1 Prevalence/Diagnosis 11
8.2 Coverage 11
8.3 Treatment success 11
8.4 Screening evaluation 11
9 Costs of vision screening in children 12
9.1 Cost of vision screening 12
9.2 Cost of treatment for amblyopia 12
9.3 Cost of Treatment for strabismus 12
9.4 Cost of treatment for cataract 12
iii
1 Glossary of Terms: Vision Screening
Abnormal test result A
detected under good conditions. The result on screening
equipment may indi
Attendance rate The proportion of all those invited for screening that are tested and receive a result:
Invited for screening includes all those that are offered the screening test.
Tested and receive a result coul
Attendance rate provides information on the willingness of families to participate in screening.
Compliance with referral (percentage)
The percentage of those who are referred from screening to a diagnostic assessment that actually attend the diagnostic assessment.
Percentage of compliance provides information on the
willingness of families to attend the diagnostic assessment after referral from screening.
Coverage The proportion of those eligible for screening that are tested and receive a result:
Eligible for screening includes those within the population that are covered under the screening or health care programme.
T
Factors such as being offered screening, willingness to
participate, missed screening, ability to complete the screen, and ability to document the screening results will influence the coverage.
False negatives The percentage of children with a visual deficit (defined by the
iv
child passes the screening, the percentage of false negatives is 1%.
False positives The percentage of children with normal vision that are referred from screening to a diagnostic assessment.
Guidelines Recommendations or instructions provided by an authoritative body on the practice of screening in the country or region.
Vision screening professional
A person qualified to perform vision screening, according to the practice in the country or region.
Inconclusive test result
A
detected due to poor test conditions or poor cooperation of the child.
Invited for screening Infants/children and their families who are offered screening.
Outcome of vision screening
An indication of the effectiveness or performance of screening, such as a measurement of coverage rate, referral rate, number of children detected, etc.
Untreated amblyopia Those children who have not received treatment for amblyopia due to missed screening or missed follow-up appointment.
Persistent amblyopia Amblyopia that is missed by screening, or present after the child has received treatment.
Positive predictive value
The percentage of children referred from screening who have a confirmed vision loss.
For example, if 100 babies are referred from screening for diagnostic assessment and 10 have normal vision and 90 have a confirmed visual defect, the positive predictive value would be 90%.
Prevalence The percentage or number of individuals with a specific disease or condition. Prevalence can either be expressed as a percentage or as a number out of 1000 individuals within the same
demographic.
Programme An organised system for screening, which could be based nationally, regionally or locally.
Protocol Documented procedure or sequence for screening, which could include which tests are performed, when tests are performed, procedures for passing and referring, and so forth.
v
Referral criteria A pre-determined cut-off boundary for when a child should be re-tested or seen for a diagnostic assessment.
Risk babies / Babies at-risk
All infants that are considered to be at-risk or have risk-factors for vision defects/ophthalmic pathology according to the screening programme.
Two common risk factors are admission to the neonatal-intensive care unit (NICU) or born prematurely. However, other risk factors for visual defects may also be indicated in the screening
programme.
Sensitivity The percentage of children with visual defects that are identified via the screening programme.
For example, if 100 babies with visual defects are tested, and 98 of these babies are referred for diagnostic assessment and 2 pass the screening, the sensitivity is 98%.
Specificity The percentage of children with normal vision that pass the screening.
For example, if 100 babies with normal vision are tested, and 10 of these babies are referred for diagnostic assessment and 90 pass the screening, the specificity is 90%.
Target condition The visual defect you are aiming to detect via the screening programme.
vi
2 Abbreviations
ACT Alternating Cover Test
AR Autorefraction
AS Automated Screening
CT Cover Test
CV Colour Vision
EI Eye Inspection
EM Eye Motility
Fix Fixation
GDP Gross Domestic Product
GP General Practitioner
Hir Hirschberg
NICU Neonatal-intensive care unit
PM Pursuit Movements
PPP Purchasing Power Parity
PR Pupillary Reflexes
RE Retinal Examination
ROP Retinopathy of Prematurity
RR Red Reflex Testing
SV Stereopsis
VA Visual Acuity
1
3 Population and Healthcare Overview
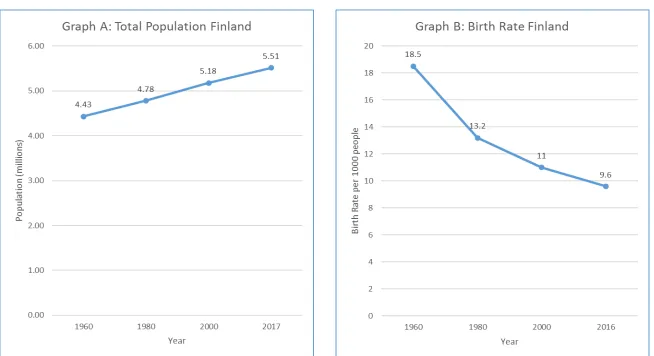
The population of Finland is 5,511,303 (World Bank, 2018a) and a birth rate estimated at 9.6 births/1,000 population in 2016 (World Bank, 2018b). The change in population and birth rate from 1960 to 2017 is shown in Figure 1, graphs A and B respectively.
Finland had a reported population density of 18.1 people per square kilometre in 2017 and this has risen from 14.7 people per square kilometre in 1961 (World Bank, 2018c). In terms of healthcare facilities, the total density of hospitals in 2013 was 1.38 per 100,000 population (WHO, 2016a). Infant mortality in 2017 is estimated at 1.9 deaths/1,000 live births in total (World Bank, 2018d).
2 Figure 1: Total Population and Birth Rate in Finland
3
4 Vision Screening Commissioning and Guidance
In Finland, there are national guidelines for conducting vision screening, however, it is organised regionally with differences between protocols. Vision screening is embedded into a general preventative child healthcare screening system and funded by each municipality. The National Institute of Health and Welfare develops and recommends the content of vision screening programme. Any revisions to the programme would be made by the National Institute of Health and Welfare in collaboration with a network of specialists, and funded by the government. It is not known when the programme started, or if there have been any changes since its implementation.
There are no methods for quality monitoring imposed by the government and no research of concerning the vision screening programme.
4
5 Screening programme
The target conditions screened for by vision screening are retinopathy of prematurity (ROP) and amblyopia. The health care professionals delivering vision screening, venue for screening and tests used, vary depending on the age of the child. Specific details of the screening offered within each age group are described more fully in sections 5.1 to 5.4 below.
5.1 Vision screening - Preterm babies
Preterm babies, if born under 32 weeks, are screened by an ophthalmologist at a hospital. The tests conducted at this age include eye inspection and retinal examination.
5.2 Vision screening - Birth to 3 months
Well, healthy babies up to the age of 3 months are screened by a paediatrician before discharge, and then by a youth doctor or GP in a child welfare clinic. The tests conducted at this age include eye inspection, red reflex testing, pursuit movements and pupillary reflexes and presence or absence of eye contact. These tests are all conducted at birth. It is not known how many abnormal or inconclusive test results necessitate referral for further diagnostic examination. Criteria that necessitate referral include presence of abnormal eye structures, dark red reflex, or no eye contact.
5.3 Vision screening - 3 months to 36 months
Children aged 3 to 36 months are screened twelve times by a specialist nurse and four times by a GP in a child welfare clinic. The tests conducted at this age include eye inspection, fixation, red reflex testing, eye motility, cover test, Hirschberg test and pursuit movements. These tests are conducted at 4, 8 and 18 months. Criteria that necessitate referral include presence of abnormal eye structures, dark red reflex, or no eye contact. Infants are referred for further diagnostic examination after one abnormal or two inconclusive test results.
5.4 Vision screening - 36 months to 7 years
Children aged 36 months up to 7 years of age are screened by a specialist nurse or a GP in a child welfare clinic. This is part of routine visual screening conducted as a part of child welfare clinic visit. The tests conducted at this age include eye inspection, fixation, red reflex testing, eye motility, Hirschberg test, pursuit movement, pupillary reflexes, cover test, alternating cover test and visual acuity measurement. The age of screening and tests at each age are as follows:
5
pursuit movements, pupillary reflexes, near visual acuity measurement.
4 years: near and distance visual acuity, Hirschberg test, cover test, alternating cover test. This is repeated at the age of 5 years and 6 years.
7 years: near and distance visual acuity. This is repeated at 11 years and 14 years of age.
The optotype charts used for children aged 3 to 6 years include linear Lea Symbols based on the Snellen format (Snellen 6/126 to 6/3, logMAR 1.3 to -0.3, decimal 0.05 to 2.0) and a Snellen number chart at age 7 years and older. Children are referred for further diagnostic examination after one abnormal or two inconclusive test results
The referral criteria are as follows:
3 to 4 years: strabismus, visual acuity under 0.5 decimal (6/12 Snellen, 0.3 logMAR) or 2 lines difference in visual acuity, absent red reflex, abnormal head posture.
5 to 6 years: strabismus, visual acuity under 0.63 decimal (6/9.5 Snellen, 0.2 logMAR) or 2 lines difference in visual acuity, absent red reflex, abnormal head posture.
6
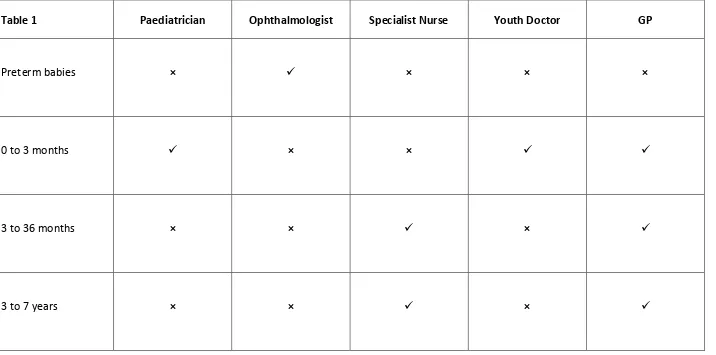
[image:13.842.71.787.137.492.2]Table 1: Healthcare professionals who conduct vision screening in each age group
Table 1 Paediatrician Ophthalmologist Specialist Nurse Youth Doctor GP
Preterm babies × × × ×
0 to 3 months × ×
3 to 36 months × × ×
7
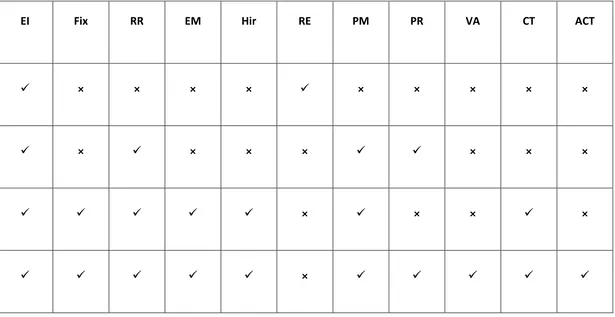
Table 2: Vision screening tests used in vision screening for each age group
Table 2
EI Fix RR EM Hir RE PM PR VA CT ACT
Preterm babies × × × × × × × × ×
0 to 3 months × × × × × × ×
3 to 36 months × × × ×
3 to 7 years ×
[image:14.842.163.778.134.451.2]8
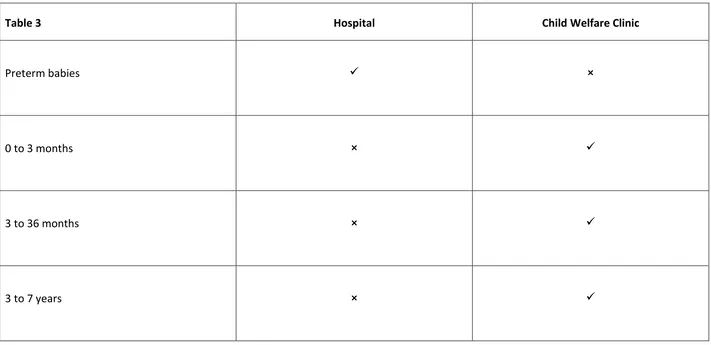
[image:15.842.254.778.132.474.2]Table 3: Location of vision screening for each age group
Table 3 Hospital Child Welfare Clinic
Preterm babies ×
0 to 3 months ×
3 to 36 months ×
9
6 Automated Screening
10
7 Provision for Visually Impaired
All children with visual impairments and their families have the right to get appropriate rehabilitation. There is one specialised school for blind and visually impaired children, this is owned and run by the government. It delivers teaching consultation, supportive materials and methods to the whole country. There is also boarding school, the number of pupils that attend this is not known. The costs per child for these schools is not known.
11
8 Knowledge of existing screening programme
The following data is provided by the National Institute of Health and Welfare Registries. The figures provided constitute the average number of patients treated in specialised care per year (between 2010 and 2017) who are under 18 years of age and another population under 12 years old.
8.1 Prevalence/Diagnosis
The prevalence of amblyopia and types of amblyopia in Finland is unknown. It is estimated that the prevalence of anophthalmia is 1.9/10,000 people, congenital cataract is 2.7/10,000 people and congenital glaucoma is 0.6/10,000 people.
8.2 Coverage
Routine visual screening is conducted as part of the child welfare clinic visit. All children are invited for these visits and they are free of charge. Prior to this, the parents can make an appointment if they have any parental concerns about their chi
8.3 Treatment success
Estimated figures concerning the number of patients treated for congenital cataract, strabismus and amblyopia per year are:
Figures from Population under 18-years old (average per year from 8 years of data 2010-2017):
o Congenital cataract 627
o Strabismus 12,722
o Amblyopia 4,978
Figures from Population under 12-years old (average per year from 8 years of data 2010-2017)
o Congenital cataract 578
o Strabismus 11,726
o Amblyopia 4,848
No further data available.
8.4 Screening evaluation
There is no data available concerning attendance, false negative referrals, false positive
12
9 Costs of vision screening in children
9.1 Cost of vision screening
Routine visual screening is conducted as a part of child welfare clinic visit. Reference costs of the service provider from year 2011 is 50 Euros per visit to a specialized nurse, 104 Euros for a GP. Routine visual screening is conducted as a part of child welfare clinic visit, which is free of charge for the child and family (Kapiainen, Väisänen & Haula, 2014).
9.2 Cost of treatment for amblyopia
The estimated costs for treatment of typical patients, with refractive amblyopia and strabismic amblyopia including follow up:
Per visit to an ophthalmologist (3 to 10 visits needed) - 212 Euros per visit = 636 Euros 2,120 Euros total (Kapiainen, Väisänen & Haula, 2014).
User charges applies for visit to specialized health care, maximum of 41.20 Euros per visit (Kapiainen, Väisänen & Haula, 2014).
Patching: not known
Glasses 70 to 100 Euros per year for 2 to 5 years
9.3 Cost of Treatment for strabismus
Conservative treatment costs are the same as treatment for amblyopia. Reference cost for strabismus surgery 2,215.70 Euros ((Kapiainen, Väisänen & Haula, 2014).
9.4 Cost of treatment for cataract
13
10 References
Kapiainen, S., Väisänen, A., & Haula, T. (2014). Unit costs for health and social care in Finland in 2011. Retrieved from http://www.julkari.fi/handle/10024/114683
The World Bank (2018a). Population, total | Data. [online] Available at: https://data.worldbank.org/indicator/SP.POP.TOTL?locations=FI [Accessed 05 December 2018].
The World Bank. (2018b). Birth rate, crude (per 1,000 people) | Data. [online] Available at: https://data.worldbank.org/indicator/SP.DYN.CBRT.IN?locations=FI [Accessed 05 December 2018].
The World Bank. (2018c). Population density (people per sq. km of land area) | Data. [online] Available at: https://data.worldbank.org/indicator/EN.POP.DNST?locations=FI [Accessed 05 December 2018].
The World Bank. (2018d). Mortality rate, infant (per 1,000 live births) | Data. [online] Available at: https://data.worldbank.org/indicator/SP.DYN.IMRT.IN?locations=FI [Accessed 05 December 2018].
The World Bank. (2018e). Life expectancy at birth, total (years) | Data. [online] Available at: https://data.worldbank.org/indicator/SP.DYN.LE00.IN?locations=FI [Accessed 05 December 2018].
The World Bank. (2018f). Death rate, crude (per 1,000 people) | Data. [online] Available at: https://data.worldbank.org/indicator/SP.DYN.CDRT.IN?locations=FI [Accessed 05 December 2018].
World Health Organisation (WHO). (2016a). Health Infrastructure - Data by country. [ONLINE] Available at: http://apps.who.int/gho/data/view.main.30000. [Accessed 05 December 2018].