This is a repository copy of
Visualising shear stress distribution inside flow geometries
containing pharmaceutical powder excipients using photo stress analysis tomography and
DEM simulations
.
White Rose Research Online URL for this paper:
http://eprints.whiterose.ac.uk/80467/
Proceedings Paper:
Albaraki, S, Antony, SJ and Arowosola, CB (2013) Visualising shear stress distribution
inside flow geometries containing pharmaceutical powder excipients using photo stress
analysis tomography and DEM simulations. In: Powders and Grains 2013: Proceedings of
the 7th International Conference on Micromechanics of Granular Media. Powders and
Grains 2013, 8-12 July 2013, Sydney, Australia. American Institute of Physics (AIP) , 706 -
709. ISBN 9780735411661
https://doi.org/10.1063/1.4812029
[email protected] https://eprints.whiterose.ac.uk/
Reuse
Unless indicated otherwise, fulltext items are protected by copyright with all rights reserved. The copyright exception in section 29 of the Copyright, Designs and Patents Act 1988 allows the making of a single copy solely for the purpose of non-commercial research or private study within the limits of fair dealing. The publisher or other rights-holder may allow further reproduction and re-use of this version - refer to the White Rose Research Online record for this item. Where records identify the publisher as the copyright holder, users can verify any specific terms of use on the publisher’s website.
Takedown
If you consider content in White Rose Research Online to be in breach of UK law, please notify us by
Visualising Shear Stress Distribution inside Flow
Geometries Containing Pharmaceutical Powder
Excipients Using Photo Stress Analysis Tomography and
DEM Simulations
Saeed Albaraki, S. Joseph. Antony*, C. Babatunde Arowosola
Institute of Particle Science and Engineering, School of Process, Environmental and Materials Engineering, University of Leeds, Leeds LS2 9JT, UK.
*Corresponding author: [email protected]
Abstract. For the first time, photo stress analysis tomography (PSAT) is applied to probe the distribution of maximum shear
stress and direction of major principal stress field within ‘powder’ assemblies inside hopper geometries, and further supported by discrete element model (DEM) simulations. The results show that for decrease in hopper angle, the direction of major principle stress aligns with the direction of gravity which could promote flow rate under dynamic conditions. Conversely, the propensity of developing relatively more non-homogeneous distribution of shear resistance zones inside powder assemblies increases with the hopper angle, which could subsequently decrease their macroscopic flow rate.
Keywords
:
Photonic stress analysis tomography (PSAT), discrete element modelling (DEM), granular flow, particulate processes.PACS: 45.70.Cc, 45.70.Mg, 07.10.Lw
INTRODUCTION
Processing behaviours of materials in granular and powder form are well sought in several industrial applications though complex and not yet well established [1,2]. Their mechanical behaviour is different from other conventional state of materials viz., solids, liquids and gases [1-3]. For particulate materials subjected to external boundary loading, stresses propagation occurs through inter-particle contacts usually in a non-homogeneous manner. It has been shown that bulk shear strength of particulate materials originate from contributions of a small proportion of force-transmitting contacts referred to as strong force chains and their fabric features are influenced by single-particle scale properties and packing conditions [2]. Although previous studies based on photo stress analysis method showed non-homogenous characteristics of force-transmitting contacts inside particulate assemblies under external loading, such studies are performed with relatively bigger size of birefringent particles (in mm size range) and not yet widely known for powder assemblies with micron size distributions [4,5]. Recent developments of experimental techniques to analyse structure of particulates such as the X-ray Micro Tomography [6] and Nuclear Magnetic Resonance Imaging [7] are limited in providing density and velocity variations of granular particles. However, visualising shear stress
distribution inside powder packing is not yet well established. In this paper, we report early results on shear stress field inside two dimensional powder assemblies of initial (static) random filling using experimental photo stress analysis tomography (PSAT). To enable this, we developed birefringent powders (with different cohesivity) of micron size distribution and characterised their particle-scale properties. Further, PSAT results for maximum shear stress distribution in powder assemblies are compared with DEM simulations as much as possible.
PSAT METHOD AND MATERIALS
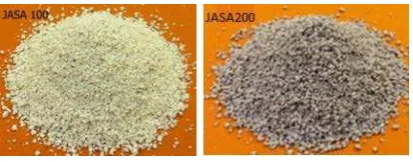
pharmaceutical excipient. These birefringent powders with different level of cohesivity are identified as JASA100 and JASA200 respectively as shown in Fig. 1
FIGURE 1. Birefringent powder samplers: JASA100
and JASA200
EXPERIMENTAL SETUP
[image:3.595.72.279.133.214.2]The PSAT experimental rig consists of a linear
polariser, two quarter wave plates, an analyser, light source and the birefringent sensor powder hopper (angle of hopper =θ) is held as shown in Fig. 2. The powder bed height (H) was kept constant for different hopper angles which are similar to that used in DEM simulations reported later (Fig. 6). More details, on the experimental set up can be found elsewhere [4].FIGURE 2. PSAT experimental setup
Different cases of hopper angle are considered in this study. All the hopper geometries were filled with birefringent powders using identical filling procedure in random packing. The light source emitted ordinary light and converted to a linear polarised light by the effect of the first polariser after which it changed to a circularly polarised light by passing through the quarter wave plate. When the circular polarised light passed though the fabricated birefringent sensors (JASA100 and JASA200), it is split into two components known as ordinary and extra-ordinary components. The retardation in the speed of light among these axes is subsequently measured and related to maximum shear stress at any point of interest inside hopper geometry. The thickness of the hopper geometry is 4mm and we have ensured that the thickness effects are minimised without compromising on the accuracy of the measurements.
RESULTS AND DISCUSSION
Physio-Mechanical Characteristics of
Birefringent Sensors Particles.
The physio-mechanical
properties of the fabricated birefringent sensors powders were evaluated including angle of repose, bulk density, tapped density, Carr’s index and Hausner ratio. The angle of repose, Carr’s index and Hausner ratio were 38o, 16.4 and 1.19 for (JASA100) comparing to 34o, 14.5 and 1.7 respectively for (JASA200). The results suggest that JASA100 is relatively more cohesive than JASA200 type birefringent powders.X-ray diffraction analysis of both sensors powders was performed and the results though not presented here, showed that JASA200 type powder was more crystalline than JASA100, which also lead to better display of birefringence.
Distribution of Maximum Shear Stress
and Direction of Major Principal Stress
The magnitude of the maximum shear stress (colour coded in relation to its magnitude) and the direction of major principal stress were evaluated within the whole hopper at different segments for both JASA100 and JASA200 though the results are presented here for JASA100 in Figure 3. However all the basic characteristics of the results of JASA200 were similar to that of JASA100.
[image:3.595.75.281.417.487.2]6d
FIGURE 3. Maximum shear stress distribution and
major stress principal direction inside hoppers of different opening angle
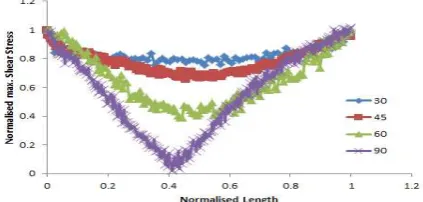
The result shown in Fig. 4 and 5 are for height H/2 and the results are normalised in relation to corresponding maximum shear stress at wall boundary.
FIGURE 4. Normalised magnitude of maximum shear
stress distribution across the width of JASA100 bed at H/2 inside different hopper geometries
These results indicate that, the maximum shear
stress distribution is relatively more uniform across the width of the hopper for decrease in internal angle of the hopper and non-homogeneous for higher values of hopper angle.FIGURE 5. Normalised magnitude of maximum shear
stress distribution across the width of JASA200 bed at H/2 inside different hopper geometries
DEM Results
Inter-particle interactions between grains of the above mentioned particle assemblies are modelled by DEM methods [2, 8]. The contact model used is the linear contact model and it is defined by the normal and shear stiffness (force/displacement) of the two contacting entities (particle-to-particle or particle-to-wall). This method has been widely adopted in DEM simulations of granular materials. Maximum shear test within conical hoppers is carried out using PFC3D for granular materials of identical properties used in PSAT analysis as shown below for different hopper angles.
[image:4.595.72.285.72.261.2]FIGURE 6. Cross section of the hopper (schematic) and
the confinement of particles
Where d = 0.005m which is the hopper width and the major properties used are given in table 1.
Table 1. Properties of particles used in DEM simulations Quantity Value Quantity Value
Gravity m/s2
9.8 Particle average radius (µm)
650
Density kg/m3
708 Particle radius ratio
3.3
Initial porosity
0.16 Friction coefficient
0.3
Particle minimum radius(µm)
300 Stiffness (N/m) 1e7
The samples are created randomly and
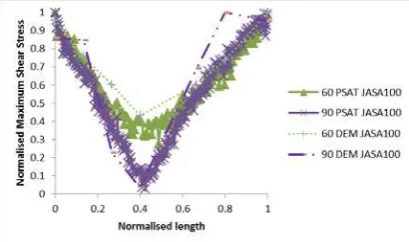
consistently in all the runs. The particles were allowed to reach equilibrium after which the maximum shear stress is tracked along different scanning points at a selected height (H/2) within the hopper and presented in Fig. 6.The DEM-based results are compared with experimental results obtained from PSAT technology for hopper angles 60o and 90o. The simulation results show that stress is higher along the walls of the hopper and tend to decrease
13.6d
d
[image:4.595.316.516.248.378.2] [image:4.595.76.281.369.471.2] [image:4.595.312.530.463.584.2] [image:4.595.74.286.608.709.2]towards the middle of the hopper for different angle of opening. Higher shear stress field was experienced at lower internal angle of the hopper across the width of the hopper. This trend of shear stress across the powder bed obtained from DEM is similar to what was obtained using PSAT as shown in Fig. 7.
FIGURE 7. Maximum shear stress distribution for
granular bed using DEM simulation and PSAT (hopper angles = 60o and 90o)
The current results help to understand the nature of shear stress field in static packing of powders inside hopper geometries. Further studies are required to evaluate the dynamic characteristics of powders through hoppers and their dependence on the initial shear resistance zones inside powder packing.
CONCLUSION
For the first time, PSAT is applied to probe the local distribution of maximum shear stress field within actual powder assemblies inside different hopper geometries. The obtained PSAT and DEM results indicate that the magnitude of maximum shear stress distribution across the width of the hopper tends to be more uniform, as well as the direction of the major principal stress acts along the direction of gravity for decrease in internal angle of the hopper. This indicates that hoppers with small opening angles could be the preferred candidate for designing devices with uniform powder flow.
ACKNOWLEDGMENT
We thank Prof. T Amanbaev, Southern Kazakh State University for his valuable comments and support to this work.
REFERENCES
1. J. Duran, Sands, Powders and Grains.. Springer, 2000, pp. 119 -151.
2. S. J. Antony, Philosophical Transactions of the
Royal Society Series:A, 365 (1861), 2879-2891
(2007).
3. H. M. Jaeger, S. R. Nagel and R.P. Behringer,
Reviews of Modern Physics,. 68 (4), 1259-1273
(1996).
4. S. J. Antony and D. Chapman, Kona Powder and
Particle Journal, 28, 180-188 (2010).
5. T. S. Majmudar and R. P. Behringer, Nature,. 435 (7045), 1079-1082 (2005).
6. X. W. Fu, M. Dutt, A. C. Bentham, B. C. Hancock, R. E. Cameron and J. A. Elliott, Powder Technology,
167(3) 134-140 (2006).
7. C. Huan, X. Y. Yang, D. Candela, R. W. Mair and R. L. Walsworth, Physical Review E, 69 (4), (2004). 8. P. A. Cundall and O. D. L. Strack, Geotechnique, 30
[image:5.595.73.278.177.298.2]