City, University of London Institutional Repository
Citation
:
Habjan, A., Andriopoulos, C. and Gotsi, M. (2014). The role of GPS-enabled information in transforming operational decision making: an exploratory study. European Journal of Information Systems, 23(4), pp. 481-502. doi: 10.1057/ejis.2014.2This is the accepted version of the paper.
This version of the publication may differ from the final published
version.
Permanent repository link:
http://openaccess.city.ac.uk/id/eprint/15617/Link to published version
:
http://dx.doi.org/10.1057/ejis.2014.2Copyright and reuse:
City Research Online aims to make research
outputs of City, University of London available to a wider audience.
Copyright and Moral Rights remain with the author(s) and/or copyright
holders. URLs from City Research Online may be freely distributed and
linked to.
City Research Online: http://openaccess.city.ac.uk/ [email protected]
The role of GPS-enabled information in transforming operational decision-making: An exploratory study
Abstract
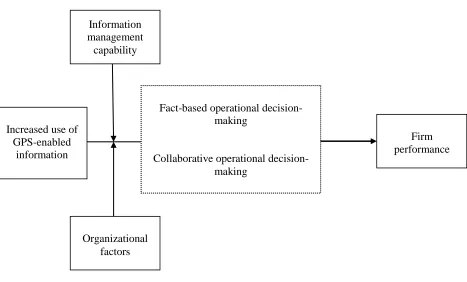
Although the impact of ICT-enabled information on firm performance has been well documented in the business value of IT literature, our understanding of how GPS adoption can transform operational decision-making and foster differential firm performance is limited. In response, we conduct an exploratory comparative case study of three transport firms that have implemented the same GPS during the same year in their operations. Our results highlight that increased use of GPS-enabled information can enhance information quality and make operational decision-making more fact-based and collaborative. We also find that such transformations in operational decision-making, driven by increased use of GPS-enabled information, can foster differential performance impacts. However, we warn scholars and practitioners that a firm’s information management capability (in terms of availability of quality information in decision-making, software tools for connectivity and access to information, IT systems integration post-GPS adoption and adaptability of the infrastructure to emerging business needs) and organizational factors (such as such as top management support, project management of GPS implementation, financial support, end-user involvement, rewarding, training and employee resistance) can facilitate (or inhibit) effective use of GPS-enabled information in operational decision-making and, thus, moderate differential performance benefits of GPS adoption.
The role of GPS-enabled information in transforming operational decision-making: An exploratory study
Introduction
The potential of information systems (IS) to transform decision-making and foster organizational performance has been emphasized in the business value of IT literature for quite some time (Dedrick et al., 2003; Mithas et al., 2011). In supply chain studies, IS have been found to support timely decisions, provide information that enhances comparative advantage in supply chain relationships, help to manage risk in exporting and offer a means to cope with uncertainty inherent in the business environment (White et al., 2003; Eng, 2004; Souchon et al., 2004; Li & Lin, 2006; Davis & Golicic, 2010). High quality information, i.e. information that is reliable, accurate and timely (Low & Mohr, 2001; Davis & Golicic, 2010), facilitates improvements in decision quality and can, in turn, foster improvements in firm performance (Parssian, 2006). To leverage the benefits of high quality information, firms are, therefore, increasingly investing in Information and Communication Technology (ICT). ICT enables storing, organizing and structuring information consistent with user needs and endorses instantaneous information availability through easy sharing (Carbonara, 2005).
In transport firms, the application of ICT is particularly critical in supporting operational decision-making and enhancing firm performance. Unexpected delays, lack of coordination, delivery constraints and variable demand are common obstacles in providing superior customer value in this industry (Sanchez-Rodrigues et al., 2008). Practical evidence shows that transport firms with little access to high quality information find it hard to manage transport service amidst such uncertainty. For example, they find difficulty in monitoring employees’ daily productivity, struggle to exercise control over speeding (e.g. 5 mph driven above the posted speed limit can cost about 20 cents more per gallon of gas) and often fail to identify the location of every vehicle, to send the closest vehicle to a job site, and so forth. Such uncertainty amplifies exposure to risk in the supply chain and leads to increased total costs (Sanchez-Rodrigues et al., 2008). The need to inform operational decision-making with high quality information is, therefore, extremely important in the transport industry (Sanchez-Rodrigues et al., 2008; Sanchez-Rodrigues et al., 2010a).
communication, planning and agility in the transport process (Van Der Vorst et al., 1998; Giannopoulos, 2004; Marchet et al., 2009). GPS technology has some important and interesting characteristics. It allows transport firms to determine the geographical position of a vehicle on a map in real time, calculates the distance to a transport destination, enables communication between dispatchers and drivers at all times and collects transport data that can be used for further analysis (Mintsis et al., 2004). GPS-enabled information can, therefore, potentially aid transport firms in minimizing costs and improving control in the transport process, calculating wages, reducing manual work and the use of mobile phones, automating and improving information sharing, and, ultimately, optimizing real-time decision-making, fleet management and customer service (Giannopoulos, 2004; Mintsis et al., 2004; Marchet et al., 2009).
However, scholars increasingly argue that leveraging such performance benefits, depends less on having the technology and more on being able to make the best use of information in decision-making (Dedrick et al., 2003). Studies on the relationship between investments in ICT and firm performance have produced equivocal findings (Davis & Golicic, 2010). ICT investments have been linked to improvements in processes and operations (Ryssel et al., 2004; Davis & Golicic, 2010; Mithas et al., 2011), productivity (Brynjolfsson, 1993; Dedrick et al., 2003), financial performance (Devaraj & Kohli, 2000), efficiency and relationship development (Wu et al., 2003), competitiveness (Liu & Arnett, 2000; Mithas et al., 2011) and customer satisfaction (Tracey et al., 1999; Ata & Toker, 2012). Yet, critics of studies linking ICT investments to firm performance note that firms only enjoy differential performance when ICT is combined with resources and capabilities that drive comparative advantage (Clemons & Row, 1991; Mithas et al., 2011). Scholars, for instance, have highlighted the role of systems integration (Rai et al., 2006), alignment with core competencies and the firm’s information management capability (Mithas et al., 2011) as critical in leveraging differentials in firm performance. It seems that some firms use IT more productively than others (Dedrick et al., 2003). Emphasis is, therefore, increasingly placed on the underlying mechanisms that link investments in ICT to financial performance (Bharadwaj, 2000).
Despite increasing recognition of the value that GPS investments can bring to transport firms and their wide spread adoption in the transport industry, our understanding of
how GPS-enabled information transforms operational decision-making in this context and
Bharadwaj, 2000; Dedrick et al., 2003; Lu & Ramamurthy, 2011). To address this gap, we conducted a comparative case study of three transport firms that adopted the same GPS during the same year. We explored: (RQ1) How does the adoption of GPS transform operational decision-making in the transport process? (RQ2) What are the underlying mechanisms that facilitate better use of GPS-enabled information in operational decision-making and link investments in GPS to firm performance?
Our contribution to the business value of IT literature is threefold. Firstly, our results highlight that GPS-enabled information can enable a shift towards fact-based and collaborative decision-making in the supply chain (among the transport firm, client, maintenance firm etc.). Secondly, we find that the more prominent these changes in operational decision-making are, the more they can underlie differential performance impacts of GPS adoption. Yet, thirdly, we identify that the firm’s information management capability (availability of quality information in decision-making, software tools for connectivity and access to information, IT systems integration post-GPS adoption and adaptability of the infrastructure to emerging business needs) and organizational factors (such as top management support, project management of GPS implementation, financial support, end-user involvement, rewarding, training and low employee resistance) endorse more effective use of GPS-enabled information in operational decision-making and, therefore, moderate the relationship between GPS-enabled information and firm performance. As such, GPS-enabled information has the power to not only allow firms to automate (replace human labour in automating business processes) and informate (provide information about business activities to senior management and employees), but more importantly to transform information quality and operational decision-making in supply chain relationships (Zuboff, 1988).
managerial implications of our findings. The paper concludes with avenues for future research.
Theoretical Background
The inherent uncertainty in the transport process is a key challenge for operational decision-making in transport supply chains. Uncertainty is seen to increase risk within supply chains and is an obstacle to the effective management and control of supply chain operations (Sanchez-Rodrigues et al., 2010a). Generally, “uncertainty occurs when decision makers
cannot estimate the outcome of an event or the probability of its occurrence” (Sanchez-Rodrigues et al., 2010b, p. 62). With limited information at hand, decision makers find it hard to determine how they should proceed and which decision is best to accept (Van Der Vorst & Beulens, 2002). In the transport industry, uncertainty comes in different forms. Request uncertainty, for instance, refers to spontaneous changes of the portfolio of requests (Fleischmann et al., 2004). Handling uncertainty refers to issues pertaining loading or unloading times; these may exceed or be shorter than the planned handling time. Transshipment uncertainty relates to possible delays caused by the non-availability of ramps, gates, or special loading or unloading equipment, such as forklift (Schönberger, 2010). Lastly, loading uncertainty refers to situations when different types of goods cannot be loaded as planned or are not allowed to be loaded by the same resource (Gendreau et al., 2004).
can be classified as ‘good information’ for quite some time (Eppler et al., 2004). A review of management, communication and IT literature on what determines information quality, reveals numerous criteria that influence information quality in different contexts (Eppler, 2006). It is, therefore, fair to say that information quality is a vaguely defined concept (Lillrank, 2003) and there is no single established definition for it (Ruževičius & Gedminaitė, 2007). For the purpose of this work, we adopt the definition of information quality offered by Ruževičius and Gedminaitė (2007). We argue that information quality is a function of its reliability, accuracy and timeliness (Low & Mohr, 2001) and focus on information that serves the needs of dispatchers, who are planning and controlling operations in dispatching centers within transport firms (Mintsis et al., 2004).
Quality information can particularly facilitate operational decision-making in the transport industry. Operational decision-making includes areas such as the fine-tuning of production, sales and distribution and the management of day-to-day operating processes and systems (McDonald et al., 2008). In the transport industry, operational decision-making refers to “decision making performed by local management, yard masters and dispatchers, for
example, in a highly dynamic environment, where the time factor plays an important role and
detailed representations of vehicles, facilities and activities are essential. It includes: the
implementation and adjustment of schedules for services, crews, and maintenance activities;
the routing and dispatching of vehicles and crews; the allocation of scarce resources”
(Crainic, 2000, p. 274). Information enters the decision-making process when the decision makers identify a problem, develop criteria, and formulate a range of possible solutions to the problem (Korhonen-Sande, 2010). In decision-making, the use of information can be either instrumental (direct), where a decision is made through the direct application of the information, or conceptual (indirect), where information is used in the form of concepts, assumptions, models, theories and heuristics (rules of thumb) (Korhonen-Sande, 2010, p. 662). Under conditions of high uncertainty (Citroen, 2011), high complexity and high time pressure (Low & Mohr, 2001) information has been found to act as a catalyst that supports decision-making. Quality information from electronic and real-time data, for instance, has been found to enhance real-time analysis in decision-making (Mithas et al., 2011), enable quick responses to market needs (Davis & Golicic, 2010) and, overall, improve supply chain
logistics efficiency (Paulraj & Chen, 2007).
between organizations and individuals (Morgan et al., 2006, p. 980), such as automatic vehicle location technologies using either GPS or digital mobile communications (Giannopoulos, 2004). Reported benefits include improved real-time tracking information, better information visibility and reliability and enhanced up to date information sharing (Ferneley & Ben, 2006; Morgan et al., 2006). The increased use of easily accessible, highly accurate and on-time information, therefore, enhances a firm’s information management capability and facilitates improvements in operational decision-making (White et al., 2003). For example, for firms with substantial export operations, increasing use of information helps them avoid making ‘not optimal’ export decisions (Souchon et al., 2003). Additionally, firms can use information to understand and manage the performance of their marketing strategies (Moorman, 1995). Moreover, increased use of information has been found to improve confidence in the decision-making process, since it equips managers with the ability to deal with ambiguous situations more effectively (White et al., 2003).
The impact of IT on business processes and firm performance has dominated debate in the business value of IT literature (Brynjolfsson & Hitt, 1996; Kohli & Devaraj, 2003; Melville et al., 2004; Mithas et al., 2011). Several studies have taken a process orientation to illustrate the positive performance impact of IT (Mukhopadhyay et al., 1997). Mukhopadhyay
Mithas et al. (2008) also propose an insignificant or negative relationship between IT investments and customer satisfaction.
Against these equivocal findings, there is, therefore, growing evidence that although IT infrastructure provides a needed foundation for decision-making, it is the use and management of information that are critical, so that technology-enabled information can be appropriately deployed to generate differentials in firm performance (Mukhopadhyay et al., 1997; Mithas et al., 2011). Scholars, for instance, argue that “the ability to provide data and information to users with the appropriate levels of accuracy, timeliness, reliability, security,
confidentiality, connectivity, and access and the ability to tailor these in response to changing
business needs and directions” (Mithas et al., 2011, p. 238), i.e. a firm’s information management capability, may enable process management that can trigger differences in firm performance (Kohli & Grover, 2008). This includes not only the availability of quality information for decision-making, but also software tools that endorse connectivity and access to such information, IT systems integration and the ability to adapt the IT infrastructure to emerging business needs (Mithas et al., 2011). A number of scholars studying supply chains also highlight the role that information sharing plays on mobilizing positive process outcomes and firm performance (Mukhopadhyay et al., 1997; Mukhopadhyay & Kekre, 2002). Information sharing enables processes that connect the firm with its supply chain business partners (Davenport, 1993). As such, it enhances internal business process integration and improves a firm’s ability to rapidly cope with market or demand changes (Lu & Ramamurthy, 2011). Mukhopadhyay & Kekre (2002), for instance, show that electronic integration in B2B procurement processes offers suppliers operational gains in transaction processing, which over time translate into strategic benefits, such as increased sales. Improved inventory turnover, plant productivity, product quality, accuracy and sales, along with reduced costs, are often highlighted as key productivity impacts of information sharing (Dedrick et al., 2003).
as on the extent of organizational resistance. Similarly, Dezdar and Sulaiman (2011) show a positive relationship between organizational factors such as top management support, enterprise-wide communication and IT training and education, and IT implementation success. Top management should have an active role in the IT adoption process ((Nah et al., 2001; Dezdar & Sulaiman, 2011). Moreover, IT needs to be integrated into the firm’s strategic planning process (Tippins & Sohi, 2003). Additionally, formal training should be provided to help end-users accept the organizational change (Nah et al., 2001); it should address all aspects of the system and be offered on a continuous basis (Dezdar & Sulaiman, 2011). Finally, enterprise-wide communication is important, since expectations for IT adoption should be clearly communicated across levels (Nah et al., 2001; Dezdar & Sulaiman, 2011).
Building on this theoretical background, our understanding of how GPS-enabled information transforms operational decision-making in the transport industry to support decisions amidst high uncertainty remains limited. Moreover, against the equivocal findings on the relationship between investments in ICT and financial performance (Davis & Golicic, 2010), our knowledge of the underlying mechanisms that link GPS-enabled information to improvements in firm performance is also scarce (Bharadwaj, 2000; Dedrick et al., 2003). These gaps have motivated our research questions: (RQ1) How does the adoption of GPS transform operational decision-making in the transport process? (RQ2) What are the underlying mechanisms that facilitate better use of GPS-enabled information in operational decision-making and link investments in GPS to firm performance? Our research explores these questions through a comparative case study of three transport firms that have implemented the same GPS during the same year. We now detail our research approach.
Research approach
Research sites
[image:11.595.65.496.388.602.2]We carried this research in transport firms, as the transport context has proven well suited to study the benefits of information on decision-making (Mintsis et al., 2004). Uncertainty in costs, routes and dealing with distributors are challenging decision-making in transportation (Ghodsypour & O'brien, 2001). We theoretically sampled firms to fit our research focus (Eisenhardt, 1989). The three Slovenian medium-sized (according to the European Commission, firms with 50-250 employees are classified as medium-sized) transport firms have all implemented the same GPS during the same year. Since its adoption they have grown in size, annual revenues and size of fleet. The transport industry in Slovenia represents almost 10 percent of the Gross Domestic Product and is the only industry in the country that has significantly grown in the past two years (by over 10 percent). Lastly, within this setting we sought firms with similarities that would aid comparisons and replication, yet with sufficient heterogeneity to help assess potential generalizability. Table 1 provides relevant details about the three transport firms in our study.
Table 1 Overview of case firms
Source: The Agency of the Republic of Slovenia for Public Legal Records and Related Services
Data collection
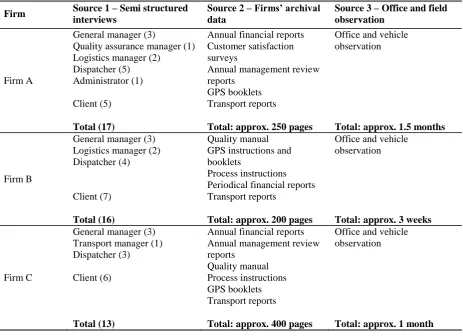
We carried out this research using qualitative methods from multiple sources (Eisenhardt, 1989). Data were collected from three main sources (see Table 2): (1) semi-structured interviews, (2) archival data, and (3) observation. Interviews were our primary source of inductive data, while archival data and observations extended our understandings of each case context and added depth to our interview findings (Forster, 1994).
Firm Year founded
Services and specialization
Number of employees
Annual revenues
Number of vehicles
Firm A 1978
Land transport in EU of all types of goods using road trains and
mega trailers, maintenance
61 €5,718,735 45
Firm B 1986
Land transport in EU of frozen food and
liquids, using specialized vehicles for food and liquids
transportation
54 €2,745,945 39
Firm C 1990
Land transport in EU of all types of goods using road trains and
mega trailers, maintenance
Table 2 Data sources
Firm Source 1 – Semi structured interviews
Source 2 – Firms’ archival data
Source 3 – Office and field observation
Firm A
General manager (3)
Quality assurance manager (1) Logistics manager (2)
Dispatcher (5) Administrator (1) Client (5)
Total (17)
Annual financial reports Customer satisfaction surveys
Annual management review reports
GPS booklets Transport reports
Total: approx. 250 pages
Office and vehicle observation
Total: approx. 1.5 months
Firm B
General manager (3) Logistics manager (2) Dispatcher (4)
Client (7)
Total (16)
Quality manual GPS instructions and booklets
Process instructions Periodical financial reports Transport reports
Total: approx. 200 pages
Office and vehicle observation
Total: approx. 3 weeks
Firm C
General manager (3) Transport manager (1) Dispatcher (3) Client (6)
Total (13)
Annual financial reports Annual management review reports
Quality manual Process instructions GPS booklets Transport reports
Total: approx. 400 pages
Office and vehicle observation
Total: approx. 1 month
Interviews. We conducted a total of 28 interviews with employees who were directly (e.g. Dispatchers) and indirectly (Administrators) involved in the transport process. We also sought information from clients. We conducted 18 interviews with clients who used the transport services of the case firms. Interviews were conducted from December 2009 to January 2010, and in May 2011. Their length varied from one hour to one hour and a half (average length was one 70 minutes). Interviews were audio recorded and transcribed.
Archival data. Annual financial reports, GPS handbooks, transport reports, quality manuals and process instructions were the main internal documents that were examined. All three firms have also implemented quality standard ISO 9001. Therefore, quality manuals and process flows were also examined.
GPS and how information available through GPS was transmitted to other departments for further use.
Data analysis
Our data analysis was iterative. Following Glaser and Strauss (1967) and Miles and Huberman (1994), systematic, iterative comparisons of data, emerging categories and existing literature aided the development of an integrative theoretical framework.
Stage 1: Isolating broad categories within each case. From our data, we first compiled separate case studies of each firm. We identified patterns and variance in descriptions of how information stemming from GPS adoption transformed operational decision-making and examined the underlying mechanisms that linked GPS-enabled information to improvements in firm performance. To assess the reliability of the generated open codes, we then involved a second coder, with considerable qualitative research experience. Disagreements were resolved through discussion between the first author and second coder.
Stage 2: Linking related concepts within each case. During this stage we examined all conclusions derived from the initial coding and established links between and among previously stated categories, a process known as selective coding. We allowed concepts and patterns to emerge based on the primary data collected, while new categories were added and others were regrouped when further interviews were analyzed (Cassell & Symon, 1994). Stage 3: Cross case comparisons. To enhance generalizability (Firestone & Herriott, 1983), as well as to deepen understanding and explanation (Glaser & Strauss, 1967), we compared each category and its properties across cases. Our main intent was to compare and contrast changes in the operational decision-making amongst the three case firms. To assess the reliability of each dimension we firstly involved the second coder. All disagreements were resolved through discussion. Secondly, we shared the results of the initial analysis with key informants at the three case firms and with an independent professional in the field to assess whether the conclusions reached were plausible.
Due to space limitations, we introduce how the three case firms used GPS in their transport process in our supplementary online Appendix. We now discuss our findings. We first reveal how the the adoption of GPS has transformed operational decision-making in the three firms (RQ1). Second, we uncover the underlying mechanisms that link GPS-enabled information to improvements in firm performance (RQ2).
Findings
Changes in operational decision-making after GPS adoption
In response to our first research question, we examined how information stemming from GPS adoption transformed operational decision-making in the three case firms. We found that use of GPS mobilized improvements in information quality across the case firms. Moreover, operational decision-making was now more fact-based (less intuition-based) and collaborative. We now discuss these findings in more detail.
Improvements in information quality and scope of GPS implementation in operational decision-making
information dissemination. Dispatchers in the case firms were now able to disseminate timely information to members of the supply chain (Davis & Golicic, 2010). Lastly, use of the GPS fostered information visualization; gaining insight into data through visual representation (Ellis & Dix, 2007).
However, our findings also revealed that the scope of GPS use in different areas of operational decision-making was wider in Firm C, than in Firms A and B (see Table 3). Firms A and B primarily used GPS information for making operational decisions about transport service performance (e.g. position of the vehicle, vehicle characteristics, costs of the driver). Firm B’s General Manager, for instance, explained: “We get daily information about fuel consumption, as the system is connected to the engine computer that calculates current
vehicle consumption”. Yet, Firm C expanded their use of GPS information in operational decisions supporting transport service (such as maintenance, fuel supply, etc.), but also in identifying and catering to client-specific requests. As such, Firm C further leveraged cost savings in terms of fuel consumption and was able to improve sales through a more customer-oriented transport process. A Transport Manager in Firm C noted: “We can plan following
Table 3 Scope of GPS implementation in different operational decisions and improvements in information quality
Use of GPS information in different operational decisions
Explanation of operational decisions
Key benefits in information quality
Potential
performance benefits
Firm A Firm B Firm C
Position of the vehicle
Current position of the vehicle (e.g. 5 miles West of City Ljubljana, Side Road Nr. 10)
Information timeliness and accuracy Average mileage, Average sales/km, Customer satisfaction √ √ √ Vehicle characteristics (length, width, height)
Characteristics of the vehicle, such as registration plate, length, width, height
(e.g. Road Train KR 56-88D (18.75m, 2.55m, 4m))
Information integration and visualization
Customer satisfaction √ √ √
Mileage, duration of the specific transport
Mileage and duration of transport between loading and unloading place (e.g. Transport Ljubljana-Villach, Salzburg – Munich = 429 kilometers, 4 driving hours, stop in Villach 15 minutes)
Information generation and availability Customer satisfaction, Average sales/month/vehicle, Average mileage (km)/month √ √ √ Driver costs
Estimating costs of the driver based on: number of kilometers*€0,12 + number of loadings/unloadings*€11 + transport during the weekend (€75) + transport in non EU country (€10)
Information integration and visualization, Internal information dissemination Earnings/employee, EBT √ √ √ Loading and unloading specifications
Detailed information about the loading and unloading places, such as: loading/unloading address, shipment number, contact person, booking times, number of the ramp, etc.
Information integration and visualization
Customer satisfaction √ √ √
Costs of fuel, tolls, etc.
Information about the current price of the fuel and toll, bridge, tunnel.
Information integration
and visualization EBT, ROA
Determining maintenance work
GPS enables monitoring the planning of maintenance work for each vehicle. Maintenance information is marked per vehicle with the
following colors: Green (maintenance within 2 months), Yellow
(maintenance within 1 month), Red (maintenance within two weeks).
Internal information dissemination Average sales/month/vehicle, Average mileage (km)/month √ √ √
Time spent on maintenance
GPS monitors average time spent for maintenance (e.g. average small service 2 hours 20 minutes, medium service 3 hours 10 minutes and large service 5 hours 30 minutes). The information is used when planning transports.
Information generation and availability Average sales/month/vehicle, Average mileage (km)/month √ √ Possible errors
GPS has a warning function
recognizing an error made during the drive from loading to unloading. (e.g. Exceeding the driving hours allowance, not having enough minutes of short break, driving over speed limit, etc.).
Information generation and availability
Customer satisfaction, Average mileage
√ √
Additional clients in the area of the transports
The clients are entered in the GPS and when a vehicle is sent to a certain destination, the system offers the dispatcher possible clients that have loads close to the unloading place. (e.g. The vehicle is sent to deliver goods to Hamburg. GPS shows the clients that have expressed interest in loads from Hamburg or places around (within 150 kilometers) towards Austria or Slovenia).
Information generation and availability
Average
sales/month/vehicle, EBT
√
Average weight GPS enables monitoring the weight
of the loads of all vehicles towards
Information generation and availability
different destinations. This helps the dispatcher to plan the transport in certain countries where there are special limitations regarding the weight of the vehicle.
(e.g. In Europe the total weight of the vehicle including the goods must not exceed the 40 tons).
Liters of fuel in the tanks and vehicle fueling periods Time spent for fueling
Current level of fuel in the tank, average consumption of the vehicle and average fuelling time on the gas station.
(e.g. Vehicle KR 56-88D (345 liters; weekly consumption 32,7 liters/100 kilometers; average 20 minutes fuelling period)).
Information generation and availability, Information timeliness and accuracy, Internal information dissemination
EBT, ROA, Average sales/month/vehicle, Average
sales/kilometer
√
Client-specific information
GPS enables entering specific information about the client, such as: working time, type of goods, contact person, change of the pallets and other material, etc.
Information generation and availability, Information timeliness and accuracy
Customer satisfaction, Average
sales/kilometer, Average
sales/month/vehicle
√
Fact-based and Collaborative decision-making
Increased use of GPS information endorsed fact-based operational decision-making. Rationality in decision-making reflects the degree to which a decision maker relies on consideration of relevant facts in making decisions (Low & Mohr, 2001). Decision makers who are less rational tend not to see the need to use much information; they rely on their own intuition (Low & Mohr, 2001; Citroen, 2011). The case data revealed that decision-making before GPS adoption was less rational and more intuitive. An informant explained: “With no current information about the position of
the vehicle from the GPS, we did not know for sure where the vehicle was when the
client called us. We estimated the unloading time, according to previous experience
but not according to any actual information that we had” (Dispatcher Firm A). Another elaborated: “For sure the price was calculated based on our feeling of what
the client would accept. We knew the competition and therefore we estimated how low
the price for a specific destination could go. The real calculation was hardly ever
made” (General Manager, Firm C). This had implications in terms of uncertainty around costs and quotes, and often influenced efficiency negatively in the transport process.
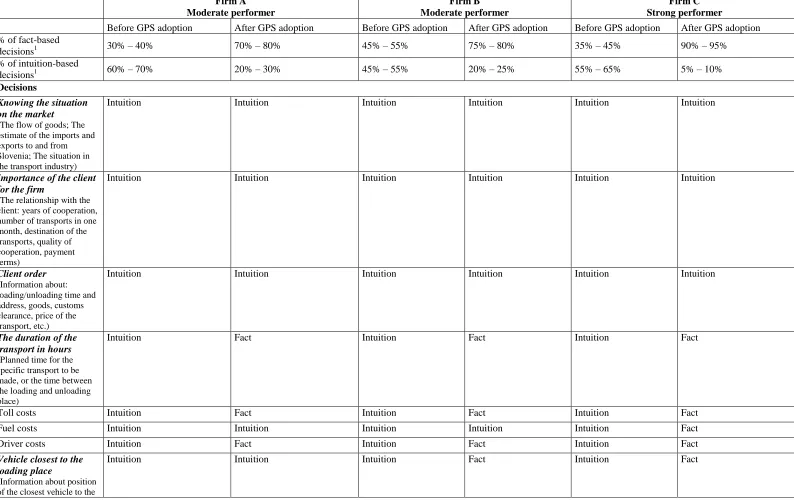
Yet, all firms proposed that with GPS adoption, the availability of new, accurate, reliable and on-time information helped transport firms to introduce decisions based on facts, rather than purely on assumptions and intuition (Watson et al., 2004; Hvolby & Steger-Jensen, 2010). This was mostly evident in Firm C (see summarized evidence in Table 4). The use of GPS information on transport, variable costs, fuel consumption, etc. made Firm C’s decision-making more fact-based. However, some intuitive assumptions still informed their decisions. As a General Manager in Firm C explained: “We sometimes change the decision about price, when
we have a feeling that the market price by competition would be lower”. And a Dispatcher added: “If we believe that the client is important for expanding our
Table 4 Facts vs. intuition driving decision-making before and after GPS adoption
Firm A Moderate performer
Firm B Moderate performer
Firm C Strong performer
Before GPS adoption After GPS adoption Before GPS adoption After GPS adoption Before GPS adoption After GPS adoption % of fact-based
decisions1 30% – 40% 70% – 80% 45% – 55% 75% – 80% 35% – 45% 90% – 95% % of intuition-based
decisions1 60% – 70% 20% – 30% 45% – 55% 20% – 25% 55% – 65% 5% – 10%
Decisions
Knowing the situation on the market
(The flow of goods; The estimate of the imports and exports to and from Slovenia; The situation in the transport industry)
Intuition Intuition Intuition Intuition Intuition Intuition
Importance of the client for the firm
(The relationship with the client: years of cooperation, number of transports in one month, destination of the transports, quality of cooperation, payment terms)
Intuition Intuition Intuition Intuition Intuition Intuition
Client order
(Information about: loading/unloading time and address, goods, customs clearance, price of the transport, etc.)
Intuition Intuition Intuition Intuition Intuition Intuition
The duration of the transport in hours
(Planned time for the specific transport to be made, or the time between the loading and unloading place)
Intuition Fact Intuition Fact Intuition Fact
Toll costs Intuition Fact Intuition Fact Intuition Fact Fuel costs Intuition Intuition Intuition Intuition Intuition Fact Driver costs Intuition Fact Intuition Fact Intuition Fact
Vehicle closest to the loading place
(Information about position
loading place of the planned transport)
Clients close to the unloading place
(The clients are entered in the GPS and when a vehicle is sent to a certain
destination, the system offers the dispatcher possible clients that have loads close to the unloading place)
Intuition Fact Intuition Fact Intuition Fact
Quality of the road
(The roads in different countries are marked and grouped in motorways, highways, side roads, etc. The dispatcher can obtain through GPS a digital camera view (through Google Maps) which shows the quality of the road)
Fact Fact Intuition Fact Intuition Fact
Illustrative Quotes “The dispatchers, who work
with clients on a daily basis, knew what the market and our competition could offer. If the transport was important for us we lowered the price by 20 or 50 Euro, however we never did a precise calculation, what the price means for us.” (General Manager)
“The company has a formula for calculating price which includes the following information from the GPS: mileage, duration of the transport, price of toll and fuel and costs of the driver. The price averagely deviates from the accepted market price in short distances between 15% and 25% and long (over 2500 km) distances between 5% and 7%.” (Observation notes)
“We had some rough estimation; however, how the competitive firms behave was crucial for us”. (Dispatcher)
“We have a strategic client for which we propose yearly prices for all destinations. The starting point is the price from the last year, which is recalculated and then negotiated. How low we can go with the price depends on the quantity of the transports and on the situation on the market.” (General Manager)
“We estimated the variable costs and we knew that the price must cover this number”.
(Dispatcher)
“We now calculate our internal cost price. We add the margin and correct it according to the importance of the client. The price is finally intuitively adjusted according to the market trends. In most cases this is the final price. It is very precise and for this reason we do not have an alternative solution in case the price would not be accepted.”
(Logistics Manager)
1Estimates provided by the case informants during interviews
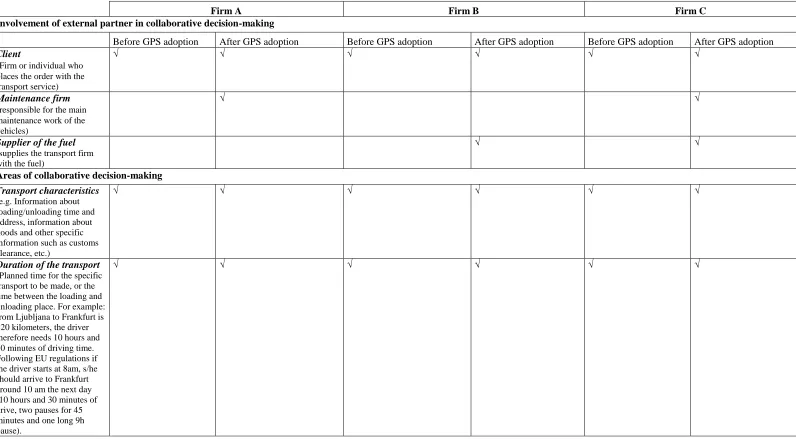
Moreover, wide use of GPS-enabled information endorsed more collaborative decision-making. Collaborative relationships refer to communication, trust, and interdependence among firms in the supply chain; these have been found to reduce uncertainty and risk in the decision-making process (Wu & Chuang, 2010). Our findings suggested that the more widely the case firms used GPS information, the more they established collaborative decision-making among supply chain partners (e.g. transport firm, maintenance firm, supplier of the fuel, client), resulting in added benefits for all involved partners. Across the cases, informants stressed that key information from the GPS, such as the position of the vehicle, vehicle characteristics (length, width, height), mileage, duration of the specific transport and loading and unloading specifications, was pivotal in resolving questions among supply chain partners about the duration of the transport, monthly capacity needed, possible loading/unloading days, type of goods delivered, etc.
Table 5 Collaboration in decision-making before and after GPS adoption
Firm A Firm B Firm C
Involvement of external partner in collaborative decision-making
Before GPS adoption After GPS adoption Before GPS adoption After GPS adoption Before GPS adoption After GPS adoption
Client
(Firm or individual who
places the order with the transport service)
√ √ √ √ √ √
Maintenance firm
(responsible for the main
maintenance work of the vehicles)
√ √
Supplier of the fuel
(supplies the transport firm with the fuel)
√ √
Areas of collaborative decision-making
Transport characteristics
(e.g. Information about loading/unloading time and address, information about goods and other specific information such as customs clearance, etc.)
√ √ √ √ √ √
Duration of the transport
(Planned time for the specific transport to be made, or the time between the loading and unloading place. For example: from Ljubljana to Frankfurt is 820 kilometers, the driver therefore needs 10 hours and 30 minutes of driving time. Following EU regulations if the driver starts at 8am, s/he should arrive to Frankfurt around 10 am the next day (10 hours and 30 minutes of drive, two pauses for 45 minutes and one long 9h
Type of goods
(e.g. Construction material, glass wool, automobile spare parts, granulate, etc.)
√ √
√ √ √
Monthly capacity
(e.g. Number of loads per destination that can be made by the transport firm on a weekly and monthly basis)
√ √ √
Loading/unloading days
(The preferred
loading/unloading day. For example for short transports like transport from Ljubljana to Vienna, the preferred loading day is Thursday so that the driver is back to Slovenia by Saturday and having a weekend pause made by Monday. However for long transports, like transport from Ljubljana to London, the preferred loading day is Friday, so that the driver can go on the road already on Sunday night at 9pm when the
Sunday road closure ends)
√
√
√
Type of driver required
(Some drivers from foreign countries have limitations to do transports to certain
countries)
√
Packing characteristics
(Whether the goods are packed on the pallet (euro pallet or English pallet), bags,
etc.)
√
√
Customs clearance
(If the transport is made to Switzerland, Croatia, Ukraine or any other non EU country the information for customs clearance (the name of the
agent, border, etc.))
Source: Interview transcripts
(Information about previous and planned fuel deliveries)
Maintenance planning
(Information about previous and planned maintenance
work)
√
Illustrative Quotes
"We communicated with the client when we received an order about details of loading and unloading times and peculiarities that we should consider; and at the end, when we informed the client that the transport is
completed.” (Dispatcher)
“Before we sign the contract we set the standards about the delivery days. If the duration of the transport is more than 5 days and delivery is not in the same week we leave the option to the transport firm to set the unloading day itself. However, this information must be passed to us before the loading day, so that we can arrange the unloading with the receiver of the goods.” (Client)
"We did not know exactly where the vehicles were at a certain time. We passed this information to the client only when the driver called us." (Dispatcher)
“The transport firm gives us each year the
information when it is best for them to come to our warehouse for loading. Usually this is based on their experience of past transports. We then fix the day and arrange our production regarding this agreement.” (Client)
"The planning of further maintenance was really hard. We did not know the position of the vehicle, hence we could not inform the
maintenance firm when the vehicle will be in the workshop." (General Manager)
Informants from Firms A and B mainly discussed how decision-making was transformed in relation to collaborating with their clients and operational efficiency. A Dispatcher from Firm A explained the situation before GPS adoption: “After we received an order, it was our decision how to plan and perform the transport, as long as we were on time
at the loading/unloading place”. The firm could not change the loading or unloading days, while the client was not supported with sufficient information on why this was the case. Transport information from the GPS enabled these transport firms to promptly inform their clients about the position of vehicles and any changes that happened or were about to happen during the transport service. A Logistics Manager from Firm B noted: “If anything unplanned happens on the road, we immediately inform the client”. A Dispatcher from Firm A
reinforced this point: “We then together decide what is best to do, to change the route or the loading/unloading times”. It was evident that the clients also positively received this change
towards a more collaborative decision-making approach. For instance, a client of Firm B elaborated: “Before, we just asked the transport firm about the price and the feasibility of a
specific transport. However, we never elaborated how it will be performed”. Pre-GPS adoption, the partners were distant and only the transport firm drove decisions about transport performance. A client of Firm A noted: “We used to set the loading day on Friday, not
knowing that in this case the driver needs to drive over the weekend”. On the contrary, post-GPS adoption the transport firm was able to provide clients with information (such as mileage, duration of the transport), collaborate on planning monthly capacity, possible loading and unloading days, and estimating the duration of the transport. “We now together set the best loading day and frequency of transports, so that the transport firm does not have
unnecessary costs and that it is suitable for our production plan” (Client, Firm A).
Informants across cases noted that this resulted in substantial cost savings for all partners, improved customer satisfaction and increased sales for the transport firms.
The General Manager of Firm C explained: “Before the GPS implementation we did not know the estimated time for the vehicle to arrive to the maintenance shop. The workers in the
maintenance shop had other vehicles to check. Therefore, our drivers each time waited for at
least two hours”. The Dispatcher could now constantly monitor the vehicle and was able to plan the maintenance works in advance. A Dispatcher from Firm C elaborated: “At the day of sending the vehicle to the maintenance shop we inform them when exactly the vehicle will be
there, we decide together whether the proposed time should be changed… As a result, we can
plan further transports for the driver and the maintenance shop knows exactly when to expect
the vehicle. It is much easier for both partners”.
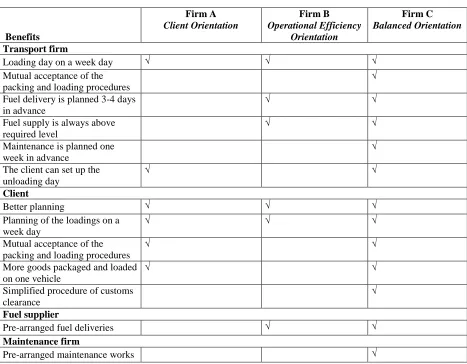
[image:27.595.52.519.385.749.2]Table 6 provides a summary of the benefits for the three transport firms, their clients, their fuel suppliers and maintenance firms from the shift towards more collaborative decision-making following GPS adoption.
Table 6 Benefits of collaborative decision-making after GPS adoption
Benefits
Firm A
Client Orientation
Firm B
Operational Efficiency Orientation
Firm C
Balanced Orientation
Transport firm
Loading day on a week day √ √ √ Mutual acceptance of the
packing and loading procedures
√
Fuel delivery is planned 3-4 days in advance
√ √
Fuel supply is always above required level
√ √
Maintenance is planned one
week in advance
√
The client can set up the unloading day
√
√
Client
Better planning √ √ √
Planning of the loadings on a week day
√ √ √
Mutual acceptance of the packing and loading procedures
√
√
More goods packaged and loaded on one vehicle
√
√
Simplified procedure of customs
clearance
√
Fuel supplier
Pre-arranged fuel deliveries √ √
Maintenance firm
Illustrative Quotes
"With one of our largest clients we agreed that they will arrange the delivery in a way that our drivers do not need to drive over the weekend. This saved us a lot of costs." (General Manager)
"Our transport firm gives us the time of vehicle arrival two days in advance, so
according to that information we can arrange the
production." (Client)
"This year we established the monthly required capacity of the transports that the transport firm needs to deliver. The
information that the transport firm passed to us was very helpful." (Client) Source: Interview transcripts
Overall, findings in relation to RQ1 illustrated that increased use of GPS information in more areas of decision-making, enhanced information quality and endorsed fact-based and collaborative decision-making among supply chain partners (e.g. transport firm, maintenance firm, supplier of the fuel, client), resulting in added benefits for all supply chain partners. Therefore, we argue that:
Proposition 1: Increased use of GPS-enabled information endorses fact-based and
collaborative decision-making.
Exploring the underlying mechanisms that link GPS-enabled information to improvements in
firm performance
Turning our attention to our second research question, we then investigated the link between GPS-enabled information in operational decision-making and firm performance. Due to space limitations, we provide our analysis on firm performance before and after GPS adoption for the three case firms in our supplementary online Appendix. Based on this analysis, we classified Firm C as the strong performer in our sample. Firm A performed relatively better than Firm B, so we classified Firm A as the moderate performer and Firm B as the weak performer within our sample (note, however, that both Firms A and B exhibited better performance across various indicators than the industry average).
firm performance. Wider use of GPS information improved information quality and enabled more fact-based (see Table 4) and collaborative (see Table 5) decision-making in Firm C, compared to Firms A and B. Managers as well as Dispatchers in Firm C argued that the move towards more fact-based and collaborative decision-making in the transport process was an important contributor to the firm’s growth. The General Manager in Firm C explained: “Now
we can reroute more vehicles in one week”. A Dispatcher added: “We can save time on
loading and unloading, while the bookings are already agreed together with the client”. A Transport Manager concluded: “Generally we can earn more with one vehicle, due to better
routing and direct savings during transport execution”. Moreover, Firm C’s clients not only
benefited from the availability of up-to-date information about the transport service. They also saw a dramatic improvement in managing urgent loads and coping with non-predictive changes. A Firm C client elaborated: “We can plan the production, as we have up-to-date
information when the vehicle will be at our place”. Another two clients added: “Workers in
the warehouse can plan the work and we cut overtime hours by 20%” …“Compared to what
we used to do, our cooperation is now much more simplified, with less phone contacts. We
are very happy for that”. Firms A and B were not leveraging these benefits to the same degree. According to a Dispatcher in firm A, “we can do more in the same time; however, we still need sometimes to contact the driver via cell phone, which also requires some time from
us”. A Logistics Manager in Firm B also claimed: “In some cases we were too expensive, hence we had to lower the price. The first transports were given to the competition”. And a
Dispatcher in Firm B added: “At first we were overloaded with all this new information and this was confusing for us”. The more fact-based and collaborative decision-making in Firm C,
the supply chain. Overall, informants from Firm C associated their improved performance to the wide scope of implementation and use of the GPS in their operational decision-making. We, therefore, propose that:
Proposition 2: Wider scope of implementation and use of GPS in operational
decision-making facilitates firm performance.
However, a closer look at the data (see Tables 3, 4, and 5) highlighted that the breadth of the implementation and use of GPS in operational decision-making in Firms A and B was quite similar. Yet, Firm A exhibited better performance than Firm B post-GPS adoption. Drawing on critics, who claim that firms only enjoy differential performance when ICT is combined with capabilities that drive comparative advantage (Clemons & Row, 1991; Mithas
Table 7 Firm Differences in Information Management Capability Firm A Moderate Performer Firm B Weak Performer Firm C Strong Performer Availability of quality information for decision-making GPS provides appropriate levels of accurate, timely, reliable, secure, and confidential information.
GPS provides appropriate levels of accurate, timely, reliable, secure, and confidential information.
GPS provides appropriate levels of accurate, timely, reliable, secure, and confidential information. Information is more visual and comprehensive.
Software tools for connectivity and access to information
Adequate software tools for connectivity and access to information are available.
Information about the transport service is directly emailed to the customer via GPS at certain times.
Adequate software tools for connectivity and access to information are
available.
The firm has two types of customers. “Strategic” customers receive the information about the transport service through direct access to GPS. Other, “less strategic” customers receive the information about the transport service via phone.
Adequate software tools for connectivity and access to information are
available.
Customers receive information about the transport service through direct access to GPS.
IT systems integration after GPS adoption
IT systems integration was manually handled. End-users cooperated during the integration.
IT systems integration was manually handled.
Full integration of GPS and transactional system.
Adaptability of the infrastructure to emerging business needs
Standard features of the GPS.
Standard features of the GPS.
Available additional online features of the GPS: - Fuel monitoring sensor connected with GPS - Digital tachograph connected with GPS
Table 8 Firm Differences in Organizational Factors
Top management support
Project was partially supported by top management.
“We knew that we needed the system, that was the reason why we implemented it, however I still believe that we could function also without it.” (General Manager)
Project was partially supported by top management.
“Current operation functioned well, we did not have complaints or reclamations. From this point of view this was not the reason for GPS adoption.”
(General Manager)
Project was fully supported by top management.
“We increased sales each year. We believed that the GPS will add also in future growth in sales.”
(General Manager)
Project management (Planning and managing the project)
Planning of the project was included in the implementation phase. The quality assurance manager was informally the project manager, who planned, controlled and managed the project.
“We saw the system within one of our partners. We then contacted their GPS supplier, and then we arranged the meeting, where the system was presented to us. Later the supplier arranged everything for the installations of the devices.”
(General Manager)
There was no special planning and management of the project. The general manager was in charge of the whole project. The supplier of the GPS was the informal leader of the project. (Observation notes)
Before the start of the project, the project group prepared the project description and investment plan in which also the project time-plan was presented. The project group was also responsible for managing and
monitoring the project. It reported to the General Manager about the results and its performance.
“The plan and description of all project phases was also presented verbally and in written form to us in the transport department.” (Dispatcher)
Financial support for the project
A budget was not allocated and the firm had limited financial capabilities.
“We had a limited amount of money to spend on this. In the same year we bought the land for a new logistics centre, which was our investment priority.” (General Manager)
The budget allocated was limited, however it was included in the yearly planning.
“We included this investment into our yearly investment plan. However, we limited it at around €35,000; anything more than that we would not be able to pay.”
(General Manager)
The budget allocated was large enough and was included in the yearly planning.
“We planned the budget for GPS adoption, which was not exceeded by the end of the project.” (Transport Manager)
End-user involvement
End-users (dispatchers, drivers) were involved in the GPS adoption from the start of the project. They actively cooperated during the installation
The general manager together with the GPS supplier firstly installed the system, but at the beginning it was inaccessible to other
phase and asked about the adjustments that needed to be done to optimize operation. They accepted the system pretty quickly.
dispatchers. They then fine-tuned it and then informed others how to use it. End-users were
educated and later constantly monitored by the general manager.
optimizing GPS operation and functionalities.
Rewarding scheme Data from the GPS were used to encourage the drivers to improve their performance.
Data from the GPS were used for wage
calculations and as part of the rewarding strategy.
“Measures of current rewarding system: number of hours in the office, job position, responsibilities, sick leave.”(Employment Relations Policy)
Data from the GPS were used to encourage the drivers to improve their performance.
Data from the GPS were used to encourage the drivers to improve their performance.
Data from the GPS were used for wage calculations and as part of the
rewarding strategy.
“With the use of GPS we were finally able to tell employees that their salaries depend on them.” (Transport Manager)
Training End-users received general training and education on the use of the GPS.
“The budget for training and education was very limited; therefore I tried to give an overview of the system. I explained what was needed to my colleagues.”
(Logistics Manager)
End-users received general training and support on how to use the GPS. Training was seen as an unnecessary cost.
“The implementation of the GPS was very costly, hence we did not decide to have any special training. The handbooks were handed to us by the supplier.”
(General Manager)
End-users received advanced training and support on how to use the GPS following a special training plan. Training was seen as an advantage. Training contract was stipulated with the supplier.
“We were asked to help the drivers while they were in the vehicle.”
(Dispatcher)
Employee resistance towards GPS use
The firm had minor problems with employee resistance towards GPS use.
“We have one driver that simply refused to use the GPS. For communication he still uses just his cell phone.”
(Dispatcher)
The firm had major problems with employee resistance towards GPS use.
“For some of the drivers we needed months so that they learn how to send the message. They received the message on the GPS system and sent a reply back from their cell phone. We had real chaos and at some point we could not solve the problem.” (General Manager)
The firm had no problems with employee resistance towards GPS use.
Source: Interview transcripts
To begin with, Firm C appeared to have the information management capability in
place to mobilize best use of GPS-enabled information and enjoy the performance benefits.
In particular, compared to Firms A and B, Firm C worked on the full integration of their GPS
and with their transactional system, including positions of the vehicles, times of the transports, stops, border crossings, time spent in different countries, fuelling, etc. The General Manager of Firm C noted: “We managed to establish the transfer of all information from the GPS to our transactional information system from the start of GPS functioning. At
first we had a few problems, which were resolved with our IT support immediately”. Firm C also leveraged online features to enhance information quality on additional decision areas
(for example, on fuel consumption). Firm A, however, appeared to make better use of
software tools for connectivity and access to information than Firm B.
Moreover, organizational factors seem to have facilitated better use of GPS or
inhibited its benefits amongst the case firms. In Firm C, for instance, the GPS adoption
project was fully supported by top management and careful project planning and
management was in place. The firm knew from the start what kind of information was
needed, when and how this information should be visually presented and how this
information should be shared among stakeholders (departments, clients, etc.). The GPS
adoption project was skilfully led by a project group and was given appropriate financial and
training support. The project group prepared a description of GPS adoption and investment plan, which included a time-plan with required changes and actions. A Dispatcher in Firm C recalled: “The plan and description of all project phases was also presented verbally and in