A methodology for ecosystem services
assessments across multiple scales
Written by
Simone Maynard
A thesis submitted for the degree of Doctor of Philosophy at the Australian National University.
Statement of Originality
I certify that the intellectual content of this thesis is the product of my own work and that all the assistance received in preparing this thesis and sources have been
acknowledged. This thesis has not been submitted for any other degree or purpose.
4
Acknowledgements
Foremost, I would like to express sincere gratitude to my Supervisors Steve Dovers, David James, Lorrae van Kerkhoff and Andrew Davidson for their continuous patience, motivation and enthusiasm which supported and encouraged me through the good times and the bad. The sharing of their expertise is an incredible gift - thank you.
Many others have also supported me on this journey, including: Tony Jakeman and Carmel Pollino at ANU who helped kick start my PhD; Melanie Cox for her advice, feedback, insightful comments and hard questions; Simon Warner, Mik Petter and Shannon Mooney at SEQ Catchments; SEQ stakeholders for their participation in workshops and meetings; and my partner (Jason Watego), my family and friends for their encouragement and just being there.
Abstract
The goods and services received from ecosystems (e.g. clean air, clean water, regulating climate, sense of place) are referred to as ecosystem services. People (stakeholders) receive and manage ecosystem services in different ways, rates, magnitudes and scales. This research is premised on the notion that to manage natural resources sustainably for ecosystem service provision we need to mainstream ecosystem services into all
stakeholder decision making and a framework is required to meet this purpose.
The most utilised framework is the one supporting the Millennium Ecosystem
Assessment (MA). Since the MA’s release in 2005 there has been exponential growth in ecosystem services research and framework development; there exists no systematic or agreed framework from which to assess ecosystem services across sites, ecosystems, catchments, regions or nations. A lack of analysis of existing initiatives, particularly the drivers underpinning the choice of process applied to develop frameworks and why information and tools differ, hinders the ability to make informed decisions on a framework’s relevance, transferability and scalability to purpose, or what is required to develop a more relevant framework. The use of different frameworks by stakeholders limits the use of assessment outcomes by others, and therefore the ability to inform natural resource management, planning and policy at different scales.
To better understand the drivers behind the choice of methodology applied in programs, this research analyses ecosystem services assessment methodologies and schools of thought developed in different contexts with a specific focus on geo-jurisdictional scales. In this research a methodology includes the process to develop a framework, and the information and tools supporting the framework.
6
This research provides: (a) a new understanding of the drivers, motivations and contexts that influence how ecosystem services assessment initiatives are shaped; and (b)
findings and Recommendations for use by those working in the ever-expanding field of ecosystem services, that will enable them to adopt, adapt or develop assessment
methodologies (process, information, tools) in a more sophisticated and explicit manner.
This research reveals the factors influencing the initiation of the program, the culture of coordinating organisations and the resources available strongly influenced the process applied to develop frameworks; the information incorporated in frameworks was influenced by the culture of nations, mandates of coordinating organisations, the existing evidence-base, and the need to integrate assessment outcomes with current natural resource initiatives; and the resources available and capacity of framework users influenced the tools developed. A major finding is the high influence the process
Table of Contents
Statement of Originality ... 3
Acknowledgements ... 4
Abstract ... 5
Table of Contents ... 7
List of Tables ... 13
List of Figures ... 14
List of Boxes ... 16
Acronyms and Abbreviations ... 17
Chapter 1
Introduction to ecosystem services concepts and issues... 18
Chapter 2
Methodologies for assessing ecosystem services ... 33
2.1
The MA methodology ... 34
2.1.1 The process to develop the MA framework ... 34
2.1.2 The information and tools supporting the MA framework ... 37
2.2
Other methodologies and schools of thought ... 46
Chapter 3
The research design ... 61
3.1
Three Lines of Enquiry ... 64
3.1.1 Line of Enquiry 1: the process to develop a framework ... 65
3.1.2 Line of Enquiry 2: the information to support a framework ... 68
3.1.3 Line of Enquiry 3: the tools to support a framework ... 72
3.2
Three pronged research approach ... 75
3.2.1 Document review ... 76
3.2.2 Applied research ... 80
8
3.2.3 Multiple case study analysis ... 85
3.2.3.1
US, Ecosystem Services Research Program ... 90
3.2.3.2
UK, National Ecosystem Assessment ... 94
3.3
Synthesis across Lines of Enquiry, case studies and research
approaches ... 97
Chapter 4
The SEQ Experience ... 104
4.1
The process to develop the SEQ framework ... 105
4.1.1 Factors underpinning the programs initiation ... 105
4.1.2 The coordinating organisation ... 106
4.1.3 The resources invested ... 107
4.1.4 The structure of the program ... 109
4.2
Information supporting the SEQ framework ... 113
4.2.1 The role of biodiversity ... 114
4.2.2 Assessment units ... 116
4.2.3 Ecological processes ... 117
4.2.4 Ecosystem services ... 118
4.2.5 Determining the value of ecosystem services ... 119
4.3
Tools supporting the SEQ framework ... 121
4.3.1 Conceptual framework ... 121
4.3.2 Scenarios ... 123
4.3.3 Maps and dynamic models ... 123
4.3.3.1
Ecosystem Reporting Category maps ... 124
4.3.3.2
Ecosystem function maps ... 125
4.3.3.3
Matrix models ... 127
4.3.4 Reports and websites ... 129
4.3.4.1
Journal articles and reports ... 129
4.4
Synopsis of the SEQ methodology ... 131
Chapter 5
The US Ecosystem Services Research Program ... 140
5.1
The process to develop the US framework ... 141
5.1.1 The programs initiation ... 141
5.1.2 The coordinating organisation ... 143
5.1.3 The resources invested ... 144
5.1.4 The structure of the program ... 146
5.2
Information supporting the US framework ... 152
5.2.1 The role of biodiversity ... 153
5.2.2 Assessment units ... 155
5.2.2.1
Ecosystems ... 155
5.2.2.2
Environmental classes ... 156
5.2.3 Ecological processes ... 157
5.2.4 Ecosystem services ... 158
5.2.5 Determining the value of ecosystem services ... 160
5.3
Tools supporting the US framework ... 163
5.3.1 Conceptual framework ... 164
5.3.2 Scenarios ... 165
5.3.3 Maps and dynamic models ... 166
5.3.3.1
National Atlas of Ecosystem Services ... 166
5.3.3.2
Dynamic models ... 167
5.3.4 Reports and websites ... 170
5.3.4.1
Journal articles and reports ... 170
5.3.4.2
Websites ... 170
5.4
Reflections on the program ... 171
5.5
Synopsis of the US methodology ... 174
10
6.1
The process to develop the UK framework ... 190
6.1.1 Factors underpinning the programs initiation ... 190
6.1.2 The coordinating organisation ... 191
6.1.3 The resources invested ... 194
6.1.4 The structure of the program ... 195
6.2
Information supporting the UK framework ... 198
6.2.1 The role of biodiversity ... 199
6.2.2 Assessment units ... 203
6.2.3 Ecological processes ... 203
6.2.4 Ecosystem services ... 204
6.2.5 Determining the value of ecosystem services ... 206
6.3
Tools supporting the UK framework ... 209
6.3.1 Conceptual framework ... 209
6.3.2 Scenarios ... 211
6.3.3 Maps and dynamic models ... 213
6.3.4 Reports and websites ... 214
6.3.4.1
The Technical Report ... 215
6.3.4.2
Synthesis of Key Findings ... 215
6.3.4.3
Website... 215
6.4
Reflections on the program ... 216
6.5
Synopsis of the UK methodology ... 222
Chapter 7
Findings and Recommendations for developing a
methodology ... 236
7.1
Process: Findings and Recommendations ... 238
7.1.1 Factors underpinning the initiation of programs ... 239
7.1.2 The coordinating organisations ... 241
7.1.3 The resources invested ... 246
7.2
Information: Findings and Recommendations ... 260
7.2.1 The role of biodiversity ... 260
7.2.2 Assessment units ... 265
7.2.3 Ecological processes ... 270
7.2.4 Ecosystem services ... 275
7.2.5 Determining the value of ecosystem services ... 282
7.3
Tools: Findings and Recommendations ... 288
7.3.1 Conceptual frameworks ... 288
7.3.2 Scenarios ... 293
7.3.3 Maps and dynamic models ... 295
7.3.4 Websites and technical reports ... 303
7.4
Focus on a multi-scale methodology ... 307
Chapter 8
Conclusion ... 311
8.1
Synthesis of empirical findings as answers to research questions .. 312
8.1.1 What is an appropriate process to develop a framework for ecosystem services assessments across multiple scales? ... 313
8.1.2 What information is required to support a framework for ecosystem services assessments across multiple scales? ... 315
8.1.3 What tools are required to support a framework for ecosystem services assessments across multiple scales? ... 317
8.2
Contributions to research ... 321
8.3
Strengths and limitations of the research ... 323
8.4
Future Research ... 326
12
List of Appendices
Appendix 1: Key features of the process applied to develop the MA, SEQ, US and UK frameworks.* ... 344 Appendix 2: Questions guiding the semi-formal, semi-structured interviews with US
and UK Leads. Questions are related to the three Lines of Enquiry, as well, interviewees were asked to reflect back on their program. ... 346 Appendix 3: The tertiary qualifications held by the Project Manager for the SEQ
program, and the 13 US and 17 UK Leads interviewed; and the number of Leads holding each qualification in each program. ... 351 Appendix 4: The structure of the MA, SEQ, US and UK programs in terms of who was
engaged and the roles they played in the development of the framework. ... 352 Appendix 5: The role of biodiversity in ecosystem services assessments as described by
Leads in the US and UK programs. Responses from US Leads are numbered 1 to 9. Responses from UK Leads are numbered 1 - 17. ... 355 Appendix 6: Assessment units in the MA (global), SEQ (regional), US (national) and
UK (multi-national) frameworks. ... 364 Appendix 7: The supporting services, ecosystem functions, ecological processes and
intermediate services included in the MA, SEQ and UK frameworks. ... 366 Appendix 8: The ecosystem services, final ecosystem goods and services (FEGS) and
final ecosystem services (FES) listed in the MA, SEQ, US and UK frameworks. ... 367 Appendix 9: The full set of Recommendations for determining an appropriate
List of Tables
Table 3.1: Key documents developed under the MA, SEQ, US and UK programs that provided data for this research. ... 77 Table 4.1: Major activities undertaken to develop the SEQ framework including the
14
List of Figures
Figure 1.1: The ecosystem services concept from which the MA framework builds on (extracted from MA 2005a, p. vi). ... 22 Figure 2.1: The MA’s nested multi-scale design (reproduced from MA 2005d, p. 31).
... 36 Figure 2.2: The conceptual framework underpinning the MA methodology (extracted from MA 2005a, p. 37). ... 41 Figure 2.3: The TEEB conceptual framework linking ecosystems and human well-being
(TEEB 2010, p. 21) ... 48 Figure 2.4: The conceptual framework underpinning CICES (extracted from
Haines-Young and Potschin 2010a, p. 7). ... 53 Figure 3.1: The research design. The three Lines of Enquiry (LoE) into methodologies
are highlighted as blue, orange and green circles. Black arrows represent
interactions across LoE. The three pronged approach is highlighted as follows: the three ways document reviews input to this research are in dark grey (Chapters 1 and 2); the applied research in the SEQ region is in medium grey (Chapter 4); and the multiple case study analysis into the US national and UK multi-national programs is in light grey (Chapters 5 and 6). ... 63 Figure 3.2: The SEQ region in relation to the main states and territories in Australia
(extracted from Maynard et al. 2012, p. 2). ... 83 Figure 3.3: Political map of the US showing states and counties (Maps of World 2012a).
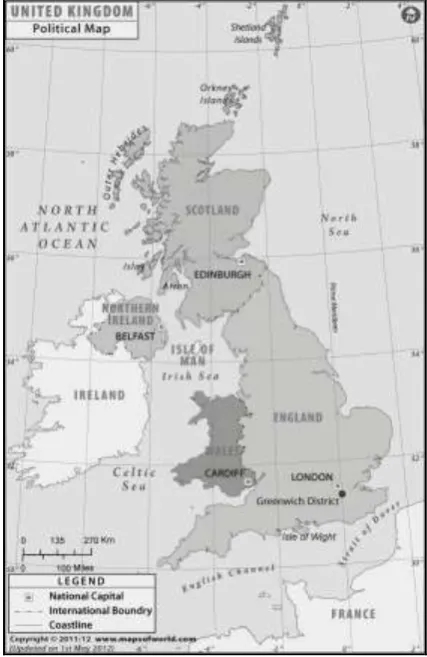
... 91 Figure 3.4: Map of the UK and its four constituent countries (England, Wales, North
Ireland and Scotland) and national capitals (London, Cardiff, Belfast and
Edinburgh) (Maps of World 2012b). ... 94 Figure 3.5: The cross-analysis of methodologies through the three Lines of Enquiry.
... 100 Figure 4.1: The four Components for Assessment developed into a conceptual
framework to support the SEQ framework (amended from Maynard et al. 2010; SEQ Catchments 2012). ... 122 Figure 4.2: Map of the SEQ region showing the location of all 32 ERCs in the SEQ
framework. ... 124 Figure 4.3: Map of the SEQ region showing areas of low to high ecosystem function.
tools to support the framework. Biodiversity is highlighted in dark grey (adapted from Maynard et al. 2010, p. 12). ... 132 Figure 5.1: The ESRP organisational matrix showing the five Long Term Goals (LTGs)
(extracted from EPA 2008, p. 16). ... 148 Figure 5.2: Key features of the US national scale methodology. From left to right the
figure shows - Line of Enquiry 1: the process to develop the framework; Line of Enquiry 2: the information to support the framework; and Line of Enquiry 3: the tools to support the framework. ... 176 Figure 6.1: Components of value in the UK framework - the ecosystem processes
contributing to final ecosystem service provision which provide goods to people. Two kinds of individual well-being values are recognised (economic and health). Also recognised are shared well-being values (social values) (extracted from the UK NEA 2011b, p. 21). ... 207 Figure 6.2: The UK NEA conceptual framework showing links between ecosystems,
ecosystem services, goods(s), human well-being and social feedbacks leading to drivers of change in ecosystems and their services (extracted from the UK NEA 2011a, p. 15). ... 210 Figure 6.3: Key features of the UK multi-national scale methodology. From left to right
16
List of Boxes
Box 2.1: Assessment units applied in the MA (2005a, p. 53) at the global scale. ... 38 Box 7.1: Recommendations on the process for developing a multi-scale framework
based on factors underpinning programs. ... 241 Box 7.2: Recommendations on the organisation to coordinate the development a multi-scale framework. ... 245 Box 7.3: Recommendations on the resources required to develop a multi-scale
framework. ... 249 Box 7.4: Recommendations on the structure of a program to develop a multi-scale
framework. ... 258 Box 7.5: Recommendations on biodiversity to support a multi-scale framework. ... 265 Box 7.6: Recommendations on assessment units to support a multi-scale framework.
... 270 Box 7.7: Recommendations on ecological processes to support a multi-scale framework.
... 274 Box 7.8: Recommendations on ecosystem services to support a multi-scale framework. ... 281 Box 7.9: Recommendations on valuing ecosystem services to support a multi-scale
framework. ... 286 Box 7.10: Recommendations on conceptual frameworks to support a multi-scale
framework.
... Erro r! Bookmark not defined.
Box 7.11: Recommendations on scenarios to support a multi-scale framework. ... 295 Box 7.12: Recommendations on maps and dynamic models to support a multi-scale
framework. ... 302 Box 7.13: Recommendations on websites and reports to support a multi-scale
Acronyms and Abbreviations
CBD Convention on Biological Diversity
CICES Common International Classification of Ecosystem Services CSIRO Commonwealth Scientific and Industrial Research Organisation COWB Constituents of Well-being
DEFRA Department for Environment, Food and Rural Affairs DPSIR Drivers, Pressures, State, Impact, Response
EMAP Ecological Monitoring and Assessment Program EPA Environmental Protection Agency
ERC Ecosystem Reporting Category
ES Ecosystem services
ESRP Ecosystem Services Research Program ESRC Economic and Social Research Council ESSG Ecosystem Services Steering Group ESWG Ecosystem Services Working Group
EU European Union
FEGS Final ecosystem goods and services FES Final ecosystem services
GIS Geographic Information Systems HHWB Human Health and Well-being HUCS Hydrologic Unit Codes
IPBES Intergovernmental Science-Policy Platform on Biodiversity and Ecosystem Services
IPCC Intergovernmental Panel on Climate Change IUCN International Union for the Conservation of Nature
LoE Line of Enquiry
LWEC Living with Environmental Change MA Millennium Ecosystem Assessment
MYP Multi-Year Plan
NERC Natural Environment Research Council NRM Natural Resource Management
NSESD National Strategy for Ecological Sustainable Development ORD Office of Research and Development
PCAST The President’s Council of Advisors on Science and Technology RLOSAC Regional Landscape and Open Space Advisory Committee SEEA System of Environmental-Economic Accounts
SEQ South East Queensland
SEQC SEQ Catchments Ltd
SNA System of National Accounts
TEEB The Economics of Ecosystems and Biodiversity
UK United Kingdom
UK NEA United Kingdom National Ecosystem Assessment
UN United Nations
UNCCD United Nations Convention to Combat Desertification UNEP United Nations Environment Program
UNEP-WCMC United Nations Environment Program - World Conservation Monitoring Centre
UNSD United Nations Statistical Division
18
Chapter 1
Introduction to ecosystem services concepts and
issues
The current rate of biodiversity loss and ecosystem degradation resulting from
anthropocentric activities far exceeds that ever recorded in the history of the Earth (MA 2005a; Layke 2009; Butchart et al. 2010; Worldwatch Institute 2012). Population growth, associated resource consumption and land conversion are placing significant pressures on the capacity of ecosystems to continue to support biodiversity and provide the life-supporting ‘goods’ and ‘services' on which human well-being depends (e.g. clean air and water, regulating climate, providing food and timber, generating a sense of place - to name a few) (Costanza et al. 1997; MA 2005a; WRI 2007; DEWHA 2009). These contributions from ecosystems that positively influence human well-being are commonly and collectively referred to as ‘ecosystem services’ (Costanza et al.1997; de Groot et al. 2002; MA 2005a; Daily and Matson 2008; Fisher et al. 2009; Maynard et al. 2010).
All people on Earth are beneficiaries of ecosystem services and therefore stakeholders to their provision. We all receive goods and services and impact on their provision in different ways, at different rates, in different magnitudes and at different (temporal and spatial) scales. But people often take them for granted, or are unaware they are even receiving them (MA 2005a). Even when aware, however, the limited understanding of ecosystem services concepts and tools by these stakeholders; and how to implement these concepts and tools in their decision making; has limited the concept’s application as a proactive tool to natural resource management (NRM) (Daily et al. 2009; Maynard et al. 2010, 2012). For too long (particularly in highly developed nations) ecosystem services have gone unidentified, unrecorded and therefore undervalued (Daily et al. 2009; Maynard et al. 2010). Many natural resources are finite, once these goods and services have been lost they can be prohibitively expensive to replace, if replaceable at all (MA 2005a; Maynard et al. 2010, 2012).
policies and programs to sustainably manage their provision is complex and problematic (Cork 2002a; MA 2005a; WRI 2007; Australia21 2012). Conducting multi-scale
assessments would allow for the environmental, social and economic costs and benefits of natural resource degradation and management to be incorporated into relevant policies and programs; and transparent links between national economic systems, markets, state and local government planning, resource use and protection, conservation policies and programs, investments and incentives, and on-ground property
management and planning. The Millennium Ecosystem Assessment (MA) supports the conducting of multi-scale assessments stating (MA 2005a, p. 8):
A full assessment of the interactions between people and ecosystems
requires a multi-scale approach because it better reflects the multi-scale
nature of decision-making, allows the examination of driving forces that
may be exogenous to particular regions, and provides a means of examining
the differential impact of ecosystem changes and policy responses on
different regions and groups within regions.
This PhD research is premised on the notion that to manage natural resources sustainably we need to mainstream ecosystem services into stakeholder decision making; and to mainstream ecosystem services into decision making a ‘framework’ is required that enables stakeholders to conduct ecosystem services assessments. By providing information, guidelines and tools for stakeholders (users) to work with, a framework provides a basic structure to solve or address complex issues (MA 2005a; Reid et al. 2006a; WRI 2007; Nahlik et al. 2012). The consistent application of a coherent framework would enable practitioners and decision makers to monitor and evaluate ecosystem service provision over long time frames, set targets, clearly state objectives, communicate findings and coordinate actions. The MA (2005a, p. 34) describes an ecosystem services framework as:
... a logical structure for evaluating the system, ensures the essential
components of the system are addressed as well as the relationships among those components … and highlights important assumptions and gaps in
20
The multi-stakeholder and multi-scale nature of ecosystem services suggests that to sustainably manage for ecosystem service provision it is not sufficient to develop a framework for single scale applications (e.g. an ecosystem, a catchment, region or nation), or for a specific sector or organisation to apply (e.g. catchment management organisation, utility agency, government). A multi-scale framework (rather than single-scale framework) would allow for nested, interlinked, but semi-independent
assessments to be conducted at various scales and levels of organisation (MA 2005d; Reid et al. 2006a; Ash et al. 2010). To develop a multi-scale framework the following research question must be answered: what is an appropriate methodology to enable ecosystem services assessments across multiple scales? A methodology is defined in this thesis as: a framework that consists of information and decision support tools
(tools) suitable for ecosystem services assessments; and the process (the series of actions) applied to develop the framework as well.
Globally the most notable and applied of all methodologies is the one supporting the MA (Nahlik et al. 2012). Coordinated by the United Nations Environment Program (UNEP) and developed by over 1300 of the world’s leading natural and social scientists, the MA (2005d, p. x) states one of its intents is to be used ‘as a framework and source of tools for assessment, planning and management’. Since its release in 2005 the MA framework has been adopted inter alia by the World Resource Institute in their Action Agenda (WRI 2007); the World Business Council for Sustainable Development in developing business solutions (WBCSD 2011, 2012); the Ramsar Convention in the Changwon Declaration on human well-being and wetlands (Secretariat Ramsar 2008); and strategies supporting missions of the Convention on Biological Diversity (CBD) and the Intergovernmental Panel on Climate Change (IPCC) (to name a few) (Fischlin et al. 2007; CBD 2013).
their processes are ‘highly differentiated in space and time’ (MA 2005d, p. 31); and because ‘causes, impacts and responses to ecosystem change vary at different scales’ (Reid et al. 2006a, p. 6). The MA (2005d, p. 10) states that ‘full multi-scale assessments provide a powerful basis for evaluating the robustness and persistence of [assessment] findings across scales’; and the process of developing the framework and conducting assessments built stakeholder capacity to apply ecosystem services concepts.
Since the MA’s release there has been exponential growth globally in ecosystem services research and framework development (Fisher et al. 2011; Costanza and
Kubiszewski 2012). Chapter 2 provides a review of other methodologies and schools of thought on ecosystem services and assessments since the MA’s release. It shows some methodologies have been developed for small scale assessments (e.g. soil management); some for specific decision making contexts (e.g. national environmental-economic accounting); and others have been developed for use in multiple decision making
contexts (e.g. land-use and NRM planning). Regardless of the purpose or scale however, since 2005 ecosystem services programs aimed at developing a framework for
assessment, planning and management have either adopted or adapted the MA
methodology, or developed a completely new methodology with no resemblance to the MA at all.
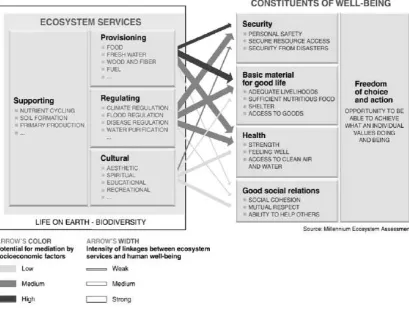
In this research, the 2005 release of the MA methodology is used as a benchmark to describe more recent schools of thought underpinning processes, information and tools (methodologies) for ecosystem services assessments and the drivers of similarities and differences across them. Figure 1.1 presents the MA’s schematic of the ecosystem services concept which is the most well-known of all ecosystem service conceptual diagrams developed to date. The overall framework developed under the MA builds on and guides the expansion of the ecosystem services concept; it develops the concept into something more detailed and useful for stakeholders (e.g. business, industry,
22
Figure 1.1: The ecosystem services concept from which the MA framework builds on
(extracted from MA 2005a, p. vi).
On the left of the MA schematic, four categories of ecosystem services (Supporting, Provisioning, Regulating and Cultural) and examples of goods and services under each category are provided (these are discussed further in Chapter 2). Biodiversity is shown as underpinning the provision of ecosystem services important to human well-being by the box encompassing them. On the right hand side are five categories of Constituents of Well-being (COWB) (Security, Basic Materials for Good Life, Health, Good Social Relations and Freedom of Choice and Action), and examples of the various constituents under each category (also discussed further in Chapter 2). Arrows between categories of ecosystem services and COWB show the intensity of linkages between the two and the potential for mediation by socio-economic factors such as markets, education, and having access and transportation to areas providing services. According to Cork (2002b, p. 8):
… the concept of ecosystem services attempts to place the relationship
[image:22.595.65.475.68.379.2]face in our everyday relationships with businesses, government and
voluntary organisations ... the ecosystem services approach treats the
service-based relationship between humans and the natural environment as the starting point for planning of all … economic activity, and focuses on
collecting the information necessary for the full range of ecosystem services
to be considered.
This human-centric focus on nature has been the main criticism of an 'ecosystem services approach' to managing natural resources (Hansen 2011). Many argue the intrinsic value of biodiversity will be lost through attempts to value biodiversity for ‘our’ own sake rather than for that of ‘its’ own; that nature is too important to be valued; and that nature cannot be reduced to a financial commodity (MA 2005a; McCauley 2006; Simpson 2011; Ingham et al. 2012). Certainly, the value people place on biodiversity is evident in traditional methods of nature conservation which generally have focused on the protection of rare, endangered and threatened species or ecosystems (Ingham et al. 2012; Pittock et al. 2012; IUCN 2015). This research does not delve into the pros and cons of each approach (biodiversity or ecosystem services) nor does it suggest these approaches are mutually exclusive. The benefits of each approach have already been argued in academic literature (Ingham et al. 2012) as well as in colourful popular press by George Monbiot and Tony Jupiter in the Guardian (Juniper 2012; Monbiot 2012) and Richard Conniff in Yale Environment 360 (Conniff 2012).
24
Slowly, attention has turned from global scale programs developing ecosystem services frameworks and conducting assessments to (multi)national scale initiatives. In
recognition of the importance of ecosystem services to sustaining national economies and the limited ability to account for these goods and services in traditional accounting methods (e.g. the System of National Accounts), the UN Statistical Division (UNSD 2012) has used ecosystem services as the framework for the revision of the System of Environmental-Economic Accounts (SEEA). In parallel, the World Bank coordinates the Wealth Accounting and the Valuation of Ecosystem Services (WAVES 2014) partnership that aims ‘to promote sustainable development by ensuring natural resources are mainstreamed in development planning and national economic accounts’. There are numerous case studies showing the contribution of ecosystem services to national job growth, for example, Ecuadorian job growth since the protection placed on the Galapagos Islands archipelago and the expansion of the eco-tourism and recreational sectors (Environmental Systems Research Institute 2011). National scale ecosystem services programs and assessments have been initiated in the United States (EPA 2008), England (Haines-Young and Potschin 2008), Switzerland and Austria (Otts and Staub 2009; Staub et al. 2011), the UK (UK NEA 2011b), and New Zealand (Townsend and Thrush 2012), to name a few.
There is hope in the fact that the release of these global and (multi)national scale programs and assesments has often followed with legislation mandating the development of assessment tools and including ecosystem services into decision making. For example, within only a few months of the release of the United Kingdom National Ecosystem Assessment (UK NEA) the British Government released a White Paper stating their commitment to a ‘green economy’ and ‘safeguarding the
environment for the benefit of future generations’ (UK Government 2011, p. 2). As well, in order to halt the loss of biodiversity and ecosystem services and meet
obligations under the CBD, the European Union’s Biodiversity Strategy to 2020 (EU 2013, p. 7) calls upon Member States to:
Map and assess the state of ecosystems and their services in their national
territory by 2014, assess the economic value of such services, and promote
the integration of these values into accounting and reporting systems at EU
The most recent landmark moment for ecosystem services occurred on the 7th October 2015, when the Obama Administration released Memorandum M-16-01 providing ‘direction to agencies on incorporating ecosystem services into Federal planning and decision making’ (Executive Office of the President of the United States 2015, p. 1). The Memorandum refers to two key messages from a report developed by the United States President’s Council of Advisors on Science and Technology (PCAST 2011, p. 7):
First, the economic and environmental dimensions of societal well-being
are both indispensable, as well as tightly intertwined. Second, … the
government … must not fail to address the threats to both the environmental
and the economic aspects of well-being that derive from the accelerating
degradation of the environmental capital - the Nation’s ecosystems and the
biodiversity they contain - from which flow “ecosystem services”
underpinning much economic activity as well as public health, safety, and
environmental quality.
Although by nature a multi-scale framework would allow ecosystem services
assessments to be conducted at different scales (e.g. local, regional and catchment) and for different purposes (e.g. land-use planning, accounting, State of Environment reporting, Multi-lateral Environmental Agreements), this research responds to the research question from the position of developing a multi-scale framework at the national scale (e.g. for Australia) (WRI 2007, p. 35). Outcomes of assessments would inform ‘national implications [of changes in ecosystem services] and the potential decisions that might be taken nationally’ (Reid et al. 2006a, p. 8). Based on lessons learnt from the MA, the WRI (2007, p. 35) contextualises the role of national
institutions and policies in sustainably managing for ecosystem services provision; and the importance of coordinated institutions and coherent policy making across multi-scales:
The Assessment [i.e. the MA] points to the importance of ensuring policy coherence … international conventions must be coherent with national
policies and these in turn must be coherent with local policies. National
institutions are often the pivot between local or regional institutions and
26
It is thought the findings developed through this research will have applicability to all nations (and other geo-jurisdictional areas) grappling with how to develop information and tools for ecosystem services assessments. However, the three programs analysed in this research were coordinated in highly developed nations and some findings may be less relevant to those in less developed nations. Although not often required, when ‘context’ is required to provide an example or better communicate an issue, Australia is used because it is my home nation. Using Australia to highlight key findings is also useful as at the core of Australia’s National Strategy for Ecological Sustainable Development (NSESD) is the concept of ecosystem services (Australian Government 2013a); and due to Australia’s recent commitment to contribute to achieving the global Sustainable Development Goals (UN 2015).
Australia’s NSESD aims to protect biodiversity and maintain ecological processes so to enhance individual and community well-being for current and future generations (Australian Government 2013a). Other key documents across the environment and agricultural portfolios of the Australian Government and States of Australia contain the words ‘ecosystem services’ (Cork 2002b), including national and state biodiversity strategies and various State of Region and Environment reports (Australian Government 2008, 2012; Queensland Government 2008; DEWHA 2009). Chapter 2 introduces a few of the local to regional scale programs in Australia using ecosystem services as an approach to improve NRM. A review paper developed by Graymore (2006) identified a wide variety of other institutional contexts in which policy and management decisions are made involving natural resources and ecosystem services in Australia. The list below includes Graymore’s (2006, p. 10) list (in italics), and then builds on these examples (non-italics):
Global scale initiatives such as control of greenhouse gas emissions
Management of special areas of international and national significance, including Multilateral Environmental Agreements and Conventions (e.g. World Heritage Areas, Ramsar sites, IPBES, CBD)
Formulation and implementation of state policies and regulations for specific
ecosystems, environments or key issues (e.g. biodiversity, wetlands, native vegetation, water quality, air quality, waste management)
Regional strategic plans
Dedication and management of conservation areas
Local environmental plans
Development control plans
Integrated catchment management
Environmental protection policies, programs and projects
Environmental and social impact assessments
Development approval processes
Incentive systems for environmental protection and/or enhancement
Business and industry sustainability and reporting
Social and community planning
Eco-labelling and consumer awareness programs
National environmental-economic accounting
Cork (2002a) and Australia21 (2012) suggest the concept of ecosystem services
provides an integrative mechanism to assess and communicate the environmental, social and economic dimensions of NRM, and a tool to guide integrated policies and programs in these areas. The Australian Government (2013a) states the development of the
NSESD demonstrates their belief that a coordinated approach to sustainable
development is required. A coordinated approach is required because of ‘the need to look at management of Australia's ecological and economic resources on a regional, national and international basis, and the significance of potential threats to our
environment and economy if we do not take action’ (Australian Government 2013a). To date however, information has not been identified, collated, adopted or developed to systematically and consistently incorporate ecosystem services into any of these programs (Australia21 2012).
28
services in Australia such as: the disempowerment of voluntary and regional NRM institutions by changing ‘mandates, form and funding’; intergovernmental agreements lacking incentives for implementation and penalties for non-compliance; and an ongoing ecological debate that sees biodiversity and socio-economic benefits as separate issues.
It is now clear the ‘business-as-usual approach’ to NRM is unsustainable (WCED 1987; Balmford and Bond 2005; MA 2005a; Djoghlaf 2010; TEEB 2010). In the opening address of the 10th Conference of the Parties to the CBD, Executive Secretary Ahmed Djoghlaf (2010) asked us to apologise to our children for our failure to meet the agreed 2010 targets and reduce the loss of biodiversity. As represented by the box
encompassing ecosystem services in Figure 1.1 the MA recognises biodiversity as underpinning the functioning of ecosystems and therefore the provision of ecosystem services. If current trends of biodiversity loss and ecosystem degradation are to be reversed we need to rapidly advance information and tools to forecast and quantify ecosystem service provision; and priority must be given to mainstreaming ecosystem services into all sectors of decision making (MA 2005a; WRI 2007; Cowling et al. 2008; Daily and Matson 2008; Daily et al. 2009; Layke 2009; Maynard et al. 2010).
Across the globe much has been achieved in terms of defining and classifying (Daily 1997; de Groot et al. 2002; MA 2005a; Boyd and Banzhaf 2007; Wallace 2007; Fisher and Turner 2008; Fisher et al. 2009), measuring (Chan et al. 2006; Layke 2009; Fisher et al. 2011; Ausseil et al. 2013) and valuing ecosystem services (Costanza et al. 1997, 2014; Farbier et al. 2002; Raymond et al. 2009; Morrison and Hatton-MacDonald 2010; TEEB 2010; Bateman et al. 2013). The MA is but one, without doubt the most
prominent, of all ecosystem services frameworks currently available. Chapter 2 reviews the MA methodology and other schools of thought developed since its release providing the current state of knowledge on information and tools that allow for the identifying, measuring and valuing of ecosystem services. Despite all this endorsement and research, however, there is still an ongoing challenge (in Australia and elsewhere) to conduct and demonstrate ecosystem services assessments.
cultures, to address specific issues, and for application at different scales and by different users. As Chapter 2 shows, there exists no systematic or agreed framework from which to consistently assess ecosystem services across sites, ecosystems, catchments, a region, state or nation. A lack of analysis of existing initiatives, particularly the drivers underpinning the choice of process applied to develop the frameworks and why the information and decision support tools differ across these frameworks, hinders the potential for researchers and decision makers to make informed decisions on an appropriate framework to adopt or how to develop a more relevant one (MA 2005a; Brunckhorst et al. 2006; Cowling et al. 2008).
Through document and literature reviews, applied research and multiple case study analysis this research identifies key drivers (e.g. scientific, political, historical, scalar) that have provided constraints, or that have led to explicit or implicit choices, that determined the type of process applied to develop a framework and the information and tools to support it. In this research, determining the basis from which the constraints and choices were made have informed a set of Recommendations from which researchers can use to determine an appropriate new methodology to develop; or these
Recommendations can be considered when assessing the potential to adopt or adapt an existing methodology; or researchers can use these Recommendations to assess the appropriateness of a methodology already developed and that they currently use.
The central question to this research is: what is an appropriate methodology to enable ecosystem services assessments across multiple scales? Hence it is important to identify what issues or topics this research does ‘not’ address. As previously discussed, this research does not debate the differences between biodiversity and ecosystem services approaches. The focus is greater on geographic, jurisdictional and spatial scales of framework development and application and does not discuss temporal scales of ecosystem service provision. This research analyses methodologies at the scale of program development (e.g. regional, national); projects or specific studies conducted within these programs are beyond the scope of this research. As well, time and budget only allowed case studies to be analysed up until the date of this research, hence any follow-up and second stages of these programs is outside the scope of this research. Finally, the actual application of the information and decision support tools
30
due to time and financial resources, but also because they have already been comprehensively discussed by other researchers.
Chapter 3 provides the research approach to answering this question. To break the research into more tractable components the analysis of existing methodologies and schools of thought was undertaken using three Lines of Enquiry. The first Line of Enquiry focuses on the process (the series of actions) applied in programs to develop a framework for ecosystem services assessments. This includes identifying factors underpinning the initiation of programs; the role of government and stakeholders in the development of frameworks; the resources required to develop a framework; and how programs were structured. The second and third Lines of Enquiry focus on the
information (i.e. biodiversity, ecological processes, ecosystem services, valuing ecosystem services) and decision support tools (i.e. conceptual frameworks, scenarios, maps, dynamic models, websites and reports) supporting different frameworks.
Chapter 3 also provides the rationale for adopting a three pronged research approach and it describes each approach. It begins by discussing the first approach, document and literature reviews. Unlike many other PhD theses, in this thesis the document review is primarily provided in Chapters 1 (Introduction to ecosystem services concepts and issues) and 2 (Methodologies for assessing ecosystem services), rather than after the chapter describing the research design. This order was preferable as outcomes of the document review were used to design the research and provide direction by identifying sub-questions and topics requiring further analysis under each Line of Enquiry. These three Lines of Enquiry were used to analyse different methodologies and schools of thought through the three research approaches.
Documents and literature pertaining to the SEQ, US and UK programs are discussed extensively throughout their relevant chapters, extending the document review beyond these introductory chapters into the entire thesis. During the course of this research I (co-)authored a number of peer reviewed publications and developed a website
describing the SEQ methodology. Rather than include a separate table in this chapter, I refer you to Table 3.1 which lists these documents as primary SEQ literature used as data in this research. I also co-authored a publication on the ‘State of ecosystem services in Australia’ (Pittock et al. 2012) and this is used to provide context to this research. An Issue Paper I contributed to the UN SEEA is discussed in Section 2.2 and used
extensively in this research when describing ecosystem services frameworks at local to regional scales in Australia (Maynard and Cork 2011).
This triangulated approach to research (document and literature reviews, applied
research and multiple case study analysis) provided a challenging experience insisting I play multiple roles throughout the research. To conduct document and literature reviews I performed the role of desktop analyst. As applied researcher and Project Manager for the SEQ Ecosystem Services Project I interacted with stakeholders to develop a real-world regional scale ecosystem services framework for NRM and planning. To better understand the reasoning behind the methodology adopted in SEQ, any intrinsic biases, and the potential to develop a methodology for use across multiple scales and purposes, I then acted as interviewer of Leads who were developing ecosystem services
frameworks for the whole of the US and UK.
Chapter 7 presents the key findings of this research providing comparisons and contrasts between the methodologies developed in SEQ, US and the UK. It describes the
32
Chapter 2
Methodologies for assessing ecosystem services
Chapter 1 discussed the concept of ecosystem services and provided an example, the schematic (Figure 1.1) developed in the MA to communicate ecosystem services to stakeholders (e.g. business, industry, community, government, non-government, Traditional Owners, researchers and communities). It described how the provision of ecosystem services are fundamental to the well-being of people and how these
relationships are diverse, complex and context dependent. Although contention exists between conservation approaches traditionally focused on biodiversity and those more anthropocentric of focus (i.e. ecosystem services), an ecosystem services approach is endorsed by many world leaders as an appropriate approach to sustainable development and the management of natural resources.
Chapter 1 also listed a wide variety of institutional contexts across a nation in which policy and management decisions are made involving natural resources. The WRI (2007) described the pivotal role that national institutions play in ensuring policy
coherence across scales of organisation, providing rationale for developing a multi-scale framework at the national scale. In order to develop this framework the following research question must be answered: what is an appropriate methodology to enable ecosystem services assessments across multiple scales? In this research a methodology consists of information and decision support tools (a framework) that would enable ecosystem services assessments to be conducted; as well as the process (the series of actions) to develop the framework.
34
The literature reviewed in Chapter 1 and this current chapter have informed the development of three Lines of Enquiry that are described in Chapter 3. Three methodologies developed in different countries (Australia, US and UK); at different scales (regional, national and multi-national); by different coordinating organisations (non-government and government); and with differing resources (budgets, number of employees, expertise) were analysed using the Lines of Enquiry (see outcomes in Chapters 4, 5 and 6). Different research approaches (i.e. document reviews, applied research and multiple-case study analysis) were applied to analyse the three
methodologies. Background to these case studies and the different research approaches are also provided in Chapter 3. To set the benchmark from which recent methodologies have been developed and the case studies are analysed, the MA methodology is
described below.
2.1 The MA methodology
The MA’s unique approach to developing a framework and conducting assessments is particularly relevant to this research which does not aim to determine an appropriate methodology for single scale or sector specific assessments, but a methodology that enables assessments to be conducted by multiple stakeholders across multiple scales.
Section 2.1.1 describes the process applied to develop the MA framework. Section 2.1.2 describes the information and tools developed to support it.
2.1.1 The process to develop the MA framework
The MA was called for by the UN Secretary-General in 2000 in response to the Parties signatory to the four major global ecosystem-related conventions: the CBD; the
The MA was coordinated by the UN in which close to 200 nations are signatory (UN 2014b)*. Specifically, it was coordinated by the UNEP who is ‘the voice for the environment within the UN system’ and the ‘world's foremost intergovernmental environmental organisation’ (UNEP 2013). It was governed by a 15 person multi-stakeholder Assessment Panel and Board with representatives from ‘international organisations, governments, business, non-government organisations and indigenous people’ (Reid et al. 2006a, p. 3). A Secretariat with offices in Europe, North America, Asia and Africa supported the program which ran for a four year period (MA 2005a). The program cost approximately US$24 million, plus more than US$7 million of in-kind support (MA 2005b). Funders of this global scale program were mostly non-government international organisations. Funding was mostly provided by national governments for sub-global assessments.
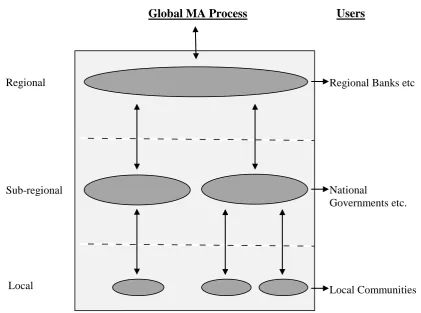
Figure 2.1 highlights the multi-scale process and examples of users of the framework (information and tools) at three different scales: regional, sub-regional and local. As previously mentioned, the framework development and assessment process was coordinated by UNEP at the global scale (‘Global MA Process’). Outcomes of the application of the framework aimed to meet the needs of decision makers from the four major ecosystem-related conventions. The intended application of the framework and the audience for assessment outcomes was broad however; it extended across countries, disciplines and users hence the breadth of experts and decision makers participating in the MA process.
The multi-scale design of the MA framework enabled nested ecosystem services assessments to be conducted at different scales (MA 2005d). Many more scales, however, were identified and assessed in the MA beyond just the three presented. Reid et al. (2006a) and Ash et al. (2010) explain that to facilitate better decision making at all scales 34 local, watershed, regional and national scale assessments (called ‘sub-global assessments’) were included as core project components. Note, the terminology applied (i.e. regional, sub-regional and local) are arbitrary terms and spatial scales will be defined differently depending on cultures, countries, disciplines etc. Of importance is the ability to nest different scale assessments so findings feed both bottom-up and
36
down (double arrows) therefore contributing to more detailed, robust and complete findings (MA 2005d).
Figure 2.1: The MA’s nested multi-scale design (reproduced from MA 2005d, p. 31).
Sub-global assessments were not chosen to be representative samples of ecosystems, regions or nations (MA 2005d). Rather, they were chosen based on the interest and available resources of the proposed coordinating organisation(s) and designed to meet the needs of decision makers in these areas (Reid et al. 2006a; Ash et al. 2010). To meet minimum assessment standards and contribute to the global scale assessment all sub-global assessments were required to meet the following criteria (MA 2005d, p. 33):
use the MA conceptual framework;
user engagement; and
adherence to MA policies.
Sub-regional Regional
Local
Regional Banks etc
National
Governments etc.
Local Communities
[image:36.595.58.480.133.446.2]More than 1300 expert natural and social scientists working at different scales from 95 countries contributed to developing information and tools and conducting assessments under the MA. In the process of selecting experts due regard was given to geographic and gender balance and the inclusion of Indigenous and local knowledge. Experts were structured into four Working Groups: Condition and Trends, Scenarios, Policy
Responses and Multi-scale Assessments (MA 2005a, 2005b, 2005c, 2005d). Eighty Review Editors composed of government representatives and other experts oversaw the scientific review of reports (in two rounds) and ensured all comments (from
approximately 850 individuals) were appropriately addressed by the Authors (MA 2005a). The following section describes the information and tools supporting the MA framework developed through this process.
2.1.2 The information and tools supporting the MA framework
The generation of new primary knowledge was not an aim of the MA (2005a). The MA (2005b, 2005c, 2005d p. vii) aimed to ‘add value’ by ‘collating, evaluating,
summarising, interpreting and communicating’ existing scientific (including peer-reviewed literature, data sets, scenarios and models) and other knowledge systems (held by different sectors, practitioners, communities and Indigenous people) in a new form. The information underpinning the MA framework follows closely that developed by the CBD enabling the MA to better integrate with existing global environmental policies and programs, and policies and programs supporting them at different scales (e.g. national scale policies and programs of UN Member States) (MA 2005a).
‘Biodiversity’ is defined by the CBD (1992, p. 5) as: the variability among living organisms from all sources, terrestrial, marine and other aquatic ecosystems, and the
ecological complexes of which they are a part; this includes diversity within species,
between species and ecosystems. The MA (2005a, p. 62) recognises an ‘asymptotic relationship between biodiversity and ecosystem functioning’. Some species make unique contributions to ecosystem functioning important to the delivery of ecosystem services (MA 2005a). However, many species contribute to other ecosystem functions making species substitutable (MA 2005a). Of concern to ecosystem service provision is ‘the possibility of significant losses of function … as more species are lost and as redundancy is reduced’ (MA 2005a, p. 62). The importance of biodiversity in
38
‘The Ecosystem Approach’ underpinning the CBD aims to shift the focus of policy making and delivery away from siloed approaches to NRM (such as the conservation of air, water and soil) into more holistic or integrated approaches based on whole
ecosystems (SCBD 2004; MA 2005a). The Ecosystem Approach is built on 12
Principles, including Principle 5: the conservation of ecosystem structure and function in order to maintain ecosystem services (SCBD 2004). The MA therefore uses
‘ecosystems’ as the spatial unit for assessing ecosystem services using their framework. Article 2 of the CBD (1992, p. 5) defines an ecosystem as: a dynamic complex of plant, animal and microorganism communities and their non-living environment interacting
as a functional unit. The MA (2005a, p. 51) says ‘[eco]systems’ have ‘strong interactions among components of the system and weak interactions across its
boundaries; discontinuities of strong interactions become boundaries’. Although the size and location of ecosystems is highly important these features are secondary when conducting systems analysis (MA 2005a).
Box 2.1 presents 10 Reporting Categories, the units for assessing ecosystem services at the global scale using the MA (2005a) framework. Humans are recognised as an integral and often dominant part of these ecosystems (MA 2005a). As ‘ecosystem services’ are defined in the MA (2005a, p. 49) as the benefits people obtain from ecosystems, without people there are no actual ecosystem services. The MA (2005a, p. 53) states they use overlapping categories ‘because this better reflects real-world biological, social and
geophysical interactions, particularly at these relatively large scales’. For example (MA 2005a, p. 53):
Box 2.1: Assessment units applied in
the MA (2005a, p. 53) at the global scale.
At the global scale surrogate ‘ecosystems’, termed Reporting Categories, are the units used to assess ecosystem services using the MA framework. These ecosystems represent all ecosystems across the globe, they include: Marine, Coastal, Inland Water, Forest, Dryland, Mountain, Island, Polar, Cultivated and Urban. Each Reporting Category contains a number of more defined natural or human modified ecosystems better suited to the scale of sub-global assessments. The location and size of Reporting Categories was spatially defined by grouping more defined
ecosystems with similarities in ‘climatic conditions, geophysical condition, dominant use by humans, surface cover, species composition, resource
… it is helpful to analyse an area dominated by forest land cover as a single
ecosystem even if it contains some freshwater and agricultural areas within it,
rather than analysing the forest, agriculture, and freshwater ecosystems
separately, this allows for a more holistic analysis of these interactions.
Figure 1.1 presented the four categories of ecosystem services in the MA. Provisioning Services (i.e. the products obtained from ecosystems) such as food, timber and fibre are the most recognised of ecosystem services due to their economic contribution. They are predominately derived from highly modified and human dominated ecosystems and their value is generally represented in existing markets (therefore regularly measured and recorded). It is much harder to measure and determine the value of Regulating Services (i.e. the benefits obtained from the regulation of processes) and Cultural Services (i.e. the non-material benefits people obtain from ecosystems) as they are generally derived from landscape functions; there are no established markets; and their values are often highly dependent on people's location, perceptions, experiences, age, culture and education (MA 2005a). Supporting Services (i.e. ecosystem services necessary for the production of all other ecosystem services) do not directly provide benefits to people, but are those goods and services recognised as necessary for all other ecosystem services to be derived (MA 2005a).
Twenty-four ecosystem services are assessed under the Provisioning, Regulating and Cultural Categories and seven Supporting Services are also identified. These ecosystem services are derived, received, measured and valued by people in different ways (e.g. economically, culturally, individually, collectively) and at different scales (e.g. in-situ, catchment, regional, national or global; minutes, years, decades or centuries). Through these multiple interacting pathways we can see that humans influence ecosystems and in turn are influenced by changes in ecosystems (MA 2005a). The MA (2005a) and
Bennett et al. (2009) say the full range of ecosystems and ecosystem services need to be assessed to make ethical and informed decisions. Costanza et al. (2011, p. 2) states 'the full range of ecosystem services must be considered to prevent creating dysfunctional incentives and to maximise net benefits to society'
40
situation dependent state, comprising basic materials for a good life, freedom and
choice, health and bodily well-being, good social relations, security, peace of mind and
spiritual experience. For assessment purposes it describes five categories of
Constituents of Well-being (COWB): Security, Basic Materials for Good Life, Health, Good Social Relations and Freedom of Choice and Action. Figure 1.1 provides some examples of the various COWB under each category. These categories and constituent parts were based on outcomes of research conducted by Narayan (2000) who surveyed poor people from 23 countries asking them to discuss good and bad aspects of their life.
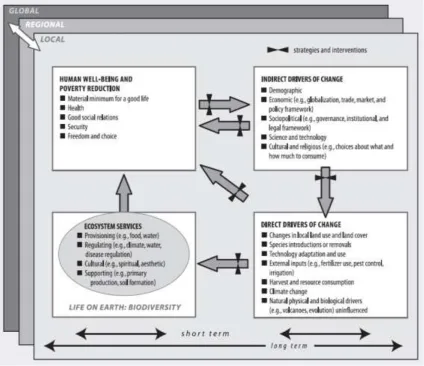
At the heart of the MA is its conceptual framework which builds on the schematic of the ecosystem services concept. The conceptual framework, presented as Figure 2.2, aims to guide the concept of ecosystem services (Figure 1.1) into a usable and consistent format that all researchers developing aspects of the framework could follow (MA 2005a). It aimed to provide consistency of approach to applying the MA framework and conducting assessments (e.g. sub-global assessments); and to help guide those reporting on assessment outcomes (MA 2005a; Ash et al. 2010). The conceptual framework provided a shared vision and language (terminology) across disciplines and stakeholder objectives allowing assessments at different scales to be interlinked and outcomes to feed both bottom-up and top-down. The MA (2005a, p. 34) says ‘given the complex interactions between ecosystems and human well-being a prerequisite for both analysis and action is agreement on a basic conceptual framework’.
Similar to Figure 1.1, the position of biodiversity in Figure 2.2 is again made clear by the box encompassing ecosystem services. 'Human Well-being and Poverty Reduction’ are indicated in the upper left hand box of the diagram so to emphasise the primary focus on these issues' (MA 2005a, p. 36). In Figure 2.2 the top right hand box identifies 'Indirect Drivers of Change’ in ecosystems (e.g. demographics, science and technology, cultural and religious values) which, as identified in the bottom right hand box,
'Directly’ drive changes in ecosystems (e.g. through land-use, species introductions, technology, external inputs, harvesting and extraction). At this level the conceptual framework is strongly related to the Drivers-Pressures-State-Impacts-Responses (DPSIR) framework applied internationally in environmental reporting and policy analyses (Ash et al. 2010; State of Environment Committee 2011).* The MA builds on
* Including the Australian Government’s State of Environment Report (State of Environment Committee
the DPSIR framework however by including feedback loops and assessments across multiple temporal and spatial scales (Ash et al. 2010).
Figure 2.2: The conceptual framework underpinning the MA methodology (extracted
from MA 2005a, p. 37).
The MA conceptual framework shows how resulting changes in ecosystems and therefore ecosystem services affect human well-being. These cross-scale interactions between people and the environment are highlighted at the regional, national and global scales; as well, in short and long term timeframes. Arrows indicate the causal
interactions among components of the framework and the general direction of the interactions (MA 2005a). Black cross bars indicate intervention points where the dynamics can be altered by people (MA 2005a).
[image:41.595.115.540.140.506.2]42
trends and trade-offs in ecosystem services at the global scale (MA 2005e, p. 40). The MA did not provide the data and information to stakeholders to conduct sub-global assessments. It recognised that across the globe the availability and reliability of data, and the applicability of methods to collect and develop the data, was variable across ecosystems, ecosystem services and assessment regions (MA 2005e). However, stakeholders at sub-global scales agreeing to the three criteria for sub-global
assessments (Section 2.1.1), and who collect and/or develop data and information to answer the questions described below, could tailor the global scale MA framework to suit their specific contexts and decision making purposes:
What are the current spatial extent and condition of ecosystems?
What are the quality, quantity, and spatial distributions of services
provided by the systems?
Who lives in the ecosystem and what ecosystem services do they use?
What are the trends in ecosystem condition and their services in the
recent (decades) and more distant past (centuries)?
How does ecosystem condition, and in turn ecosystem services,
respond to the drivers of change for each system?
As mentioned in Chapter 1, the MA (2005d, p. x) states one of its intents is to be used ‘as a framework and source of tools for assessment, planning and management’. However, similar to the data and information developed, beyond providing the conceptual framework the tools to conduct assessments were not provided to
stakeholders for use in their sub-global scale assessments. The data sources, analytical approaches and tools used to derive information and conduct assessments at the global scale were described in large technical documents for the purpose of recording the approach and guiding stakeholders conducting sub-global assessments (these technical documents are discussed shortly). In short, the data sources, analytical approaches and tools applied at the global scale included:
Remote sensing and geographic information systems (GIS): primarily satellite
Inventories of ecosystem components: these were most commonly used to provide data on the amount and distribution of ecosystem services, species and demographic information (human demographic information was derived from census data);
Numerical simulation models: these were used ‘to describe interactions among
components of the system’ and ‘examine assumptions and responses to driving forces’ (MA 2005e, p. 48);
Indicators of ecosystem condition and services: indicators were used in many
ways including: ‘as surrogates for difficult to measure characteristics of ecosystem condition’; ‘to incorporate several measured quantities into a single attribute as an indicator of overall condition’; ‘to communicate effectively with policy makers regarding trends in ecosystem conditions and services’; and ‘to measure the effectiveness of policy implementation’ (MA 2005e, p. 49);
Indigenous, Traditional and Local Knowledge: used primarily to provide
information on ecosystem condition and trends; and
Case studies of ecosystem responses to drivers: case studies were used to
generate ‘general principles about ecosystem responses to drivers in different locations and under different biophysical conditions’ (MA 2005e, p. 53).
44
Global Orchestration: focused on global cooperation. Cooperation to improve
social and economic well-being and to protect and enhance public goods (e.g. education, health and infrastructure);
Order from Strength: explored citizens, businesses and governments becoming
more inward focused in response to terrorism and the breakdown of global cooperation. As a result the world becomes more compartmentalised;
Adapting Mosaic: in this scenario society is interested in learning about
socio-ecological systems through adaptive management. An element of this scenario is learning about balancing different forms of capital (natural, human, built etc.); and
Techno Garden: society focuses on ‘natural capitalism’ in this scenario –
developing profit from working with nature. The reliability and supply of ecosystem services is improved through strengthened markets and institutions.
As mentioned previously the data sources, analytical approaches and tools developed to conduct assessments, as well as the design of the MA framework and lessons learnt from its development and application, are written into five technical volumes (A Framework for Assessment; Current State and Trends; Scenarios; Policy Responses; and Multi-scale Assessments). Each volume ranges from 395 pages to 918 pages each. One synthesis document brings together and summarises the five technical reports for decision makers (MA 2005f). Five other synthesis reports focus on specific issues or are tailored for specific stakeholders (i.e. Biodiversity Synthesis; Desertification Synthesis; Opportunities and Challenges for Business and Industry; Wetlands and Water
Synthesis; and Health Synthesis) (MA 2005a). These documents are available for purchase in hard or paperback versions and they are freely available on a dedicated website.
Since the MA’s release in 2005 many new and existing institutions, policies, plans and programs are applying or integrating ecosystem services into their objectives (WRI 2007; EPA 2008; Haines-Young and Potschin 2008; Staub et al. 2011; UK NEA 2011b; WBCSD 2011; Townsend and Thrush 2012; UNSD 2012). Some global scale