:t:
+
liB
A STUDY OF THE EVOLUTION
OF CONCENTRATION
The study of the evolution of concentration in the textile industry (wool, cotton and knitted goods sectors) has previously been carried out in four community countries (Germany, France, Italy, Belgium). It has been extended to cover the current situation in one of the new Member States, the United Kingdom. In fact the textile sector, as well as the overall structure in this country, presents a very sharp interest.
A STUDY OF THE EVOLUTION
OF CONCENTRATION
IN THE UNITED KINGDOM
TEXTILE INDUSTRY
by F. Fishwick and R. B. Cornu, cranfi~Id School of Manaiement
PREFACE
The present volume is part of a series of sectoral studies on the evolution of concentration in the member states of the European Community.
These reports were compiled b.y the different national Institutes and experts, engaged b,y the Commission to effect the study programme in question.
Regarding the specific and general interest of these reports and the responsibility taken by the Commission with regard to the European Parliament, they are published wholly in the original version.
The Commission refrains from commenting, only stating that the responsibility for the data and opinions appearing in the reports, rests solely with the Institute or the expert who is the author.
Other reports on the sectoral programme will be published by the Commission as soon as they are received.
The Commission will also publish a series of documents and tables of syntheses, allowing for international comparisons on the evolution of concentration in the different member states of the Comruunity.
LIST OF CONTENTS
Acknowledgements
Section I An Outlin~ of the Study and a Summary of Findings
A. Activities included
B.
Objectives and research methods C. Summary of following sectionsPage
VII
1 3 4
Section II Recent Trends in the Three Sectors
A. The UK demand for textile products
B.
External tradeC. Prices, output, productivity and employment D. Financial trends
9
11
17 25
Section III Influences on the Str~cture of the Sub-Sectors
A. The structure of the industry in the early 1960's 27
B. Horizontal and vertical integration 31
L. Concentration among customers 34
D. The role of the large fibre producers 37
E. Government policy 39
Section IV A Statistical Study of Concentration 1963-73
A~ Methodology 41
1. Concentration and market forces 41
2. Coverage and data 42
3. Definitions and basic properties of concentration 46
B. Changes in concentration 1963-8 (Jndices 5i
C. Concentration of sales turnover 1968-73 56
D. Concentration of other financial variables 1968-73 6~
Section V Product Market Analysis
A. Specialisation 75
B. Analysis by production process intermediate products
1. Preparation for \"Jorsted spinning 77
2. Woollen yarn spinning 77
3. Worsted yarn spinning 78
4. Spinning of cotton and man-made fibres 78
5. Warp-knitting 80
C. Analysis of selected end-Uses
1. Hand-knitting yarns 81
2. Coloured woven ~1oollen tweeds 82
3. Sewing thread 84
4. Men • s and boys • shi :--ts 85
5. Sheets and bedding 87
6. Women's hose 88
Section VI Concent,·ation and Competition - some concluding comments 91
activities (UK and world-wide) 96
Appendix B Tables of Concentration 102
Appendix C Estimates of total sub-sector sales 170
Appendix D Tests for correlation of ranking 173
Appendix E Additional company information 175
1. Major acquisitions l75
2. Mergers 1'79
3. Financial links between companies 179
4. links between boards of directors 182
5. Family ties 183
Appendix F Analysis of Major Textiie Companies
Introduction and comparative results 1H4
1. Courtaulds 188
2. Carrington-Viyella 194
3. Tootal 20('
4. Coats-Paton~ 206
5. Illingworth-Marris 211
6. Other major companies
William Baird/Joseph Dawson 216
Nottingham Manufacturing Co 218
Spirella/Vantona 219
Appendix G Census of Production 1963 and 1968 221
Analysis of enterprises
ACKNOWLEDGEMENTS
Considerable help was given to the author by representatives of fourteen textile companies and four major retailing groups. These firms are not named here for reasons of commercial security; their guidance was of great value.
The assistance of the following organisations is also
appreciated:-Wool Textile ~elegation
Textiles Industry Statistics Bureau British Textile Employers' Federation Knitting Industries Federation
Shirley Institute
National Economic Development Office
In addition thanks are due to present and former colleagues at the Cranf~ .;·1 d School of M1nagement who have contributed to the project. Important
contributi0ns have been made by Robert Cornu, Director of Cranfield1s International Business Programme who initiated Cranfield•s contribution to the series ~f E.E.C. studies; Wendy Hull, full-time research officer until March 1~75, and by the research assistants, especially Gill West who has also acted as secretary for most of the project. Essential contri-butions have also been made by staff of the Cranfield Computing Centre and by colleagues who read the draft version of the report.
SECTION I
AN OUTLINE OF THE STUDY AND A SUMt1ARY OF FINDINGS
A. THE ACTIVITIES INCLUDED
This report is about concentration and its implications for competition in three sub-sectors of the textile industry: traditi.onally referred to as cotton, woollen and worsted and hosiery and other knitted goods. The introduction of man-made fibres, which accounted for 71 per cent of all fibr·es u~cd in the United Kingdom in 1974, and the formation of large groups with interests in all three sub-sectors have blurred the distinctions between them but traditional boundaries remain. These boundaries are partly geographical: the "cotton industry" is concentrated mainly in East Lancashire and Greater Manchester, the "woollen inaustry" in West Yorkshire and the "hosiery and knit-wear industry" (except for some warp- and \':eft-knitted fabrics) in the East :;1i dl a nos. Associ at ions of traders and employers, trade unions and technjcal institutions are still defined on the older boundaries.
The "cotton industry" is now a small remnant of what existed before self-sufficiency and competition from other countries caused the disappearance of its export markets. The scale of its decline is without parallel in Britain:
Total employment (OOO's)
Fabric production (million m2) Fabric exports (million m2}
Sources: Textile Council (1912)
Government departments (1974)
1912
710 7, lOO
5,700
1974
104
1,130
The sub-sector encompasses:
(a) the spinning into yarn of cotton and of staple man-made fibres on the cotton system {the addition of flax-spinning to official statistics is of negligible importance because of the declining use of this fibre);
(b) doubling of such yarns and of continuous filament yarns;. and
(c) weaving of cloth from yarn spun on the cotton system and/or from man-made filament.
The woollen and worsted industry did not experience a decline during the earlier decodes of this century on the s~me scale as that in lancashire. There are two reasons for this: less reliance on plain easily manufactured fabrics and no reliance o;1 exports to warm climates. The industry is defined in this report (and in official statistics) to cover:
{a) the preparation and spinning of wool into woollen or \torsted yarns {the latter consist of longer-staple fibres, combed before spinning and with ·less twist in the yarn), the preparation
and spinni~g of man-made fibres on the same systems; and
{b) the weaving of woollen and worsted yarns (including man-made fibre yarns spun on the same systems) into fabric.
The hosiery and other knitted goods sub-sector has expanded since the last war because of the inclusion within it of warp- and weft-knitted fabrics used for a wide variety of purposes, i ncl udi ng shirts, trousers, soft furnishings and bedding as well as more familiar knitted
gar-ments. Between 1948 and 1968 total emp~~yment in this sub-sector increased from 103,000 to 135,000. The official definition of the sub-sector (1971 Census) shows the breadth of its coverage: knitting of fabrics or• warp looms; knitting of stockings, socks; knitted garments and other goods including weft-knitted fabrics.
Making up of household textiles and of clothes cut from knitted fabrics is included when it is carried out in the same establishment as the knitting of the fabric.
Because for many purposes cotton-type, woollen- and worsted-type and knitted products are close substitutes, the report al.so examines concentration in the three sub-sectors combined under the title "textile processing ... The report is not directly concerned with the _production of artificial and synthetic fibres but, because of the importance of such fibres in all three sub-sectors, the domina~t position of the two major E~riti5:1 producers and the interests which they have acquired in the processing industries, frequent reference is made in the
report to this other sub-sector.
B. THE OBJECTiVES OF THE STUDY AND RESEARCH METHODS
Tpe investigation forms part of a series sponsored by the Commission of the European Communities throughout the European Economic Community. One objective is to provide a detailed stati~tical analysis of concen~ tration according to a standard methodological framework specified by the Commission; this statistical analysis appeal'S as Appendix B of this report (Tables of Concentration). Another objective is to identify the main factors influencing competition within the s~b-sectors and the relationship between this competition and industrial concentration.
The research programme began with a search of statutory accounts of companies identified as operating within one·or more of the sub-sectors. Over 500 companies were included in this search, although not all these were included in the statistical analysis (for definitions of samples
SUMMARY OF FOLLOWING SECTIONS OF THE REPORT
Section II examines trends in the industry, mainly since 1963. The total market for textiles and clothing has expanded only slowly in
recent years and overseas suppliers have obtained an increasing proportion of this market, especially in woven cotton and man-made fibre fabrics. and knitted and made-up clothing. Exports have expanded more slowly. Total production in the woollen textile industry has been falling, mainly because of increased imports of made-up clothing and a static market for \toollen carpets. Output in the "cotton .. sub-sector has been
relatively static while output of hosiery and ·:.ther knitted goods
sector e.atpanded unti 1 about 1970 and has then tended a 1 so to be static.
Intense competition between home-produced goods and imports, between fibres, between knitted and woven fabrics and between companies within each segment of the ~dustry has been expressed in pricing. The response of companies to these competitive conditions has been increased product-ivity achi~ved t· .• 'ough capital investment and at the cost of a large
cut in employment. Much of this investment and associ.ated reorganisation, especially in the cotton and hosiery and other knitting sub-sectors,
was financed by the two major U.K. producers c~ man-m~de fibres.
4
Section III examines influences on the structure of the textile industries. In 1963, in spite of reor-~anisation under the Cotton Industry Act of
1959 the cotton industry remained much less concentrated tnan manufactur·ing industries as a whole - firms \r:Jith fewer than 1,000 ernnloyees accounted for over 4~ per cent of employment. The wool and knitting sub-sectors were even more fragmented. This structure contrasted sharply with the virtual duopoly already existing in man-made fibre production.
Another feature of the three sub-sectors was a horizontal rather than vertical structure (the only exception was woollen, as opposed to worsted, spinning and weaving). The need for long runs in spinning contrasted with that for variety in weaving and knitting of all but the plainest fabrics (and most of the market for plain fabrics had long before been lost to overseas products). This horizontal structure increased the industries' vulnerability to inventory cycles and to
was economic only if undertakings were sufficiently large to permit variety in weaving and knitting together with long production runs in spinning.
A third feature of these industries,wAich influenced changes in structure, is the importance of a few major customers - the multiple retailers of clothing and, to a lesser extent, household textiles. The role of these customers in importing, 1n forcing down prices and in generating
sharp changes in demand were emphasised by some manufacturers in discussions with the author. Section III also sunrnarises the views of major retail~rs on these aspects of their trading. There is little doubt that the predominant position of major customers has created pressure for (a) greater size, to giv~ countervailing selling power, and (b) more vertical integration, to facilitate greater control over supplies and outlets and development of branded textile products.
A major reason for the emergence between 1963 and 1968 of large multi-process vertically integrated groups in the textile industries was the intervention of Courtaulds and I.C.I. Section III traces the history of this intervention: the abortive takeover of Courtaulds
by I.C.I., the series of acquisitions in textile processing by Courtaulds {£150m. in five years) and the investments by them and I.C.I. in other major textile groups. The purpose of this int£rvention was the
preservation of the U!'lited Kingdom market for fibres. In view of their fragmented and horizontal structure and the importance of major retail cus tamers, themse 1 ves fo~:~ed by intense competition to seek 1 ow-cost supplies, the cotton and hosiery sub-sectors might have contracted very sharp1y \'lithout this assisted reorganisation.
Government policy on mergers in the textile industry has varied. Until 1968 there was a favourable policy towards 11rationalisation .. , which had extended over many years {pre-war 1egislation affecting
cotton spinning had common features with the 1959 Cotton Industry Act). In 1969 the Government announced its opposition towards
the cotton and knitting sub-sectors. The government has continued to
encourage amalgamations of smaller firms in the textile ind~stry
and rationalisation is one of the objectives of a scheme for the reorganisation of the woollen and worsted sub-sector.
Section IV examines changes in concentration between 1963 and 1968
and between 1968 and 1973. To this latter period the statistical framework of the Commission has been applied in complete detail {the first part of Section IV explains the methodology, the coverage of the data and the meaning of the various i[dices of concentration).
Between 1963 and 1968 concentration increased appreciably in both cotton and hosiery, mainly because of the intervention of the two fibre producers. In the wool sub-sector less development occurred although Courtal:lds acquired some capacity and I.C.I. obtained a
minority interest in one of the moderately large independent concerns.
6
In the period 1908-73 concentration increased more in the wool sub-sector than in cotton or knitting. The increase in concentration was confined to the largest firms in the industry: as a r2sult or- acquisition of other large groups, Coats-Paton and Illingworth Morris increased their share of total turnover in the sub-sector from about 19 to 30 per cent. The combined share of the ten largest firms in the woollen and worsted industry remained, however, at 60 per cent in 1973 (the same as in 1968).
In the cotton industry a distinct oligo~oly group of four firn1s was
reduced to three at the end of 1970 by the merger which formed Carrington-Viyella Ltd. This merger, brought about by financial pressures and
effected by I.C.I., was the only major development. A proposal by Courtaulds in 1969 to take over its then largest competitor, English Calico, was aborted by Government opposition which also prevented any further intervention by fibre producers (other than the Carrington-Viyella case) until 1973. There is evidence that the pdli~v has
not changed. Although it changed little over the five years, concen-tration in cotton remained much greater thdn
in wool;
tenfirms
In hosiery and knitting also, concentration changed negligibly between 1968 and 1973. As in cotton, there had been a big increase in
concentration over the previous five years. In 1968 four firms controlled 53 per cent of turnover and 10 firms just over 72 per cent; in 1973
the two proportions were unchanged. As in cotton, government opposition to further intervention by fibre producers was probably of paramount importance.
One of the more unusual features to emerge from the statistical analysis is the existence of an oligopoly in textile processing as a whole. The degree of concentration in the combination of the three sub-sectors {and vertically integrated dyeing, finishing and distribution} is remarkably high: five firms controlled 57 per cent of all turnover
in 1968 and 59 per cent in 1973. One of these five firms is itself
a major fibre producer (Courtaulds), in another {Carrington-Viyella) I.C.I. have a majority shareholding and in a third {Tootal) both I.C.I. and Courtaulds hold 8 per cent of equity.
The concentration of profits in the cotton and wool SIJb-sectors appears to have var~ed inversely with the state of trade. In the recession of 1969-70 the sha~e of profits obtained by the five largest concerns fell significantly. In hosiery and other knitting the reverse (and more usual) tendency was observed.
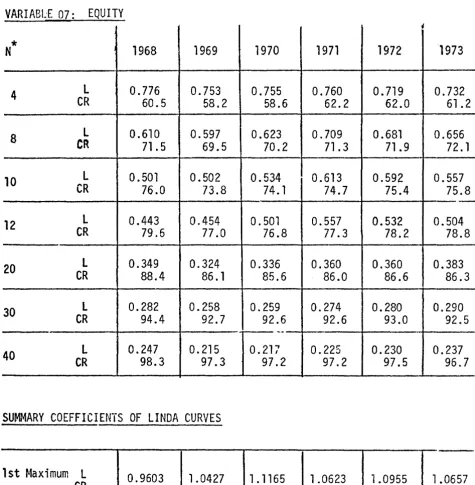
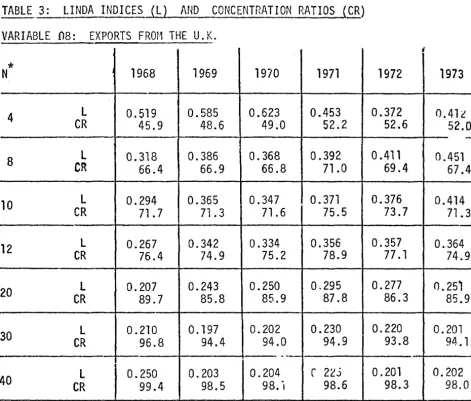
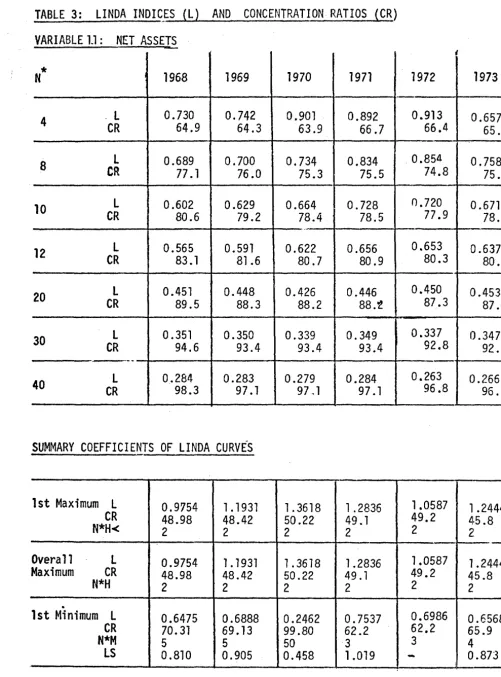
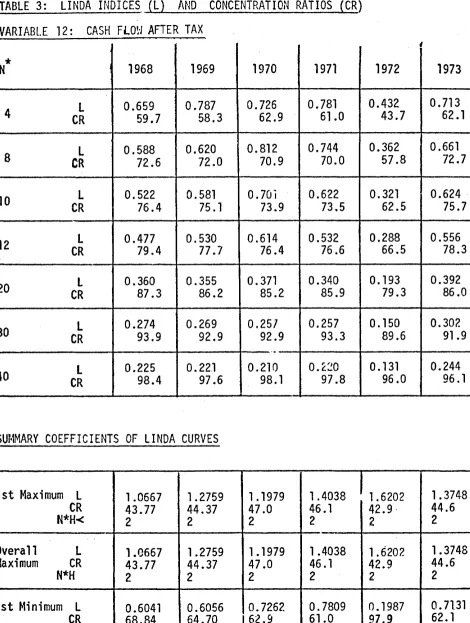
Concentt·ation of most other financial variables (cash flow, capital expenditure, equity, net assets and net cash flow) appears to be greater in most years than that of turnover and the firms with the largest turnover tended to account for even greater proportions of these other variables. One exception to this obs~rvation was that exports were more evenly distributed among firms in the textile
industry. The five largest textile enterprises (apart from Courtaulds) accounted for a much lower·proportion of exports than of sales
turnover.
Se~tion
V examines in some detail the markets
foi·certain
productworsted yarns, spun yarns of cotton and man-made fibres and warp-knitted fabrics. End-use products selected for detailed analysis are hand-knitting yarns, coloured tweeds, sewing thread, shirts, bed linen and ladies' hose. In each of these end-uses the importance of supplies from overseas and of major customers in this country is evident.
Section VI relates the findings of the statistical analysis to the wider competitive situation described in Sections II, III and V. The combined effect of vertical integration, of increasing concen~ tration among customers and continuing imports is likely to be a tendency towards greater concentr1tion in the textile industries over the next few years. This tendency is evident from developments occurring at the time of writingo These developdevelopments -mergers and acquisitions - generally result, like those of the 1960's, from defensive motives. Unless this is prevented by Government action, this defensive reorganisation is likely to continue for some years.
SECTION II
RECENT TRENDS IN THE THREE SECTORS
INTRODUCTION
Companies in all three sub-sectors have been operating in a continuously competitive environment in recent years. The total market for textiles and clothing in the United Kingdom has expanded only slowly; competition from imports has affected a growing part of this static market and low-cost producers have also competed in export markets. Within the textile industry there has been intensive competition between fibres and between knitted and woven fabrics. The response from companies to this competition has been increased productivity achieved through capital investment and at the cost of a large cut in employment. This investment has reflected the intervention in the inaustry of large fibre producers eager to
preserve the U.K. textile industry as an outlet for their fibres and to ensure the security of their own sales.
A. THE U.K. DEMAND FOR TEXTILE PRODUCTS
An analysis of textile demand by end-uses was produced by the National Economic Development Office (1) for 1970. This analyses consumption of fibres by
weight:-Table 1: End-uses of textile products {by weight), including imports and excluding exports
Made-up clothing (woven or knitted fabrics) Knitted garments and hosiery
Hand-knitting yarn and sewing thread
Household textiies, furnishings and blankets Carpets, linoleum and leathercloth
Tyre cord
Other industrial uses and narrow fabrics
.!
28.2
8.9 3.0
14.6
18.5 3.4 18.8
Clothing is the largest single end-use for textile fibres in the U.K. and, when knitted garments are included, accounted for 37.1 per cent of 1970 consumption by weight. Consumers' expenditure on clothing has remained in recent years at about 8 per cent of total consumers' expenditure. Between 1963 and 1974 total expenditure rose by 32 per cent and expenditure on clothing by 33 per cent; analysis of data fot· intervening years confirms that the elasticity of demand for clothing in relation to consumers' expenditure is close to 1 (See footnote 1).
10
Knitted garments (that is hosiery and garments knitted complete)
accounted for between 22 and 25 per cent of annua 1 consumers • expenditure! on clothing in each of the ·years 1963-71 (1); later data are not
available. There are few data on the relative importance of knitted and woven fabrics in made-up clothing.
As with that for clothing, demand for household textile~ and soft furnishings has grown approximately in proportion to consumers' total expenditure with a 30 per cent growth over the period 1963-74. Analys·is of annual data over this period confinns that- expenditure-elasticity was close to unity2. The shares of knitted and woven fabrics are not known.
The weaving and tufting of carpets do not come within the terms of reference of this report but represent a major market for spun yarns of wool and man-made fibres. In 1974 carpet manufacturers took 6 per cent of the output of the cotton and man-made fibre spinning sector (most of it spun rayon} and 33 per cent of the yarn produced in the woollen
industry. In recent years, sales of woven woollen carpets have remaine·d static, in contrast to those of tufted carpets, in which man-made
filament fibres
predominate:-1
2
A regression equation produced an estimate of 1.036 with a standard error of 0.032.
Regression analysis produced an estimate of 0.980 with a standard error of 0.138. The greater instability possibly reflected
Manufacturers• sales of woven and tufted carpets in the United Kingdom (million square metres)
Woven woollen Woven man-made Tufted
31.2 18.1 27.5
31.9 18.5 49.2
32.9 20.1 102.2
27.1 19.7 100.1
Most of the smaller categories of end-use have also shown slow growth of demand in recent years. For example, U.K. use of tyre cord (U.K.
production - exports + imports) rose by 40 per cent between 1958 and 1963 but the figure for 1973 was less than 1 pfr cent above that for 1963.
Measured in volume terms, total demand for textile products has grown more slowly than real income in the United Kingdom over the ten years up to 1974. Evidence has been presented elsewhere (2} that this low income-elasticity of demand for textiles is a characteristic of most western European countries.
B. EXTERNAL TRADE
Table 2 shows imports and exports of textile products in 1968 and 1973. Production of man-made fibres (as opposed to processing) has been
12
Table 2: The value of external trade 1968 and 1973 (£m)
1968 1973
Product category Exports Imports Balance Exports Imports Balance
Cotton yarn
&
thread 10.8 8.8 +2.0 22.0 15.6 +6.4Spun man-made fibre
yarn 4.4 3.6 +0.8 28.1 17.1 +11.0
Woo 11 en & ~lors ted yarn 20.4 1.9 +18.f. 41.6 10.4 +31.2
Woven fabrics - cotton 28.2 67.7 -39.5 39.5 103.5 -64.0
-
man-made f. 20.6 33.0 -12.4 49.9 115.4 -65.5
- wool 66.5 8.8 +57.7 91.5 11 .8 +79.7
Knitted fabrics 11.4 7.0 +4.4 43.2 12.6 +30.6
Carpets 29.6 18.8 +10.8 78.2 41.5 +36.7
Other textile products 70.7 58.5 +10.3 104.9 121.7 -27.2
TOTAL SPUN YARNS
& FABRICS 262.6 208.1 +52.6 498.9 449.6 +38.9
Knitted garments 27.1 44.9 -17.8 70.1 112.8 -42.7
Other clothing 57.4 65.2 -7.8 109.5 220.7 ·-111.2
TOTAL CLOTHING 84.5 110.1 -25.6 179.6 333.5 ·-153.9
Source: Textile Industry Statistics Bureau
Since 1974 was a year of international recession, the comparison of 1966 with 1973 probably indicates trends over the survey period more satisfactoriij' than a comparison with 1974. One recent development which has produced
extensive comment within the industry has been a sharp increase in the impol,.ts of cotton and man-made fibre spun yarns, from 31,100 tonnes in 1973 to s:~ ,400
tonnes in
1974.The overall trading surplus on spun yarns and fabrics
One of the reasons why the overall balance of trade in textile products has not worsened more sharply has been a favourable movement in the terms of trade - U.K. export prices have risen more quickly than those of imports. The deterioration in volume terms is shown in the increases in import penetrations and decreasing ratios of exports to imports shown in Table 3.
There are two elements in the growth of imports which affect the U.K. textile industry: (a) the increase in imports of clothing and made-up textiles, of which the fabric contents are also produced overseas (with negligible exceptions) and (b) the increase in imports of intermediate products - fabrics and yarno Because of the importance of vertical integration in the industry on the part of major producers of man-made fibres, the increased import penetration of the U.Ko market for unprocessed staple fibres and filament yarns is also significant to this study of competition. Table 3 shows estimates of import penetration in volume tenns for each of the main categoriC'.-~ of textile products together with the ratio of imports (in weight or area) to exp~rts (measured in
the same way).
Imports
Import penetration
=
100X
Table 3: Import penetration and export/import ratio~
Import penetration Ratio of
(%)
Exports to imports1963 1972 1974 1963 1972 1974
Man-made staple
fibre 10 26 26 2.63 2.77 2.53
Continuous
filament yarn 5 29 30 5.06 1.50 1.23
S~un Yarns Cotton
&
man-made fibres 5 13 23 0.75 0.64 0.26
Woollen
&
worsted 1 3 4 7.00 3.50 3.00Woven fabrics
Cotton 41 47 55 o.3s 0.25 0.24
Man-made fibre'> 9 37 42 1.33 0.56 0.49
Wool
&
worsted 11 8 9 3.17 4.88 4.72Knitted fabrics 6 7 5 1.67 3.88 4.00
Carpets 8 7 13 0.85 2.57 2.24
Made-up clothing 6 13 20 0.59 0.56 0.47
Hosiery
&
Knitwear 12 23 27 0.49 0.65 0.62Sources: NEDO and Department of Trade.
Tables 2 and 3 need to be interpreted with care. Those finms making intermediate products such as man-made fibres, yarns and loom-state fabrics, are adversely affected by increased imports of textiles incorporating such products. For example in 1974 imports represented 42 per cent of the volume of man-made fibre fabrics supplied to U.K. customers {mainly makets-up of apparel, household textiles or other end-use products). Of the man-made fibre content of all end-use products, 52 per cent was imported. These "indirect imports" become progressively more significant with mo"~ment away from the final market. Indirect imports substantially diminish the duopoly position
14
The Geographical Pattern of·rrade
Most of the United Kingdom's textile imports originate from the Far East or from the Mediterranean. In contrast, the main markets for exports are western Europe and (to a lesser extent) North America. The following table shows total trade in textiles and made-up clothing in 1973. (See note at end of table).
TABLE 4: THE GEOGRAPHICAL PATTERN.OF TRADE
~973 (£m)Country (a)
Republic of Ireland Italy
Other E.E.C.
E.E.C. Total
Portugal
Other Western Europe
U.S.S.R.
&
E. Europe North AmericaPakistan India Taiwan Hong Kong S. Korea Japan
Total of above six
All countriPs n.e.s.
WORLD TOTAL
U~K. imports from (a)
Textiles Clothing
50.9 30.0
28.4 10.3
124.0 33.4
2J3.3 73.7
38.7 29.1
98.7 46.0
11 .1 9.7
45.7 4.7
9.4 1 • 1
28.0 4.7
5.6 18.7
33.8 123.4
4.5 8.4
9.6 3.4
90.9 159.7
26.5 10.6
514.9 333.5
U.K. exports to (a) Overall Trade
Textiles Clothing Balance
46.3 21.1 -13.5
13.5 3.7 -21.5
116.0 41.7 +0.3
175.8 66.5 -34. i'
11.7 2.7 -53.4
126.9 49.4 +31.6
24.9 3.5 +7.6
70.5 29.6 +49.7
0.9 +49.7
0.6 -32.1
0.3 -24.0
12.7 2.9 -141.6
-12.9
29.7 3.7 +20.4
44.2 6.6 -199.8
135.6 21.3 +119.8
16
Note: Owing to the degree of detail published in official statistics~, it was not possible to produce Table
4
for exactly the same data as those in Table2.
Table4
includes man-made filament yarn and does not include carpets. Total imports of filament yarn in 1973 were £70.7 millions and exports £110.0 millions; for carpets the corresponding figures were £41.5 millions and £78.2 millions.Restrictions on Imports of·Textile Products
Until 1959 imports of textile fabrics were allowed into the United Kingdom free of duty if they originated in Commonwealth countries. This explains the emergence of Hong Kong as a major supplier. Subsequently, rising 11Ceilings" (quotas) were imposed on cotton textiles from such sources
to prevent disruption of the domestic industry (under the provisions of article 19 of GATT).
From February 1962 until the end of 1973, restrictions on trade in cotton textiles were regulated by a Long Term Arran~ement negotiated by 50 member countries of GATT, which provided for expansion of ~ales by developing countries but also for protective quotas to prevent disruptive effects. Because the U.K.•s policies at that time wet~ among the most liberal and any increase in restrictions was subject to external scrutiny, they
remained more liberal than those of most other western European countries.
Quotas are reg~rded as preferred to tariffs by most enterprises in the industry which express the fear that imports may be subsidised in order that foreign exchange may be gained. A 1 though quotas were to have be~ en replaced by tariffs in January 1972, they were retained (because of industry pressure) at a higher level and accompanied by tariffs. Quotas were confined to cotton goods and during 1972 there was a switch by t\s i <in producers to fabrics containing more than five per cent man-made fi br'es .. During 1973 the quotas were extended to certain man-made fibre fabrics.
restrictions are specific to individual countries.
These arrangements are now subject to a four-year multiple-fibre agreement reached in December 1973 by 50 countries of GATT. This agreement, which set-up a Textile Surveillance body, concerns most textile products - tops. yarns, piece-goods, made-up articles, garments and other products of cotton, wool, man-made fibres or blends thereof. No new unilateral or bilateral
restraints are to be placed on trade in textiles unless specifically
authorised under the provisions of the arrangement; all existing restraints were to be "notified immediately and thereafter to be either phased out or justified under the provisions of the arrangement". Phasing-out is to be within three years of April 1974. New restrictions can be introduced under strict conditions and multilateral surveillance; they can apply only to precise products and specific countries. They are essentially temporary and 4uotas on imports from developing countries are to be enlarged automatically by six per cent per year.
The 1973 multi-fibre agreement appears to prP,vent the imposition of more severe restrictions on imports of textiles into the U.K. The expansion of textile imports may, however, be restrained by membership of the European Economic Community which negotiates as a single unit under the GATT arrangement. Recent proposa 1 s put fon·1ard by the Commission of the European Communities provide for a wider sharing of textile imports
from developi~g countries among members of the Community. Textile imports may remain fairly static over the next two or three years but in the
longer terrn, restrictions are unlikely to provide continuing protection.
C. PRICES, OUTPUT, PRODUCTIVITY AND E~1PLOYMENT
There are several different elements of competition within the textile
18
2. Between alternative methods of fabric production: many end-uses are now supplied by woven, warp-knitted or weft-knitted fabrics. These processes are usually carried out in different establishments and individual companies have differing degrees of investment in each.
3. Between home-produced and imported fibres, yarns and fabrics: this element of competition is complicated by the importation of inter-mediate products by some firms engaged more heavily in the later stages of ;1roducti on o
This intensely competitive environment is to some extent reflected in trends in wholesale prices of textila productso These prices also reflect the changing costs of raw material~, especially the increasing prices of natural fibres in relation to those of man-madeo Table
S
s-hows that until 1970 the prices of man-made fibre textile products rose more s 1 owly than the genera 1 price 1 eve 1 • In the case of natura 1fibre yarns and fabrics, prices rose much less than those of the raw material content in 1973.
TABLE 5: SELECTED rRICE INDICES 1963-74 (1963=100)
-1968 1970 1973
Raw cotton (1) 130 116 246
Raw Wool (2) 99 81 291
Man-made fibres (3) 86 90 95
Man-made spun yarns 100 108 136
Cotton and mixture y~~ns 130 144 207
Cotton cloth (loomstate) 124 144 200
Man-made fibre cloth (loomstate) 106 114 150
Worsted yarns 97 100 189
Hosiery and knitwear 98 99 115
Made-up clothing 109 115 138
Prices of all manufactured products 117 128 158
1974
265 215 1:24 1'71 2:74 273 196 190
138
160
194
(1) refers to c.i,f. price of cotton landed at Liverpool from New Orleans.
(2) refers to the average price at selected auctions of Merino 64s (source of these data U.N. Monthly Bulletin of Statistics).
Their falling cost in relation to that of cotton has encouraged an acceleration of the shift to man-made fibres in the 11cotton11 industry
before 1970 and the rapid rises in the prices of both cotton and wool during 1972 and 1973 led to more widespread replacement of these
fibres:-Table 6: U.K. ~i 11 consumption by category of fibre (000 metric tonnes)
1966 1968 1970 1973 1974
Man-made 340 432 469 627 560
Cotton 206 172 166 126 112
Wool 187 189 163 149 121
Total 733 793 795 902 793
Man-made as % of total
~_ource: Textile Industry Statistics Burea•J (Quarterly Review)
Althougn the switch from natural to man-made fibres occurred partly within the tradi ti ana 1 \'Jeavi ng industries, it a 1 so reflected the
increased adoption of knitted in place of woven fabrics. In 1973 warp knitting absorbed 15 per cent of the total U.K. output of filament yarn~
1.8 times as much as weaving. Weft knitters absorbed 15 per cent of the output of yarns spun on the cotton system.
The competition between woven and knitted fabrics is considerably
affected by fashion a~d by technological developments in man-made fibres. For example in both shirts and bedding the advance of warp-knitted nylon fabrics has been reversed in 1973 and 1974 by the popularity of \'!Oven polyester and cotton mixtureso Table 7 shows indices of production for"
industry:-20
Table 7: Indices of Production (1963=100)
1968 1970 1972 1973 1974
Man-made fibre production 201 238 255 303 265
Cotton
&
m.m.f. spinningand weaving 99 101 100 106 97
Wool and worsted spinning
and weaving 93 85 83 83 74
Knitting 132 149 149 153 146
Source: Textile Industry Statistics Bureau (Quarterly Review)
Some indications of the relative importance of the three sectors covered by this study is given by a comparison of net output (value added). In Table Bvalue-added in each sub-sector is shown as a percentage of the total of the three sub-sectors combined. (This method of comparison avoids the d;~torting effect of inflation on the absolute figures.)
TABLE 8: VALUE ADDED WITHIN EACH SECTOR
Sector 1963
(%)
1968 (%) 1971 {%)Spinning
&
weaving of cottonand man-made fibres 33 33 34
Wool & worst~d 41 34 3"1
Hosiery
&
other knitted goods 26 34 35Source: Censuses of Production
Further evidence of the competitive pressures on the textile industries
is provided by the rapid rise in labour productivity since the late 19501
s.
With falling sales, this increased productivity has beenemployment:-TABLE 9: EMPLOYMENT AND PRODUCTIVITY 1963-74
Spinning
&
weaving of cotton&
man-made fibresEmployees: Male
{OOO's) Female
Total
Index of Employment Index o+" Output
Index of Productivity
Wool and Worsted
Employees: Male
(OOO's) Female
Index of Employment Index of Output
Index of Productivity
Hosiery
&
KnitwearEmployees: Male
(OOO's) Female
Total
Index of Employment Index of Output
Index of Productivity
1963 80.8 1-1.8.1 198.9 100 100 100 89.1 99.2 188.3 100 100 100 38.2 89.4 127.6 100 100 1no l968 77.5 86.7 164.2 83 99 120 78.6 74.3 152.9 81 93 115 44.0 90.9 134.9 106 132 125 1973 61.4 50.0 111.4 56 106 189 56.0 47.9 103.9 55 83 151 42.4 82.4 124.8 98 153 156
Source: Department of Employment and Department of Industry
1974 58.3 45.7 104.0 52 97 186 51.8 43.2 95.0 50 74 148 41.7 80.9 122.7 ~6 146 152
22
The greatest increases in productivity have occurred in the spinning and weaving of cotton and man-made fibres, though even in this sub-sector there was a deterioration in the 1974 recession. The increased
product-ivity has been achieved through capital expenditure, much of it financed
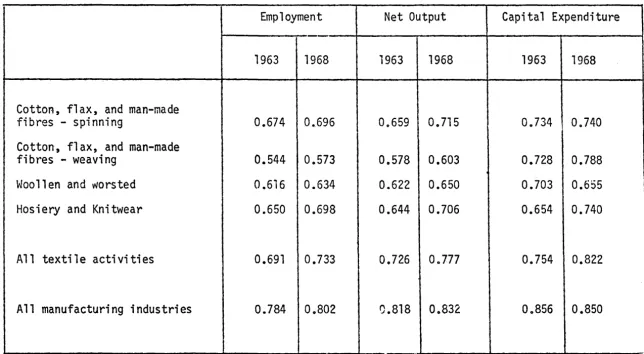
by the largest enterprises. In 1968 the 19 largest employers in weaving accounted for 44 per cent of employment and 66 per cent of capital
expenditJire. In spinning, the corresponding proportions for the 15 largest employers were 59 and 71 per cent. In order to maximise utilisation of the new equipment most firms have introduced shift-working and total capacity has been cofrespondingly reduced.
Spindles in place
Spindles running (average)
% operating on three shifts or on 7-day working
Looms in place Looms running
% operating on three shifts or 7-day working
3,860 3,470 26
90.1 77.3 23
1973
2,660 2,470 45
54.9 48.7 35
The widespread use of shiftwork in the "cotton industry" is one reason for the growing proportion of males in the labour force. A large part of the labour force on night shifts consists of Commonwealth immigrants.
The wool and worsted sub-sector had much less capital expenditure than cotton spinning and weaving and hosiery and knitwear during the survey period.
11:-Table 11: Expenditure on Plant and Hachinery (Gross) Per Employee
Cotton and m.m.f. spinning
&
weaving Wool&
WorstedHosiery
&
Knitwear1968
Source: Censuses of Production 1970 and 1971
1970 1971
Note that figures are at current price~ and r~ot adjusted for inflation.
This lower rate of capital expenditure may be associated with the more fragmented structure of the woollen industry (see Section III) and with the decline in total sales by this sub-sector.
In the hosiery and knitv1ear sub-sector a majur objective of capital investment has been to in\:rease capacity. Of the three sub-sectors th·!s had the highest productivity in the survey period, but Census figures confirm that productivity increases were greater in the other sub-sector~.
Table 12: Value added per Employee (£ - current prices)
Cotton etc. Wool
&
Worsted Hosiery&
Knitwear1968
1300 1415 1475
1970
1496 1487 1538
1971
1615 1668 1676
% increase 1968-71
24
18 14
Data on wage earnings show that (in spite of the high proportions receiving shift premia in the 11Cotton industry .. ) average earnings
whole:-Table 13: Earnings and shiftwork in April 1973 (Full-time manual workey·s)
Average hourly earnings % receiving shif· t
{pence) premium
Men Women ~1en Womer
Cotton etc. spinning 70.6 48.8 24.3 B. 1
Cotton etc. weaving 74.6 48.6 20.6 10 .~
Woo 1 & ~Jors ted 69.3 I 44.1 19.1 2.4
Hosiery & Knitwear 81.0 50.2 11.5
o.c
All Manufacturing 83.6 49.5 22.6 5. 2
Source: Department of Employment, New Earnings Survey.
Table 9 showed a loss of 193,100 jobs in the cotton and woollen industries between 1963 and 1974. The progressive decline in employment in the
cotton and woollen industries has led to an ageing labour force and a consequently high rate of natural wastage ~ut the social consequences of reduced employment are aggravated by geographical concentration.
In the "cotton industry" over 80 per cent of employment is concentratE~d
in East Lancashire, Greater Manchester and immediat.=ly adjacent parts of other counties. Over 70 per cent of the woollen industt~ is located in West Yorkshire. The economic consequences for many Pennine towns of the decline of textile employment are a major pressure for greater tra.de protection.
D. FINANCIAL TRENDS
No official data are published on company profits w.ithin individual sub-sectors and estimates of profits must be based on examination of company accounts. The data collected for this report refer to firms with a turnover of over £1 million, subject to a maximum of 601• Because of increasing concentration, especially in the wool sub-sector, the pro-portion of industry turnover represented by the samples increased progressively during the survey period, (this is discussed in Sections III and IV.) The fo11owing table shows total turnover and netresults {including both profits and·losses) in each sub-sector sample annually from 1968 to 1973. Absolute figures are not corrected for i.nflation.
TABLE 14 : TURNOVER AND NET PROFIT BEFORE TAX - SAMPLE DATA
(a}Turnover % of industry (b}Net Results (b} % of (a}
£m. £m.
Wool 1968 315.3 55 16.5 5.2
1969 341.0 13.4 3~9
1970 333.8 56 9.0 2.7
1971 346.2 62 11.8 3.4
1972 398.2 64 25.6 6.4
1973 499.7 65 34~9 7.0
Cotton 1968 386~1 73 21.7 5.6
1969 415.0 74 20.0 4.8
1970 425.8 75 18.9 4.4
1971 457.8 77 19.2 4.2
1972 501.2 80 26.3 5.3
1973 590.2 82
37.5
6.4Hosiery 1968 364.7 79 25.5 7.0
1969 392.2 23.0 5.9
1970 431.2 77 22.8 5.3
1971 461.6 85 29.0 6.3
1972 483.0 86 32 .• 9 6.8
1973 583.8 89 41.8
7.2
1 In one instance (Wool 1970) the maximum
wa~
extended to 61, as there was26
These data show that in all three sub-sectors there was a decline in profitability in 1969 and 1970 and that in all three sub-sectors profits as a percentage of sales did not recover to their 1968 level until 1973. This period of reduced profitability can be attributed to falling (or levelling off) of demand (see Table 7 ) accompanied by increases in costs of natural fibres and of labouro The 1973 boom in demand led not only to fuller utilisation of capacity but also to increases in margins.
INFLUENCES ON THE STRUCTURE OF THE SUB-SECTORS
A. THE STRUCTURE OF THE INDUSTRY IN THE EARLY 19601s
Table
is
shmvs the distributions of enterprises by size of employment in cotton spinning, cotton weaving, woollen and worsted and hosiery and knitting in1963:-TABLE 15 : CLASSIFICATION OF ENTERPRISES BY SIZE OF EMPL0Yt-1ENT Cotton etc. Cotton etc. Woollen & Hosiery &
No. of emp 1 oyees Spinning ~~eavi ng lJors ted Knitting
1 - 99 191 277 790 681
100 - 199 44 109 154 95
200 - 499 55 81 133 64
500 - 1999 36 28 63 52
2000 and over 8 5 7 5
Total of above
categories 334 500 1147 897
Firms reporting
unsatisfactor1ly 11 29 44 40
TOTAL NOo OF FIRf'.1S 345 529 1191 937
Total employment
(Ooo•·s) 104.3 89.1 177.1 124.5
Source: 1963 Census of Production
The official separation of spinning and weaving overstates the number of enterprises in the cotton industry because of the double-counting of
2~8
about 70 per cent of spinning capacity and around 40 per cent of looms in weaving.·1
The structure of the cotton industry had been changed considerably during its long period of contraction partly as a result of government action. Before the 1939-45 war legislation had been introduced to give legal enforcement to the Yarn Spinners Price Agreement ~1hi ch set common prices and to empo~t/er spinners• organisations to purchase compulsorily excess spindle capacity. (This common price list \~as declared illegal by the Restrictive Practices Court in the late 1950's). Although one or t\110 large spinning combines
resulted from the pre-war groupings, the weaving sector remained highly fragmented and many small spinning concerns continued to compete within the industry. The existence of excess capacity and the associated dangel" of 11Cut-throat" (=marginal cost) pricing ~·tere vtidely regarded as deterremts to re-equipment ,.,;thin the industry. The view that such re-equipment \<Jas essential to the stabilisation of the cotton industry found expression in the Cotton Industry Act 1959.
Under this legislation, tht Government compensated firms for scrappage of machinery with additional grants to companies c~asing to trade in the textile industry. It also subsidised the purchase of·~ew equipment. In total £17.1 millions ~Jere paid out for scrappage and £13.4 millions for re-equipment. The number of firms in the cottcn spinning and weaving industries fell
(
1 5
TABLE
16 :
THE STRUCTURE .OF THE COTTON INDUSTRY 1958~63Analysis of companies with at least 100 employees and engaged in the spinning and/or weaving of cotton and/or man-made fibres:
1958 1963
Size of firm No. of Total Net No. of Total Net
No. of firms Empt. Output firms Empt. Output
employees) (OOOs) (£mill) (OOOs) {fmill)
100-499 379 81.3 48.6 223 51.1 40.9
500-999 58 41.7 20.9 34 24.3 17.3
000-4999 38 73.7 41.3 26 54.0 45.5
000
&
over 7 63.9 38.6 6 56.6 49.8TOTAL 48? 260.6 149.4 289 185.9 153.5
Sourc~: Census of Production, 1963
Neither the wool textile nor the hosiery and kn1~wear industries underwent the degree of reorganisation W11ich took place in cotton in the early 1960s. In both sub-sectors (as was shown in Table 15 ) there was a preponderance of very small firms.
All three sub-sectors were much more fragmented than manufacturing industry as a whole and this fragmented structure contrasted with the virtual duo-poly already existing in the supply of man-made fibres. Five-firm
30
TABLE 17: FIVE FIRM CONCENTRATION RATIOS 1958, 1963 and 1968
Man-made fibres
Finished thread for sewing etc. Single cotton or m.m.f. spun yarn Doubled cotton or· m.m.f. spun yarn Woven cotton cloth
Woven m.m.f. cloth
Wool tops
Yarn of animal hair or m.m.f. - spun on woollen system
- spun on worsted system
Woven woollen fabric Woven worsted fabric
Knitted fa~ri cs Socks, stockings etc Unden1ear and shirts
Source: Census of Production
Combined sales of five largest firms as % of total sales of selected products.
1958 1963 1~68
n.a. 99.9 100.0
n.a .. 81.8 87.9
31.9 37.2 50.3
34.9 41.7 47 01
11.6 19.3 31.2
21.1 35.8 51.9
30.1 34.0 54.7
26.7 26.0 33.9
25.8 32.9 40.2
12.0 15.1 24.0
17.3 26.7 31.0
30.2 34.7 43.2
21.4 20.1 43.3
25.6 39.5 53 •. ,
From this table it can be seen that for a number of products the combined market share of the five largest firms increased by more than ten per c:enc of the total market. These were single yarns spun on the cotton system, woven cotton and man-made fibre cloths, wool tops (for worsteds), socks and
B.
HORIZONTAL AND VERTICAL INTEGRATION
Although some activities have remained vertically integrated since the early nineteenth century (for example woollen blanket manufacture), the textile industries were mainly organised on a horizontal basis for the first 60 years of this century. In the cotton and worsted industries separate
firms carried out most of the top-making (worsted), spinning, weaving and fir.ishing. Intermediate processes such as winding or beaming, sizing or yarn-dyeing \~ere, in wany cases, a 1 so carried out on a commission bas; s by specialists in each process.
The predominantly horizontal structure of the cotton industry developed in the later part of the nineteenth century, and was due to economies of long production runs in spinning and the need for variety of yarns in weaving of all but the plainest of fabrics. Except for some companies with a large output of a limited range of standard cloths (e.g. surgical gauze), integrated mills remain exceptional. Even in such mills it is usual practice to sell some yarn to other weavers and to purchase yarn from other spinners. Vertical integration under these conditions is economic only \'/hen the firm concerned is sufficiently large to control several spinning mills and thereby combine product variety with long runs.
Another deterrent, of increasing importance, to vertical integration between small firms in the cotton industry during the 1960's was the growing proportion of yarn sold to knitters and other n~n-weavers, most of them located outside the Lancashire area. In 1957 weavers absorbed 74 per cent of spun yarn produced within the United Kingdom;
by 1967 the proportion had fallen to 58 per cent.1
1
In the woollen industry the difference between woollen and worsted production is quite pronounced. In the manufacture of woollen fabrics the majority of \-.reaving concerns spin their o~tm yarn; this has been attributed 2 to the importance of raw material blending to the quality and profitability of woollen cloth. In 1967, 68 per cent of ~10ollen yarns produced by companies engaged predominantly within the industry went into weaving. The other main demand was from carpet manufacturers. {Some carpet manufacturers spun part of their own yarn requirements). Those wool spinning firms which were not engaged also in weaving were mainly concerned with carpet yarns.
In worsted spinning vertical integration is less economic because only about 40 per cent of worsted yarn goes into weaving, the rest going into knitwear, hand knitting and (to a lesser extent than woollen yarns) carpets. The worsted weaver also requires a variety of yarns and, as in the cotton industry, there is a contrast between economies of long 'uns in worsted top making and yarn spinning on the one hand and s;~a 11 er machine units and variety of yarn inputs in weaving on the other.
In both the cotton and wool textile industries the traditional practice was for cloth to be sold to merchants or 11Converters".
Forwcrd integration by textile firms into made-up clothing, household textiles or industrial products remained exceptional and the majority of producers were, therefore, at least one stage removed from the manufacture of the final consumer product.
This separation from the final market subjected manufacturers to a number of
disadvantages:-1) fluctuations in demand resulting from inventory adjustments of merchants and retailers
2) a tendency for some customers to switch to imported fabrics and to market products made from these under the same brand names as similar products made from U.K. cloths
2 W. S. Atkins and Partners: The Strategic Future of the Wool Textile·
Industry, NEDO 1969.
3) weak bargaining power in dealings with multiple retailers dominating certain parts of the consumer textile market -shirts, men's underv1ear and nightwear, children's wear, made-to-measure suits are some examples. Large groups could take advantage of the fragmented structure of the U.K. industries and the facility for importation
4) inability to use advertising and sales promotion to influence the final purchaser
5) inability to influence the choice between knitted and woven fabrics in the making-up of household textiles and clothing.
Conclusions on vertical integration }n the 1960's
(1) In the "cotton" industry the need for long production r•Jns in
spinning and yarn variety in many kinds of weaving meant that integration would be economic only fa~ very large enterprises, able to combine
economies of scale with variety.
(2) The future size of the "cotton" industry depended partly upon links with the final market through forward integration. Control over both weaving and knitting capacity would be a further safeguard against fashion changes between these two types of fabric production.
(3) In the wool industry vertical integration in woollen spinning and weaving was traditional but worsted spinning and weaving remained separate partly because of the importance of yarn sales to activities other than weaving and partly because of the need for variety of yarn in worsted weaving. The industry's needs for links with final customers
was similar
to that of the cotton industry though the industry was34
C. CONCENTRATION AMONG CUSTOr,fERS
The fragmented textile processing industries of the early 19601s were facing
increasing concentration among customers. An oligopsony situation existed not only for industrial products such as tyre cord, ~1hich went to a small number of tyre producers, but also for products sold by multiple retail1ers. Such products include many kinds of knitwear, shirts, unden~ear, hosie~v,
men•s suits and certain household textiles.
The percentages of total retail turnover in 1966 accounted for by multiples with 10 or more establishments were as
follows:-Household textiles and soft furnishings 25
Men • s and boys • wear 46
Women•s, girls' ard infants• wear and other
drapery goods 40
Source: Census of Djstribution 1966
(The use of these broad categories conceals the concentration of retail sales of individual items.)
Reliance on a sma11 number of major customers often selling under their own brand names gives certain advantages to suppliers in economies of long production runs, elimination of marketing and administrative overheads. Some alleged disadvantages have been discussed hoth with textile producers and with large multiple
Some retailers have decided to buy in the United Kingdom as a matter of long tenn policy, others buy overseas if cost savings are significant and if the volume is sufficient to cover costs of communication with overseas suppliers. Such communication is least important in the case of less expensive products in regular demand and not subject to fashion changes (e.g. working clothes and children•s playclothes). Some retailers who currently import much of their fabric expressed the view that imports are 1 ikely to represent a progressively lo~·Jer proportion of cloth and garment consumj:'tion because of the devaluation of sterling, high rates of inflation in certain Far Eastern countries and the reductions in costs now (1975) being achieved in the U.K. text·i"!es industry. The impact of quotas and implications of existing and potential import restrictions for reliability of supply are additional influences. Opposite factors
include availrtbility of cheaper fibres enjoyed by some Far Eastern producers (including p0lyester fibres exported at marginal cost prices by U.S. and European producers) and increasing willingness on the part of U.K. garment producers, including some within textile groups, to find overseas supplies of fabrics. ·r~.is is examined again in Section V.
(2) There was almost universal concern among manufacturers about the downward pressure on prices of knitted garments, fabrics and yarns imposed by the large customers. A number o+ producers agreed with the retailers• own argument that this pressure reflected competition between retailerso Those retailers with a "buy British" policy were competing with other large retailers and with independent shops where imported garments have their main outleto One textile manu-facturer bemoaned the fact that his cost reductions \'Jere passed on to the ultimate consumer, on the grounds that this threatened the long-term stability of the industry.
36
payment. Among the large retailers consulted during the study there seemed to be some recognition of the problems which their low-inventory policy created for suppliers. (This recognition was
confinned by the suppliers themselves.) As~istance with cash floW' difficulties, placing of alternative orders for immediate delivery
and payment for garments and cloth ordered but not yet accepted were among policies adopted by different firms. One major retaile,r explained that there is a conflict of interests:- the manufacturer would like a definite order well in advance of a firm delivery date after which payment would be prompt; the retailer, especially in this fashion-influenced trade, wishes to maintain maximum flexibility. The need to establish good communications with suppliers provides some pressure towards loyalty on the part of the large retailers and
towards a compromise between these conflicting objectives.
Investment in the share capita 1 of supp 1 i ers remains exception a 1 and appf~ars to be confined to only one of the large retail groups. Although the comments of both mn.nufac1 ~t"·ers and retai 1 ers showed that trade between them was
affected by long~r-tenn considerations, there is little doubt that the~ dominance of large retailers has motivated some of the changes in the structure of the textile industry since the early l96~'s. When well over· half of the· output of a textile firm goes to one customer with whom there is no financial or other tie and when those goods represent as little as 5 per cent of the customer•s supplies, bargaining must be uneven. (One large retailer insists that its purchases must not account for more than
one-third of any suppliers output of the product concerned .. to avoid 11
moral constraints11 on freedom to place subsequent orders., Another firm aims; to
make suppliers significantly but not excessively dependent. Some dependence is regarded as necessary to ensure supplies during periods of boom, when other orders may become more profitable than contracts with retailers.)
One of the !lOlicies adopted by some large textile firms to counter the power of multiple chain-stores has been the sale of branded apparel and household textiles. The practical difficulties of developing brands while at the same time supplying similar items for sale under the retailers' labels are discussed at greater length in the comments on product groups in Section
v.
Important preconditions for br~nding are size (to achieve~ economies of marketing) and vertical integration (to ensure quality).D.
THE ROLE OF THE LARGE FIBRE PRODUCERS
By 1960, the production of man-made fibres in the United Kingdom was dominated by Courtaulds and I.C.I. Courtaulds was (and remains) the dominant producer of cellulosic fibres {rayon and acetate), while I.C.I. was developing polyesters as well as producing nylon in a joint venture with Courtaulds. Courtaulds was also developing acrylic fibres.
An abortive attempt by IaC.I. to take over Courtaulds in 1961-2 (described in Apoendix F). led to the exchange of I.C.I.'s holding of Courtaulds1 equity plus £10m. for Courtaulds' 50 per cent interest in the joint rylon subsidiary (British Nylon Spinners Ltd.) in 1964. Since that date
Courtaulds has developed its own nylo·1 production and are currently increasing output of polyesters. Approximate shares of U.K. production of major fibres in 1972 were as
follows:-Courtaulds I.C.I. Others
Cellulosic Rayon 100
Acetate 80 20
Synthetics Nylon 20 60 20
Polyester 5 80 15
Acrylics 60 40
The strong position of Courtaulds and I.C.I. in the U.K. market for man-made fibres could prove irrelevant if the textile industries which used those fibres were to go on contracting as a result of declining exports and increased penetration of the U.K. market by impcrts. The cotton
industry in particular appeared very vulnerable. Fragmented, horizontally organised, naving failed to take full advantage of assistance with
re-equipment, the Lancashire industry faced l3rge customers who could buy their textile fabrics at lower cost overseas.