A Longitudinal Study funded by the DfEE
department for
education and skills
Technical Paper 6
Characteristics of the
Centres in the EPPE Sample:
Observational Profiles
The Effe
ctiv
e Provi
sio
n of Pre
-School
Educ
atio
n (EPP
E) Pro
jec
The Effective Provision of Pre-School
Education [EPPE] Project
A longitudinal Study funded by the DfES
(1997 – 2003)
Technical Paper 6
Characteristics of the Centres in the EPPE Sample:
Observational Profiles
Address for correspondence:
EPPE Project
University of London
Institute of Education Tel:+44 (0) 207 612 6219
Technical Paper 6
C
HARACTERISTICS OF THE
C
ENTRES IN THE
EPPE
S
AMPLE
:
O
BSERVATIONAL
P
ROFILES
A
UTHORS
:
Kathy Sylva
Iram Siraj-Blatchford
Edward Melhuish
Pam Sammons
Brenda Taggart
Emma Evans
Anne Dobson
Marjorie Jeavons
Katie Lewis
Maria Morahan
Sharon Sadler
A
CKNOWLEDGEMENT
T
HE
EPPE
R
ESEARCH
T
EAM
Principal Investigators
Professor Kathy Sylva
Department of Educational Studies, University of Oxford
Professor Edward Melhuish
Birkbeck, University of London
Professor Pam Sammons
Institute of Education, University of London
Professor Iram Siraj-Blatchford
Institute of Education, University of London
Research Co-ordinator
Brenda Taggart
Institute of Education, University of London
Regional Research Officers
Anne Dobson
Isabella Hughes
Marjorie Jeavons
Margaret Kehoe
Katie Lewis
Maria Morahan
Sharon Sadler
First Published in September 1999 by the Institute of Education University of London 20 Bedford Way, London WC1H OAL
Pursuing Excellence in Education
ISBN 085473 596 8
Printed by Formara Ltd. Southend on Sea. Essex.
Contents
Page Number
Overview of the Project
1-10
Executive Summary
i
Assessing Pre-School Environments
1
Methods
2
Rating Scales: the Early Childhood Environment Rating Scale (ECERS-R)
and the English Extension (ECERS-E)
2
Procedure
2
Inter-observer reliability
5
Sample of regions and centres
6
Summary of the different types of provision
7
Results
7
Distribution of the scores and an overview of the sub-scales
8
A descriptive profile of the two settings: playgroups and nursery classes
10
A comparison of pre-school environments according to type of provision
11
The focus on curriculum in ECERS-E
16
Focus on combined centres
20
Variation within types of provision
21
The Relationship between ECERS-R and ECERS-E
23
ECERS- R and ECERS-E factor analysis
23
Global dimensions of quality
23
Comparison between types of provision on the two dimensions
27
Discussion
28
Relating this study to previous research
28
Profiles found in difference types of provision
29
Appropriateness of ECERS-R and ECERS-E
29
References
30
Effective Provision of Pre-school Education
“EPPE”
Overview of the Project
This series of 12 reports describes the research on effective pre-school provision funded by the UK Department for Education & Employment (DfEE). Further details appear in Technical Paper 1 (Sylva, Sammons, Melhuish, Siraj-Blatchford & Taggart 1999). This longitudinal study assesses the attainment and development of children followed longitudinally between the ages of 3 and 7 years. Three thousand children were recruited to the study over the period January 1997 to April 1999 from 141 pre-school centres. Initially 114 centres from four types of provision were selected for the study but in September 1998 an extension to the main study was implemented to include innovative forms of provision, including ‘combined education and care’ (Siraj-Blatchford et al. 1997).
Both qualitative and quantitative methods (including multilevel modelling) have been used to explore the effects of individual pre-school centres on children's attainment and social/behavioural development at entry to school and any continuing effects on such outcomes at the end of Key Stage 1 (age 7). In addition to centre effects, the study investigates the contribution to children’s development of individual and family characteristics such as gender, ethnicity, language, parental education and employment. This overview describes the research design and discusses a variety of research issues (methodological and practical) in investigating the impact of pre-school provision on children’s developmental progress. A parallel study is being carried out in Northern Ireland.
There have been many initiatives intended to improve educational outcomes for young children. Will these initiatives work? Will they enable children to enter school ‘more ready’ to learn, or achieve more at the end of Key Stage 1? Which are the most effective ways to educate young children? The research project described in this paper is part of the new emphasis on ensuring ‘a good start’ for children.
P
REVIOUS
R
ESEARCH ON THE
E
FFECTS OF
E
ARLY
E
DUCATION IN THE
UK
There has been little large-scale, systematic research on the effects of early childhood education in the UK. The ‘Start Right’ Enquiry (Ball 1994; Sylva 1994) reviewed the evidence of British research and concluded that small-scale studies suggested a positive impact but that large-scale research was inconclusive. The Start Right enquiry recommended more rigorous longitudinal studies with baseline measures so that the ‘value added’ to children’s development by pre-school education could be established.
2
occurred. To date no research using multilevel models (Goldstein 1987) has been used to investigate the impact of both type of provision and individual centre effects. Thus little research in the UK has explored whether some forms of provision have greater benefits than others. Schagen (1994) attempted multilevel modelling but did not have adequate control at entry to pre-school.
In the UK there is a long tradition of variation in pre-school provision both between types (e.g. playgroup, local authority or private nursery or nursery classes) and in different parts of the country reflecting Local Authority funding and geographical conditions (i.e. urban/rural and local access to centres). A series of reports (House of Commons Select Committee 1989; DES Rumbold Report 1990; Ball 1994) have questioned whether Britain's pre-school education is as effective as it might be and have urged better co-ordination of services and research into the impact of different forms of provision (Siraj-Blatchford 1995). The EPPE project is thus the first large-scale British study on the effects of different kinds of pre-school provision and the impact of attendance at individual centres.
O
VERVIEW OF
R
ESEARCH
M
ETHODS
The EPPE project is a major study instituted in 1996 to investigate three issues which have important implications for policy and practice:
• the effects on children of different types of pre-school provision,
• the ‘structural’ (e.g. adult-child ratios) and ‘process’ characteristics (e.g. interaction styles) of more effective pre-school centres, and
• the interaction between child and family characteristics and the kind of pre-school provision a child experiences.
An educational effectiveness research design was chosen to investigate these topics because this enabled the research team to investigate the progress and development of individual children (including the impact of personal, socio-economic and family characteristics), and the effect of individual pre-school centres on children's outcomes at both entry to pre-school (the start of Reception which children can enter between the ages of 4 and 5 plus) and at the end of Key Stage 1 (age 7 plus). Such research designs are well suited to social and educational research with an institutional focus (Paterson & Goldstein 1991). The growing field of school effectiveness research has developed an appropriate methodology for the separation of intake and school influences on children's progress using so called 'value added' multilevel models (Goldstein 1987, 1995). As yet, however, such techniques have not been applied to the pre-school sector, although recent examples of value added research for younger ages at the primary level have been provided by Tymms et al. 1997; Sammons & Smees 1998; Jesson et al. 1997; Strand 1997; and Yang & Goldstein 1997. These have examined the relationship between baseline assessment at reception to infant school through to Key Stage 1 (age 7 plus years).
School effectiveness research during the 1970s and 1980s addressed the question "Does the particular
school attended by a child make a difference?" (Mortimore et al. 1988; Tizard et al. 1988). More
The 8 aims of the EPPE Project
• To produce a detailed description of the 'career paths' of a large sample of children and their families between entry into pre-school education and completion (or near completion) of Key Stage 1.
• To compare and contrast the developmental progress of 3,000+ children from a wide range of social and cultural backgrounds who have differing pre-school experiences including early entry to Reception from home.
• To separate out the effects of pre-school experience from the effects of education in the period between Reception and Year 2.
• To establish whether some pre-school centres are more effective than others in promoting children's cognitive and social/emotional development during the pre-school years (ages 3-5) and across Key Stage 1 (5-7 years).
• To discover the individual characteristics (structural and process) of pre-school education in those centres found to be most effective.
• To investigate differences in the progress of different groups of children, e.g. second language learners of English, children from disadvantaged backgrounds and both genders.
• To investigate the medium-term effects of pre-school education on educational performance at Key Stage 1 in a way which will allow the possibility of longitudinal follow-up at later ages to establish long-term effects, if any.
• To relate the use of pre-school provision to parental labour market participation.
The sample: regions, centres and children
In order to maximise the likelihood of identifying the effects of individual centres and also the effects of various types of provision, the EPPE sample was stratified by type of centre and geographical location.
• Six English Local Authorities (LAs) in five regions were chosen strategically to participate in the research. These were selected to cover provision in urban, suburban and rural areas and a range of ethnic diversity and social disadvantage. (Another related project covering Northern Ireland was instituted in April 1998 [Melhuish et al. 1997]. This will enable comparison of findings across different geographical contexts.)
• Six main types of provision are included in the study (the most common forms of current provision; playgroups, local authority or voluntary day nurseries, private day nurseries, nursery
schools, nursery classes, and centres combining care and education. Centres were selected
randomly within each type of provision in each authority.
In order to enable comparison of centre and type of provision effects the project was designed to recruit 500 children, 20 in each of 20-25 centres, from the six types of provision, thus giving a total sample of approximately 3000 children and 140 centres1. In some LAs certain forms of provision are less common and others more typical. Within each LA, centres of each type were selected by stratified random sampling and, due to the small size of some centres in the project (e.g. rural playgroups), more of these centres were recruited than originally proposed, bringing the sample total to 141 centres and over 3000 children.
1
4
Children and their families were selected randomly in each centre to participate in the EPPE Project. All parents gave written permission for their children to participate.
In order to examine the impact of no pre-school provision, it was proposed to recruit an additional sample of 500 children pre-school experience from the reception classes which EPPE children entered. However in the five regions selected a sample of only 200+ children was available for this ‘home’ category.
The progress and development of pre-school children in the EPPE sample is being followed over four years until the end of Key Stage 1. Details about length of sessions, number of sessions normally attended per week and child attendance have been collected to enable the amount of pre-school education experienced to be quantified for each child in the sample. Two complicating factors are that a substantial proportion of children have moved from one form of pre-school provision to another (e.g. from playgroup to nursery class) and some will attend more than one centre in a week. Careful records are necessary in order to examine issues of stability and continuity, and to document the range of pre-school experiences to which individual children can be exposed.
Child assessments
Around the third birthday, or up to a year later if the child entered pre-school provision after three, each child was assessed by a researcher on four cognitive tasks: verbal comprehension, naming vocabulary, knowledge of similarities seen in pictures, and block building. A profile of the child’s social and emotional adjustment was completed by the pre-school educator who knew the child best. If the child changed pre-school before school entry, he or she was assessed again. At school entry, a similar cognitive battery was administered along with knowledge of the alphabet and rhyme/alliteration. The Reception teacher completed the social emotional profile.
Further assessments were made at exit from Reception and at the end of Years 1 and 2. In addition to standardised tests of reading and mathematics, information on National Assessments will be collected along with attendance and special needs. At age 7, children will also be invited to report themselves on their attitudes to school.
Measuring child/family characteristics known to have an impact on children’s
development
1) Information on individual ‘child factors’ such as gender, language, health and birth order was collected at parent interview.
2) Family factors were investigated also. Parent interviews provided detailed information about parent education, occupation and employment history, family structure and attendance history. In addition, details about the child's day care history, parental attitudes and involvement in educational activities (e.g. reading to child, teaching nursery rhymes, television viewing etc) have been collected and analysed.
Pre-school Characteristics and Processes
researchers interviewed centre managers on: group size, child staff ratio, staff training, aims, policies, curriculum, parental involvement, etc.
‘Process’ characteristics such as the day-to-day functioning within settings (e.g. child-staff interaction, child-child interaction, and structuring of children's activities) were also studied. The Early Childhood Environment Rating Scale (ECERS) which has been recently adapted (Harms, Clifford & Cryer 1998) and the Caregiver Interaction Scale (Arnett 1989) were also administered. The ECERS includes the following sub-scales:
• Space and furnishings • Personal care routines • Language reasoning • Activities
• Interaction
• Programme structure • Parents and staffing
In order that the more educational aspects of English centres could be assessed, Sylva, Siraj-Blatchford, Taggart & Colman (unpublished) developed four additional ECERS sub-scales describing educational provision in terms of: Language, Mathematics, Science and the Environment, and Diversity.
Setting the centres in context
In addition to describing how each centre operated internally, qualitative interviews were conducted with centre managers to find out the links of each setting to local authority policy and training initiatives. Senior local authority officers from both Education and Social Services were also interviewed to find out how each local authority implemented Government early years policy, especially the Early Years Development Plans which were established to promote education and care partnerships across providers in each local authority.
Case Studies
In addition to the range of quantitative data collected about children, their families and their pre-school centres, detailed qualitative data will be collected using case studies of several “effective” pre-school centres (chosen retrospectively as ‘more effective’ on the basis of the multilevel analyses of intake and outcome measures covering the period baseline to entry into reception). This will add the fine-grained detail to how processes within centres articulate, establish and maintain good practice.
6
Analytic Strategy
The EPPE research was designed to enable the linking of three sets of data: information about children's attainment and development (at different points in time), information about children's personal, social and family characteristics (e.g. age, gender, SES etc), and information about pre-school experience (type of centre and its characteristics).
Identifying individual centre effects and type of provision at entry to school
Longitudinal research is essential to enable the impact of child characteristics (personal, social and family) to be disentangled from any influence related to the particular pre-school centre attended. Multilevel models investigate the clustered nature of the child sample, children being nested within centres and centres within regions. The first phase of the analysis adopts these three levels in models which attempt to identify any centre effects at entry to reception class.
Given the disparate nature of children's pre-school experience it is vital to ensure that the influences of age at assessment, amount and length of pre-school experience and pre-school attendance record are accounted for when estimating the effects of pre-school education. This information is also important in its own right to provide a detailed description of the range of pre-school provision experienced by different children and any differences in the patterns of provision used by specific groups of children/parents and their relationship to parents' labour market participation. Predictor variables for attainment at entry to reception will include prior attainment (verbal and non-verbal sub scales), social/emotional profiles, and child characteristics (personal, social and family). The EPPE multilevel analyses will seek to incorporate adjustment for measurement error and to examine differences in the performance of different groups of children at entry to pre-school and again at entry to reception classes. The extent to which any differences increase/decrease over this period will be explored, enabling equity issues to be addressed.
After controlling for intake differences, the estimated impact of individual pre-school centres will be used to select approximately 12 ‘outlier’ centres from the 141 in the project for detailed case studies (see ‘Case Studies’ above). In addition, multilevel models will be used to test out the relationship between particular process quality characteristics of centres and children's cognitive and social/behavioural outcomes at the end of the pre-school period (entry to school). The extent to which it is possible to explain (statistically) the variation in children's scores on the various measures assessed at entry to reception classes will provide evidence about whether particular forms of provision have greater benefits in promoting such outcomes by the end of the pre-school period. Multilevel analyses will test out the impact of measures of pre-school process characteristics, such as the scores on various ECERS scales and Pre-School Centre structural characteristics such as ratios. This will provide evidence as to which measures are associated with better cognitive and social/behavioural outcomes in children.
Identifying continuing effects of pre-school centres at KS1
T
HE
L
INKED
S
TUDY IN
N
ORTHERN
I
RELAND
1998-2003
The Effective Pre-school Provision in Northern Ireland (EPPNI) is part of EPPE and is under the directorship of Professor Edward Melhuish, Professor Kathy Sylva, Dr. Pam Sammons, and Dr. Iram Siraj-Blatchford. The study explores the characteristics of different kinds of early years provision and examines children’s development in pre-school, and influences on their later adjustment and progress at primary school up to age 7 years. It will help to identify the aspects of pre-school provision which have a positive impact on children’s attainment, progress, and development, and so provide guidance on good practice. The research involves 70 pre-school centres randomly selected throughout Northern Ireland. The study investigates all main types of pre-school provision attended by 3 to 4 year olds in Northern Ireland: playgroups, day nurseries, nursery classes, nursery schools and reception groups and classes. The data from England and Northern Ireland offer opportunities for potentially useful comparisons.
S
UMMARY
8 EPPE Technical Papers in the Series
Technical Paper 1 – An Introduction to the Effective Provision of Pre-School Education (EPPE) Project
ISBN: 0 85473 591 7 Published: Autumn 1999 Price £3.50
Technical Paper 2 – Characteristics of the Effective Provision of Pre-School Education (EPPE) Project sample at entry to the study ISBN: 0 85473 592 5 Published: Autumn 1999 Price £4.00
Technical Paper 3 – Contextualising EPPE: Interviews with Local Authority co-ordinators and centre managers ISBN: 0 85473 593 3 Published: Autumn 1999 Price £3.50
Technical Paper 4 – Parent, family and child characteristics in relation to type of Pre-School and socio-economic differences ISBN: 0 85473 594 1 Published: Autumn 1999 Price £4.00
Technical Paper 5 – Report on centre characteristics in the EPPE Study : (Interviews)
ISBN: 0 85473 595 X Published: Autumn 2000 Price £5.00
Technical Paper 6 – Characteristics of the Centres in the EPPE Sample: Observational Profiles ISBN: 0 85473 596 8 Published: Autumn 1999 Price £5.00 Technical Paper 6A – Characteristics of Pre-School Environments
ISBN: 0 85473 597 6 Published: Autumn 1999 Price £3.50
Technical Paper 7 – Social/behavioural and cognitive development at 3–4 years in relation to family background ISBN: 0 85473 598 4 Published: Spring 2001 Price £5.00
Technical Paper 8a – Measuring the Impact of Pre-School on Children's Cognitive Progress over the Pre-School Period ISBN: 0 85473 599 2 Published : Autumn 2002 Price £8.00
Technical Paper 8b – Measuring the Impact of Pre-School on Children's Social Behavioural Development over the Pre-School Period ISBN: 0 85473 684 2 Publication Date: Spring 2003
Technical Paper 9 – Report on age 6 assessment ISBN: 0 85473 600 X Publication Date: Summer 2003
Technical Paper 10 – Case Studies ISBN: 0 85473 601 8 Publication Date: Summer 2003
Technical Paper 11 – Report on the continuing effects of pre-school education at age 7
ISBN: 0 85473 602 6 Publication Date: Autumn 2003
Technical Paper 12 – The final report ISBN: 0 85473 603 4 Publication Date: Spring 2004
The Early Years Transition and Special Educational Needs (EYTSEN) is a linked project which draws on data from the EPPE study . EYTSEN Papers :
Technical Paper 1 – Special needs across the Pre-School Period ISBN 085473 680 8
Published Autumn -2002 Price £6.00 Technical Paper 2 – Special needs in the Early Years at Primary School ISBN 085473 681 6
Publication Date Summer 2003.
Technical Paper 3 – Special needs in the Early Years : The Parents’ Perspective ISBN 085473 682 4 Publication Date Summer 2003.
Ordering information
The Bookshop at the Institute of Education. 20, Bedford Way. London WC1H OAL. Tel: 00 44 (0) 207 612 6050 Fax: 0207 612 6407 Email: [email protected]
website: www.johnsmith.co.uk/ioe
or The EPPE Office. The University of London, Institute of Education. 20 Bedford Way, London. WC1H OAL. U.K. Tel: 00 44 (0) 207 612 6219 Fax: 00 44 (0) 207 612 6230 Email: [email protected]
Website: http://www.ioe.ac.uk/projects/eppe
R
EFERENCES
Arnett, J. (1989) Caregivers in Day-Care Centres: Does training matter? Journal of Applied Developmental Psychology, 10, 541-552.
Ball, C. (1994) Startright: The Importance of Early Learning, London: RSA.
Borge, A., & Melhuish, E., (1995) A Longitudinal Study of Childhood Behaviour Problems, Maternal Employment and Day-care in Rural Norwegian Community, International Journal of Behavioural Development, 18, 23-42.
Davies, J. & Brember, I. (1992) The Effects of Gender, Attendance Period and Age on Children's Adjustment to Nursery Classes, Research in Education, 47, 89-103.
Davies, J, & Brember, I. (1997) The Effects of Pre-School Experience on Reading Attainment: a four year cross-sectional study, Educational Psychology, 178, 3, 255-266.
Department of Education & Science (1990) The Report of the Committee of Inquiry into the Quality of the Educational Experience offered to 3- and 4-year olds (Rumbold, A), London: HMSO.
Feinstein, L., Robertson, D. & Symons, J. (1998) Pre-school Education and Attainment in the NCDS and BCSI Centre for Economic Performance, London
Goldstein, H. (1987) Multilevel Models in Educational and Social Research, London: Charles Griffin and Co.
Goldstein, H. (1995) Multilevel Statistical Models (2nd Edition), London: Edward Arnold.
Goldstein, H. & Sammons, P. (1997) The Influence of Secondary and Junior Schools on Sixteen Year Examination Performance: A Cross-Classified Multilevel Analysis, School Effectiveness and School Improvement, 8, (2): 219-230.
Harms, T., Clifford, R. & Cryer, D. (1998) Early Childhood Environment Rating Scale Revised, New York and London: Teachers' College Press.
Hill, P. & Rowe, K. (1996) Multilevel Modelling in School Effectiveness Research, School Effectiveness and School Improvement, 7, (1): 1-34.
House of Commons Select Committee (1989) The Education of Children 3-5, London: HMSO.
Jesson, D., Bartlett, D., & Machon, C., (1997) Baseline Assessment and School Improvement - the use of data from the assessment of children on entry to school to support the raising of standards, paper presented to the annual conference of the British Educational Research Association, University of York, September 1997.
Luyten, H. (1994) Stability of School Effects in Dutch Secondary Education: The impact of variance across subjects and years, International Journal of Educational Research, 21, (2): 197-216.
Luyten, H. (1995) Teacher Change and Instability Across Grades, School Effectiveness and School Improvement, 1, (1): 67-89.
Melhuish, E.C. (1993) Pre-school care and education: Lessons from the 20th and the 21st century, International Journal of Early Years Education, 1, 19-32.
Melhuish, E.C., Lloyd, E., Martin, S. & Mooney, A. (1990) Type of day-care at 18 months: ii Relations with Cognitive and Language Development, Journal of Child Psychology and Psychiatry, 31, 861-870.
10
Mortimore, P., Sammons, P., Stoll, L., Lewis, D. & Ecob, R. (1988) School Matters: The Junior Years, Wells: Open Books.
National Institute of Child Health & Development (1997) The effects of infant child care on infant-mother attachment security: Restuls of the NICHD study of early child care, Child Development, 68, (5): 860-879.
Paterson, L. & Goldstein H. (1991) New statistical methods of analysing social structures: an introduction to multilevel models, British Educational Research Journal, 17, (4): 387-393.
Sammons, P. (1996) Complexities in the judgement of school effectiveness. Educational Research and Evaluation, Vol. 2 113 – 149
Sammons, P. & Smees, R. (1998) Measuring Pupil Progress at Key Stage 1: using baseline assessment to investigate value added. School Leadership and Management, Vol. 18, No. 3, pp.389 – 407
Schweinhart, L.J. & Weikart, D.P., (1997) Lasting Differences, The High/Scope preschool curriculum comparison through age 23. High/Scope Press, Ypsilanti, Michigan.
Siraj-Blatchford, I. (1995) Expanding Combined Nursery Provision: Bridging the gap between care and education, in P Gammage and J Meighan The Early Years: The Way Forward, Nottingham: Education New Books.
Siraj-Blatchford, I., Sylva, K., Melhuish, E. & Sammons, P. (1997) Studying the Effects of Innovations in Nursery School Provision, a proposal to the DfEE for research linked to the Effective Provision of Pre-school Education Project
Strand, S. (1997) Pupil Progress during Key Stage 1: A value added analysis of school effects, British Educational Research Journal, 23, (4): 471-487.
Sylva, K., Sammons, P., Melhuish, E., Siraj-Blatchford, I. & Taggart, B. (unpublished) Technical Paper 1. An Introduction to the EPPE Project
Sylva, K., Siraj-Blatchford, I., Taggart, B. & Colman, P. (forthcoming) The Early Childhood Environment Rating Scales: 4 Curricular Subscales, London: Institute of Education.
Sylva, K. (1994) A Curriculum for Early Learning. In Ball, C. (Ed.) Startright: The Importance of Early Learning, London: RSA.
Sylva, K. & Wiltshire, J. (1993) The Impact of Early Learning on Children's Later Development. A review prepared for the RSA enquiry 'Start Right', European Early Childhood Education Research Journal, 1, (1): 17-40.
Tizard, P., Blatchford, P, Burke, J., Farquhar, C. & Plewis, I. (1988) Young Children at School in the Inner City, Hove: Lawrence Erlbaum Associates Ltd.
Tymms, P., Merrell, C. & Henderson, B. (1997) The First Year at School: A quantitative Investigation of the Attainment and Progress of Pupils, Educational Research and Evaluation, 3, (2): 101-118.
Characteristics of the Centres in the EPPE Sample:
Observational Profiles
E
XECUTIVE
S
UMMARY
The EPPE project investigates the characteristics of early childhood education and care through a variety of research methods; this paper reports on just two instruments. A ‘centre profile’ was created for each centre through systematic observation and questions to staff. The Early Childhood Environment Rating Scale: Revised (ECERS-R) was used in drawing up each centre’s profile along with an extension to it based on the Desirable Learning Outcomes (ECERS-
English Extension). The ECERS-R rating scale consisted of seven sub-scales which provide an overview of the pre-school environment, covering aspects of the setting from furnishings to individuality of care and the quality of social interactions (described more fully later). The ECERS-E describes the curriculum within the pre-school, including areas such as mathematics and literacy. Each sub-scale is comprised of a range of items describing ‘quality’ of the specific type of provision. Each item was rated 1 (inadequate) to 7 (excellent). The ECERS-R and ECERS-E are one approach to describing the ‘processes’ through which children are cared for and educated.
There are other important sources of information excluded here such as adult–child ratio, unit cost per child, and management of the centre. A fuller analysis of centres in the EPPE research will require the linking of the findings reported here with parent interview data, centre manager interview data and child outcome data when children enter reception class. This will occur in later papers in this series.
This paper describes the characteristics of the 141 centres attended by 3 and 4 year-old children in the EPPE sample. Averaged across all the centres, provision in the sample approached ‘good’ on the ECERS-R but the curricular profile developed for England (ECERS-E) showed that the learning opportunities in maths and science were limited and sometimes inadequate. However overall scores on ECERS indicate similar quality for much provision in England with that in other industrialised countries.
Considering type of provision, the LEA centres (nursery schools, nursery classes and nursery schools combined with care) had scores in the good-to-excellent range. Social services daycare were next, nearing the good range. However the playgroups and private day nurseries were consistently found to have scores in the ‘minimal/adequate’ range. These differences in quality are similar to recent Ofsted reports on variation in the quality of pre-school provision (Ofsted, 1999) and to a recent study using ECERS on 44 pre-school centres in London by Lera, Owen and Moss (1996).
This large sample of pre-school centres from different regions in England shows great variation in the curriculum and care on offer, the pedagogical strategies seen in interactions between children and staff, and in the resources available for children’s play and learning. Comparisons between types suggest that a ratio of 1:8 as found in the private and voluntary sector do not guarantee high standards by themselves and that ratios of 1:13 in the LEA sector are not associated with low quality. However, the issue of ratio is inevitably confounded with type of preschool and other variation associated with type, e.g. qualifications of staff
A
SSESSING
P
RE
-
SCHOOL
E
NVIRONMENTS
Researchers have been debating for years about the concept of ‘quality’ in early childhood education and care. Judgement of quality involves values and what is a ‘high quality’ centre to one parent may be quite low in the eyes of a local authority officer or indeed another parent. Munton, Mooney and Rowland’s (1995) have suggested that there are six dimensions of quality: effectiveness, acceptability, efficiency, access, equity and relevance. The main thrust of the EPPE study (see technical paper 1) is on the ‘effectiveness’ aspect of quality as defined by Munton and his colleagues. Munton et al. (1995) further identified three basic dimensions in describing the early years setting. These are the structure which includes both facilities and human resources; the educational and care processes which children experience every day; and the outcomes or the longer term consequences of the education and care the child receives. The observational measures described in this technical paper focus on educational and care processes but also include some structure in their description of quality. That dimension of quality which relates to the outcomes for children will be addressed in later
papers in the EPPE series.
One of the most widely used observational measures for describing the characteristics of early childhood education and care is the Early Childhood Environment Rating Scale (ECERS, now revised; Harms, Clifford & Cryer 1998). The revised ECERS-R has 43 items which are divided into 7 sub-scales. These sub-scales are space and furnishing, personal care routines, language and reasoning, activities, social interactions, organisation and routines, adults working together. Each item is rated on a 7 point scale (1 = inadequate, 3 = minimal/adequate, 5 = good, 7 = excellent). Completion of the ECERS usually involves approximately one day of observation, as well as talking to the staff about aspects of the routine which were not visible during the observation session (for example, weekly swimming or seasonal outings). The word ‘environment’ in the rating scale is taken in its broadest sense to include social interactions, pedagogical strategies and relationships between children as well as adults and children. Matters of pedagogy are very much to the fore in ECERS-R. For example the sub-scale Organisation and Routine has an item ‘Schedule’ which gives high ratings to a balance between adult-initiated and child-initiated activities. In order to score a 5 the centre must have ‘a balance between structure and flexibility’ but a 7 requires ‘variations to be made in the schedule to meet
individual needs, for example a child working intensively on a project should be allowed to continue past the scheduled time’. Further attention to pedagogy can be found in the item Free Play where to earn a 5 centres must have ‘free play occurring for a substantial portion of the day/session both indoors and outdoors’ Although entitled ‘Environmental Rating Scale’ the ECERS-R describes processes of the educational and care environment even more than the physical space and materials on offer.
Construct validity for the original ECERS has been demonstrated in previous studies through its agreement with professional judgements and predictive validity through the results of child outcome measures applied to the 'graduates' of higher or lower quality provision (see Appendix A). Discriminant validity has been based on the ability of the items to distinguish between classrooms of varying quality which were assessed by trainers/experts. Reliability has been established in many studies carried out elsewhere on the ECERS and in general Kappa inter-rater agreement varies between .75 and .95. A summary of research papers on reliability and validity of the ECERS appears in Appendix A and reliability within the EPPE research is reported in the Methods section.
As the ECERS was developed in the United States of America and intended for use in both care and educational settings, the EPPE team thought it necessary to devise a second early childhood environment rating scale which was focused on provision in Britain as well as good practice in catering for diversity (Sylva et al., 1998). The ECERS-E was devised after wide consultation with experts and piloted extensively. The ECERS-E consists of 4 sub-scales: literacy, mathematics, science and environment, and diversity. Both the ECERS-R and the ECERS-E will be described as they were applied in 141 pre-school settings across five regions in England.
Both ECERS ratings were carried out by a senior research officer responsible for the region. The research officers had, in every instance, experience of assessing children for at least 6 months in the centre before carrying out the ECERS observation and ratings. Moreover, each observer put aside a full day to complete the ECERS. This was necessary because the two rating scales contained very detailed information about curricular provision, pedagogy, planning, resources and relationships.
M
ETHODS
Rating Scales: the Early Childhood Environment Rating Scale (ECERS-R)
and the English Extension (ECERS-E)
Each pre-school centre was assessed using the ECERS-R and its extension. The ECERS-R consists of 7 sub-scales; each sub-scale is composed of 4-10 individual items which describe the ‘quality’ of provision along a continuum centred on materials, facilities, pedagogy or social interactions. The ECERS-R sub-scales are listed below with their titles and items. In this study the wording of the ECERS-R was adjusted very slightly to conform to current language use in the U.K.. Minor changes to the sub-scale titles were made and these appear in brackets:
Space and furnishings – items 1-8
Personal care routines (Personal care practices) – items 9-14 Language and reasoning – items 15-18
Activities (Pre-school activities) – items 19-28 Interaction (Social interaction) – items 29-33
Programme structure (Organisation and routines) – items 34-37 Parents and staffing (Adults working together) – items 38-43
The ECERS-E consists of 4 sub-scales: Literacy – items 1-6
Mathematics – items 7-9
Science and environment – items 10-12 Diversity – items 13-15
The structure of the two environmental scales is presented on the following pages while examples of individual items in the ECERS-R and ECERS-E appear in Appendix B.
Procedure
Structure of the Environmental Rating Scale
I. Space and furnishings
1. Indoor space
2. Furniture for routine care, play and learning 3. Furnishings for relaxation and comfort 4. Room arrangement for play
5. Space for privacy 6. Child related display 7. Space for gross motor 8. Gross motor equipment
II. Personal care practices
9. Greeting/departing 10. Meals/snacks 11. Nap/rest
12. Toileting/diapering 13. Health practices 14. Safety practice
(Harms, T., Clifford, M. & Cryer, D., 1998)
III. Language and reasoning
15. Books and pictures
16. Encouraging children to communicate 17. Using language to develop reasoning skills 18. Informal use of language
IV. Pre-school activities
19. Fine motor 20. Art
21. Music/movement 22. Blocks
23. Sand/water 24. Dramatic play 25. Nature/science 26. Math/number
27. Use of TV, video, and/or computers 28. Promoting acceptance of diversity
V. Social interaction
29. Supervision of gross motor activities 30. General supervision of children (other than
gross motor) 31. Discipline
32. Staff-child interactions 33. Interactions among children
VI. Organisation and routines
34. Schedule
35. Free play (free choice) 36. Group time
37. Provisions for children with disabilities
VII. Adults working together
38. Provisions for parents
39. Provisions for personal needs of staff 40. Provisions for professional needs of staff 41. Staff interaction and cooperation
42. Supervision and evaluation of staff 43. Opportunities for professional growth
Ratings are to be assigned in the following way, taking into account exact indicators for each item (see Appendix B):
A score of 1 must be given if any indicator under 1 is scored “Yes”.
A rating of 2 is given when all indicators under 1 are scored “No” and at least half of the indicators under 3 are scored “Yes”.
A rating of 3 is given when all indicators under 1 are scored “No” and all indicators under 3 are scored “Yes”.
A rating of 4 is given when all requirements for 3 are met and at least half of the indicators under 5 are scored “Yes”.
A rating of 5 is given when all requirements for a 3 are met and all indicators under 5 are scored “Yes”.
A rating of 6 is given when all requirements for 5 are met and at least half of the indicators under 7 are scored “Yes”.
A rating of 7 is given when all requirements for a 5 are met and all indicators under 7 are scored “Yes”.
A score of NA (Not Applicable) may only be given for indicators or for entire items when permitted as shown on the scoresheet.
Structure of the Environmental Rating Scale - Extension
I. Literacy
1. ‘Environmental print’: Letters and words 2. Book and literacy areas 3. Adult reading with the
children
4. Sounds in words 5. Emergent writing/mark
making
6. Talking and Listening
II. Mathematics
7. Counting and the application of counting
8. Reading and writing simple numbers
9a. Mathematical Activities: Shape and space (select either 9a or 9b for evidence; choose the one which you observed most)
9b. Mathematical Activities: Sorting, matching and comparing
III. Science and Environment
10. Natural materials
11. Areas featuring science/science resources
12a. Science Activities: Science processes: Non Living (select one of a, b, c for evidence; choose one you observed most) 12b. Science Activities: Science
processes: Living processes and the world around us 12c. Science Activities: Science
processes: Food preparation
IV. Diversity
13. Individual learning needs 14. Gender equity
15. Multicultural Education
(Sylva, K., Siraj-Blatchford, I., Taggart, B., & Colman, P., 1998)
Ratings are to be assigned in the following way, taking into account exact indicators for each item (see Appendix B):
A score of 1 must be given if any indicator under 1 is scored “Yes”.
A rating of 2 is given when all indicators under 1 are scored “No” and at least half of the indicators under 3 are scored “Yes”.
A rating of 3 is given when all indicators under 1 are scored “No” and all indicators under 3 are scored “Yes”.
A rating of 4 is given when all requirements for 3 are met and at least half of the indicators under 5 are scored “Yes”.
A rating of 5 is given when all requirements for a 3 are met and all indicators under 5 are scored “Yes”.
A rating of 6 is given when all requirements for 5 are met and at least half of the indicators under 7 are scored “Yes”.
A rating of 7 is given when all requirements for a 5 are met and all indicators under 7 are scored “Yes”.
A score of NA (Not Applicable) may only be given for indicators or for entire items when permitted as shown on the scoresheet.
Occasionally centre records were consulted as evidence for rating an item. There were a number of items in the ECERS-R and –E which were not relevant for the centres in this sample, e.g. provision for ‘nap/rest’ was only considered to be relevant in 27 out of the 141 centres. Where items were not appropriate the item was excluded from further analysis, i.e. sub-scale scores were calculated from only the items which were scored/relevant. Inter-observer reliability was established to be of a high standard.
Inter-observer reliability
Before using observational rating scales in research it is necessary to establish inter-observer agreement. Good levels of agreement depend on a sound choice of instruments and good researcher training. EPPE observers spent many days in each centre before formal observation began. All research officers were trained extensively on the observational instruments and research officer from the University of Cardiff acted as the ‘standard’ in a reliability exercise. In each region five centres were observed by the regional research officer and the person acting as ‘standard’. Each centre was observed and rated over the course of a whole day. At the end of the day the two observers who had independently scored the ECERS-R and ECERS-E compared their scores on the same observations. Hence reliability was established for two instruments in 25 centres chosen randomly throughout the regions.
The reliability for each pair of observers was computed on the basis of:
a) where each observer scored exactly the same point on a scale (% exact agreement) b) a Kappa value was computed. Kappa is a statistic which measures the degree of
agreement between two observers while allowing for the level of ‘chance’ agreement. The Kappa statistic is computed by the following formula:
Kappa = Ro – Rc 1 – Rc where Ro = proportion agreement observed
Rc = proportion agreement that would occur by chance
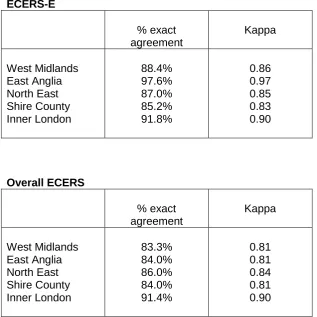
The reliability figures broken down by ECERS-R, ECERS-E and combined ECERS for the 5 regions can be seen below.
ECERS
% exact agreement
Kappa
West Midlands East Anglia North East Shire County Inner London
82.0% 78.2% 85.5% 83.6% 91.4%
ECERS-E
% exact agreement
Kappa
West Midlands East Anglia North East Shire County Inner London
88.4% 97.6% 87.0% 85.2% 91.8%
0.86 0.97 0.85 0.83 0.90
Overall ECERS
% exact agreement
Kappa
West Midlands East Anglia North East Shire County Inner London
83.3% 84.0% 86.0% 84.0% 91.4%
0.81 0.81 0.84 0.81 0.90
The results of this exercise indicated good to excellent inter-observer reliability in all regions.
Sample of regions and centres
[image:22.595.51.369.60.377.2]The five regions in EPPE were strategically chosen to represent urban, suburban, and rural areas and also to include neighbourhoods with social and ethnic diversity. All local authorities in the EPPE sample were divided into five sampling areas, usually geographic divisions that already existed. Official lists of playgroups, nursery classes, nursery schools, private day nurseries, social services/voluntary day nurseries, and nursery schools combining care and education were obtained with the help of the local early years co-ordinators in every authority. Within each sampling area, one of each type of provision was randomly selected, yielding approximately 25 centres of various types in each region. Some over- and under-sampling occurred in each category of provision because not all authorities had sufficient numbers of local authority day nurseries. The ECERS observations were carried out in each of the 141 centres in the full EPPE sample in the period May 1998 – June 1999. The final sample of centres can be seen in Table 1.
Table 1. Pre-school sample for main analysis
Type of provision N
Nursery Classes 25
Playgroups 34
Private day nurseries 31
Local authority centres 24
Nursery schools 20
Summary of the different types of provision
For the main analysis pre-schools were divided into six types. 1. Local Education Authority nursery classes (n=25)
These are part of primary schools, have an adult:child ratio of 1:13, (one in every two adults is normally a 4 year graduate qualified teacher and the other adult has had 2 years childcare training) and usually offer only half-day sessions in term time, 5 days/week.
2. Voluntary playgroups and / or pre - schools (n=34)
These have an adult:child ratio of 1:8, (training of adults is variable from none to graduate level. The most common type of training is based on short Pre-school Learning Alliance courses). All offer sessional provision in term time. Many children attend fewer then 5 days/week. Playgroups usually have fewer resources (facilities, materials and sole use of space) than other types of centres.
3. Private day nurseries (n=31)
These have an adult:child ratio of 1:8, (normally the adults have a two-year childcare training, but some have less training). All offer full day care for payment.
4. Local authority (day care) centres (n=24)
These came from the social services day care tradition, although in recent years many have come under the authority of the LEA. Thirteen in this group combined care and education with one teacher per centre or a peripatetic teacher shared with other centres. Eleven centres have not officially incorporated education into care. The ratio is 1:8, (normally the adults have a two-year childcare training. The combined centres have a small input from a teacher), and all offer full day care.
5. Nursery schools (n=20)
These are ‘traditional’ nursery schools under the LEA with adult:child ratios of 1:13, (the headteacher would be a 4 year graduate qualified teacher with an early years background, other staff would reflect nursery classes in training), usually offering half-day provision. One in this group was an ‘Early Excellence Centre’.
6. Nursery schools combining education and care (n=7)
These are similar to nursery schools but have developed their provision of extended care to include full day care and parent involvement. They would have adult:child ratio of 1:13, (staffing would be the same as nursery schools for the over 3s). Even though these centres were chosen as a stratified random sample four in this group were ‘Early Excellence Centres’.
R
ESULTS
A score for each sub-scale was calculated for the ECERS-R and the ECERS-E using the following equation:
Sub-scale score = Sum of scores for each (applicable) item in the sub-scale Number of items scored
Distribution of scores and an overview of the sub-scales
[image:24.595.60.383.231.457.2]The total ECERS-R and total ECERS-E scores were normally distributed (see Figures 1 and 2 respectively) and met parametric assumptions. Analysis of Variance (ANOVA) tests with Tukey’s HSD post hoc tests were employed to compare differences between types of centres for total ECERS-R and ECERS-E scores. Furthermore, with one exception, the mean sub-scale scores were normally distributed and therefore ANOVA and Tukey’s HSD tests were also employed in the analysis of the sub-scales. The exception to this is the ECERS-E science and environment sub-scale. As the parametric assumptions are not satisfied for this sub-scale, Kruskal-Wallis tests were used to explore the differences, and Mann-Whitney tests were used to test the significance of pair-wise comparisons and these will be reported later.
[image:24.595.59.375.467.725.2]Figure 1. Histogram of total ECERS-R scores
Figure 2. Histogram of total ECERS-E scores
6.75 6.50 6.25 6.00 5.75 5.50 5.25 5.00 4.75 4.50 4.25 4.00 3.75 3.50 3.25 3.00 2.75 2.50 2.25 2.00 20 10 0
Std. D ev = 1.02 Mean = 4.34 N = 141.00
5.75 5.50 5.25 5.00 4.75 4.50 4.25 4.00 3.75 3.50 3.25 3.00 2.75 2.50 2.25 2.00 1.75 1.50 1.25 1.00 16 14 12 10 8 6 4 2 0
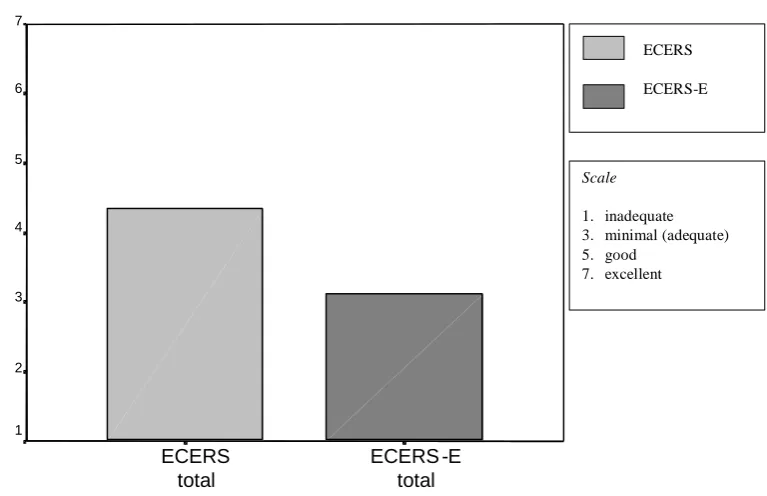
Figure 3 shows the means for the ECERS-R and the new scale based on Desirable Learning Outcomes, ECERS-E. The ECERS-R scores tend towards the top of the ‘adequate’ range and sometimes approach ‘good’. The ECERS-E scores are more disappointing with provision for mathematics, science and diversity hovering around 'minimal' ratings. Note that these means are not weighted by proportion of children attending each type of provision.
Figure 3. Mean ECERS-R and ECERS-E scores
Figure 4 breaks down the two scales into their sub-scale components. The highest scores are found in 'social interactions', ‘organisation and routines’ and 'space and furnishings' while the lowest scores are seen in 'personal care', ‘pre-school activities’. Although the ratings averaged across all types of provision are broadly satisfactory, closer inspection within types of provision reveals some striking differences. In this sample many centres were found to be exciting places where children were challenged and supported in their learning and where the interactions between staff and children were sensitive and enabling. Unfortunately, other centres were characterised by hasty planning and poor implementation of the curriculum.
ECERS -E total ECERS
total
7
6
5
4
3
2
1
ECERS
ECERS-E
Scale
1. inadequate 3. minimal (adequate) 5. good
[image:25.595.63.447.153.401.2]Figure 4. ECERS-R and ECERS-E sub-scale scores
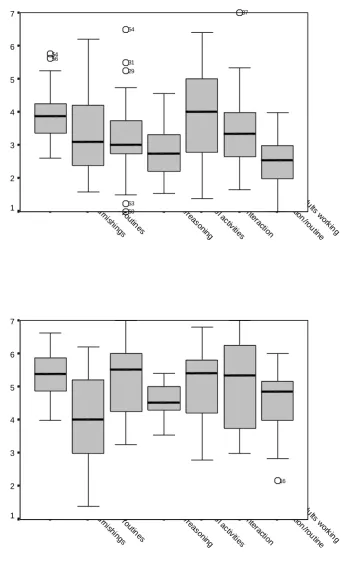
A descriptive profile of two settings: playgroups and nursery classes
As playgroups and nursery classes are the types of provision most commonly attended by 3 and 4-year-olds in England their ECERS-R profiles will be explored (see Figure 5). Playgroup provision is highest on the ‘social interaction’ sub-scale followed closely by 'space and furnishings'. They are weakest on ‘adults working together’. Nursery classes also have their highest scores in 'social interactions' and 'space and furnishings' but they also have very good scores in 'language and reasoning' and 'organisation and routines'. Taken all together the nursery classes have higher scores overall when compared to playgroups and particular strength in language/reasoning and organisation/routine.
The comparative profiles of playgroups and nursery classes are similar to those found in an earlier study in London by Lera et al. (1996) who studied the ECERS profiles of 44 centres. Compared to Lera and colleagues, in this study playgroups were rated at a slightly lower level, but the particular strengths and weakness were the same. For example, the playgroups in this sample scored most highly on ‘social interaction’, and in Lera the social sub-scale was very high.
Div ers ity Sc ien ce /env iro nm ent M ath em atics Lite racy A dults w ork ing O rg an isa tio n/R ou tine So cia l Inte
ra ction Pre sc ho ol A ctiv ities Language/ Reas oni ng Ca re ro utin es Sp ac e/F urn ish ings 7 6 5 4 3 2 1 ECERS ECERS-E Scale
1. inadequate
3. minimal (adequate) 5. good
Figure 5. Box-plots of ECERS-R scores for playgroups (top) and nursery classes (bottom)
A comparison of pre-school environments according to type of provision
We turn now to the analyses on differences in the environment according to type of provision. Figure 6 shows that the three types of provision managed by the LEA had significantly higher scores for total ECERS-R when compared to other types of provision. A one-way ANOVA
Ad ults w
orkin g O rg an isa tio n/rou tine So cia l in tera ction Pres ch oo l a ctiv ities La ng ua ge /re as on ing C are ro utin es Sp ac e/furn ish in gs 7 6 5 4 3 2 1 37 53 50 29 31 54 56 54 Ad ults w
revealed that there were pre-school differences in the total ECERS-R scores (F 5,135 = 29.01, p<.001). Post hoc tests were carried out to identify exactly which pre-school types differed significantly from each other (see Appendix C). Local authority day centres, nursery classes, nursery schools and combined centres all had significantly higher scores than playgroups and private day nurseries. Additionally private day nurseries had a significantly higher total ECERS-R score than playgroups, and local authority centres had significantly lower total ECERS-R scores than nursery schools and combined centres.
We shall now consider ECERS-R sub-scales which focus specifically on aspects of the educational and care environment experienced by children and staff. Some sub-scales focus more on facilities while others describe pedagogical practices and the ways adults and children interact with one another in a purely social way. The pedagogy is described in terms of the balance between child-initiated activity and adult-led activities.
[image:28.595.65.516.470.737.2]The trends seen in the ECERS-R total scores are fairly consistent throughout the sub-scale scores (see Figures 7-13). Of the six pre-school types, playgroups had the lowest mean sub-scale score for all 7 sub-sub-scales; private day nurseries had the second lowest mean sub-sub-scale scores for all sub-scales except language and reasoning in which they were rated slightly higher than local authority day nurseries. Nursery classes, nursery schools and combined centres were rated consistently high on all the sub-scales. One-way ANOVAs revealed that there were significant pre-school differences for 6 out of the 7 sub-scales (see Appendix D). (No significant pre-school differences were found in personal care routines.) Tukey’s post hoc tests were again performed to identify which types of pre-school differed significantly from each other. The Tukey test results show that, in terms of quality measured on ECERS-R, the LEA provision generally scored highest followed by Local Authority day care, then private day nurseries, and finally playgroups. Although the pattern of significant pair-wise differences varied slightly across the sub-scales, in general post-hoc tests were similar to the Tukey test results for the total ECERS-R scores.
Figure 6. Total ECERS-R scores by pre-school type
combined centr e nursery school
local authority pr ivate day nursery
playgroup nursery class
7
6
5
4
3
2
1
Scale
1. inadequate
3. minimal (adequate) 5. good
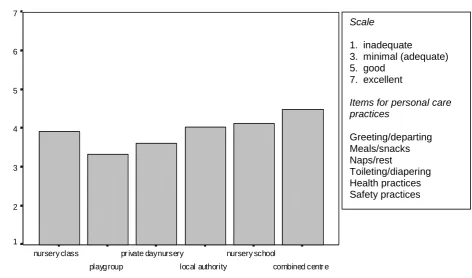
Figure 7. Space and furnishings by pre-school type
Figure 8. Personal care practices by pre-school type
combined centre nursery school
local authority private day nursery
playgroup nursery class
7
6
5
4
3
2
1
combined centr e nursery school
local authority pr ivate day nursery
playgroup nursery class
7
6
5
4
3
2
1
Scale
1. inadequate
3. minimal (adequate) 5. good
7. excellent
Items for personal care practices
Greeting/departing Meals/snacks Naps/rest
Toileting/diapering Health practices Safety practices
Scale
1. inadequate
3. minimal (adequate) 5. good
7. excellent
Items for space and furnishings
Indoor space
Furniture for routine care, play, and learning Furnishing for relaxation and comfort
Room arrangement for play
Space for privacy Child-related display Space for gross motor play
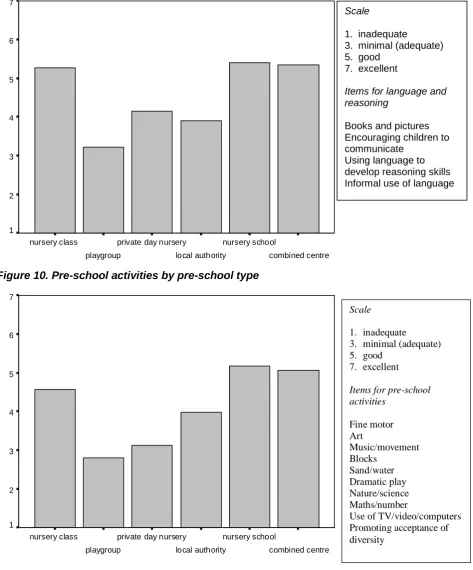
Figure 9. Language and reasoning by pre-school type
Figure 10. Pre-school activities by pre-school type
combined centre nursery school
local authority private day nursery
playgroup nursery class
7
6
5
4
3
2
1
Scale
1. inadequate
3. minimal (adequate) 5. good
7. excellent
Items for language and reasoning
Books and pictures Encouraging children to communicate
Using language to develop reasoning skills Informal use of language
combined centre nursery school
local authority private day nursery
playgroup nursery class
7
6
5
4
3
2
1
Scale
1. inadequate
3. minimal (adequate) 5. good
7. excellent
Items for pre-school activities
Fine motor Art
Music/movement Blocks
Sand/water Dramatic play Nature/science Maths/number
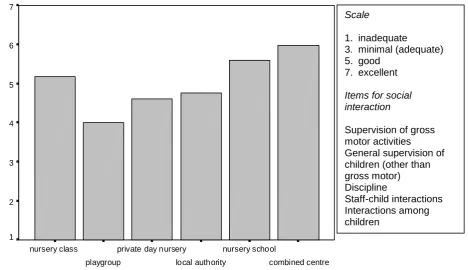
Figure 11. Social interaction by pre-school type
Figure 12. Organisation and routines by pre-school type
combined centre nursery school
local authority private day nursery
playgroup nursery class
7
6
5
4
3
2
1
Scale
1. inadequate
3. minimal (adequate) 5. good
7. excellent
Items for social interaction
Supervision of gross motor activities General supervision of children (other than gross motor) Discipline
Staff-child interactions Interactions among children
combined centre nursery school
local authority private day nursery
playgroup nursery class
7
6
5
4
3
2
1
Scale
1. inadequate
3. minimal (adequate) 5. good
7. excellent
Items for organisation and routine
Schedule Group time
Figure 13. Adults working together by pre-school type
Of the six pre-school types, nursery classes, nursery schools and combined centres were rated consistently higher on all the sub-scales compared to other forms of provision. Playgroups had the lowest mean sub-scale score for all 7 sub-scales; private day nurseries had the second lowest mean sub-scale scores for all sub-scales except language and reasoning in which they were significantly higher than local authority day nurseries. Statistical tests revealed that there were significant differences for 6 out of the 7 sub-scales according to type of provision. (No significant pre-school differences were found in personal care routines.) The fine-grained statistical testing shows that there are broad bands in terms of quality measured on ECERS-R with the LEA provision always scoring highest followed by Local Authority day care, then private day nurseries, and finally playgroups.
The focus on curriculum in ECERS-E
The total ECERS-E scores for the 6 types of provision show an almost identical trend to the ECERS-R scores (see Figure 14). Playgroups and private day nurseries are rated lowest, nursery schools and nursery schools combining care and education are rated highest on most sub-scales. Total ECERS-E scores were found to differ significantly (F 5,135 = 31.76, p<.001) and post hoc Tukey tests were employed to identify precise pair-wise differences (see Appendix E). The results were almost identical to those found for the ECERS-R: LEA nursery classes, nursery schools and nursery schools combining care and education score most highly, significantly higher than playgroups and private day nurseries. Local authority (day care) centres score significantly more highly than playgroups, but not private day nurseries (this difference was significant for total ECERS-R scores); local authority (day care) centres also score significantly lower than both nursery schools and nursery schools combining care and education. Additionally, private day nurseries score significantly higher than playgroups, and centres combining care score significantly higher than nursery classes.
combined centre nursery school
local authority private day nursery
playgroup nursery class
7
6
5
4
3
2
1
Scale
1. inadequate
3. minimal (adequate) 5. good
7. excellent
Items for adults working together
Provisions for parents Provisions for personal needs of staff
Provisions for professional needs of staff
Staff interaction and cooperation
Figure 14. Total ECERS-E scores by pre-school type
LEA nursery classes, nursery schools and nursery schools combining care and education score most highly, significantly higher than playgroups and private day nurseries. Local authority (day care) centres score significantly higher than playgroups, but not private day nurseries; local authority (day care) centres also score significantly lower than both nursery schools and
nursery schools combining care and education. Additionally, private day nurseries score significantly higher than playgroups, and centres combining care score significantly higher than nursery classes.
Moving away from total scores to sub-scale scores, ANOVAs on all four ECERS-E sub-scales show that there were significant differences according to type of provision (Kruskal-Wallis tests were used to analyse the Science and Environment sub-scale as it was not normally distributed; see Appendix F for test results). Nursery schools and nursery schools combining care and education are consistently rated more highly than playgroups and private day nurseries (see Figures 15-18).
combined centre nursery school
local authority private day nursery
playgroup nursery class
7
6
5
4
3
2
1
Scale
1. inadequate
3. minimal (adequate) 5. good
Figure 15. Literacy by pre-school type
Figure 16. Mathematics by pre-school type
combined centre nursery school
local authority private day nursery
playgroup nursery class
7
6
5
4
3
2
1
Scale
1. inadequate
3. minimal (adequate) 5. good
7. excellent
Items for literacy
‘Environmental print’ Letters and words Book and literacy areas Adult reading with the children
Sounds in words Emergent writing/mark making
Talking and listening
combined centre nursery school
local authority private day n