R E S E A R C H A R T I C L E
Open Access
Allele discovery of ten candidate drought-response
genes in Austrian oak using a systematically
informatics approach based on 454
amplicon sequencing
Andreas Homolka
*, Thomas Eder, Dieter Kopecky, Maria Berenyi, Kornel Burg and Silvia Fluch
Abstract
Background:Rise of temperatures and shortening of available water as result of predicted climate change will impose significant pressure on long-lived forest tree species. Discovering allelic variation present in drought related genes of two Austrian oak species can be the key to understand mechanisms of natural selection and provide forestry with key tools to cope with future challenges.
Results:In the present study we have used Roche 454 sequencing and developed a bioinformatic pipeline to process multiplexed tagged amplicons in order to identify single nucleotide polymorphisms and allelic sequences of ten candidate genes related to drought/osmotic stress from pedunculate oak (Quercus robur) and sessile oak (Q. petraea) individuals. Out of these, eight genes of 336 oak individuals growing in Austria have been detected with a total number of 158 polymorphic sites. Allele numbers ranged from ten to 52 with observed heterozygosity ranging from 0.115 to 0.640. All loci deviated from Hardy-Weinberg equilibrium and linkage disequilibrium was found among six combinations of loci.
Conclusions:We have characterized 183 alleles of drought related genes from oak species and detected first evidences of natural selection. Beside the potential for marker development, we have created an expandable bioinformatic pipeline for the analysis of next generation sequencing data.
Background
White oaks are native to Europe, Asia, North Africa and North America, and include sessile oak, pedunculate
oak, pubescent oak (Q. pubescens) and bur oak (Q.
macrocarpa) among their most prominent species [1]. About two percent of the Austrian forests harbour oak
trees which correspond to an area of 66,000 hectare. Q.
petraeaand Q. roburare the predominant species while Q. cerris (Turkey oak) and Q. pubescens play only a minor role [2]. In Austria as well as in Europe oak spe-cies colonize huge areas with vastly differing climatic conditions.
Rise of temperatures and shortening of available water as result of predicted climate change will impose signifi-cant pressures on long-lived forest tree species like
European white oak. According to the latest predictions, we expect the average global surface temperature to in-crease by a maximum of 6.4°C within the next 90 years [3] leading to a higher frequency of severe drought events. But it is well known that different species diverge in their ability to resist drought induced damages and even within a species there is tremendous variability [4,5]. Inter- as well as intraspecific allelic diversity is the key element of a plants potential to adapt to a changing environment and tolerance towards drought stress. There is an increased demand for molecular tools helping to de-scribe these variations and to prepare forestry for future challenges.
Molecular markers are the first choice for plant research and breeding [6]. Using them as landmarks, genetic maps can be established and subsequently used for identifi-cation of traits controlled by different genes (quantita-tive trait loci). Marker assisted selection provides * Correspondence:[email protected]
Health and Environment Department, AIT Austrian Institute of Technology, Tulln, A-3430, Austria
breeders with an efficient tool for identifying desired phenotypes in large populations. Beside their use in breeding, molecular markers are highly valuable for population genetics permitting evolutionary studies and population structure interference.
Single nucleotide polymorphisms (SNPs) are com-monly used for functional diversity assessment. Although they are highly abundant in the human genome and every SNP locus could potentially serve as utile marker, there are still few studies dealing with a high number of SNPs in plants [7]. Latest advances in human and animal genome analysis have created several sophisticated tech-nologies which are capable to analyze millions of SNPs in reasonable time and with low costs [6] and can be eas-ily transferred to applications in plants. SNP discovery technologies include bioinformatic mining of expressed sequence tag (EST) databases [8], array based methods [9], comparison of whole genomes [10] and the applica-tion of next generaapplica-tion sequencing (NGS) for amplicon resequencing [11]. Recently developed sequencing tech-nologies summarized as next generation sequencing have already replaced traditional methods for detecting poly-morphisms in genomes [12].
Roche 454 sequencing technology [13] is based on sin-gle strand amplification with emulsion polymerase chain reaction followed by pyrosequencing. Average read-lengths of around 400 bp and high achievable coverage makes this technology well suited for discovery of SNPs and even detection of rare alleles. Short oligonucleotide barcodes can be used to tag individual sequences and en-able the parallel analysis of several targets which has been successfully demonstrated in different species [14-16]. Multiplexing capabilities enable large studies includ-ing several hundred individuals with a high coverage for each sample. Therefore extensive cloning procedures to identify both haplotypes of diploid individuals as used in Sanger sequencing or generation of inbred lines [17] can be avoided. Bioinformatic haplotype interference with parsimony [18] or maximum-likelihood methods [19] is no longer necessary because each haplotype will be cov-ered by a sufficient number of reads. The present paper describes the discovery and characterization of alleles in ten drought stress related genes originating from two oak species growing in Austria based on multiplex 454 amplicon sequencing and the development of a bioinfor-matic analysis pipeline.
Results
Processing of 454 sequencing data
Raw data with a total number of 253,630 reads comprising 57.8 Mbp with an average length of 227.85 bp was deliv-ered by the sequencing company (Table 1). Average 454 quality score of the provided sequences was 22.95 (median 25.19) with a maximum of 37.93 and a minimum of 5.50.
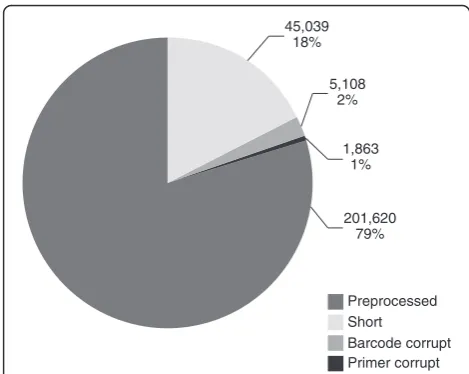
We removed 45,039 reads shorter than 90 bp (Figure 1) with an average length of 67.93 bp. A total number of 298 sequences longer than 420 bp with an average length of 447.21 bp and a maximum of 705 bp were trimmed. Aver-age 454 quality score after removal of long and short sequences increased to 27.78 (median 28.24). Barcode sequences were not readable in 5,108 reads which were therefore discarded. Additionally we identified 1,863 reads with corrupt internal primers which were excluded from further analysis (Figure 1). After preprocessing 201,620 reads consisting of 53 Mbp sequence information with an average length of 230.35 bp remained for allele detection (Table 1).
During homopolymer (HP) correction in SCARF [20] 17,287 additional reads were removed because the soft-ware was not able to align them to the Sanger reference [21]. On average 18 individuals per locus were removed from the analysis (Table 2) because of technical errors including incorrect amplification, short reads, read qual-ity and corrupted barcodes or internal primers. A
max-imum number of 28 lost individuals was found inBMY7
while inPIP1Ewe only lost 7 individuals.
Polymorphic sites and allele identification
Within the sequences of GLP3Awe detected more than
2 alleles per individual. A minimum number of one allele and a maximum number of 12 alleles per individual with
an average of 2.6 were found.GLP3Awas excluded from
further analysis because we suspected the amplification of a gene family or pseudogenes. Including individuals with less than four reads covering 70 % of the Sanger reference 65,181 reads were removed from the 201,620 reads remaining after preprocessing. Due to low coverage an average number of 18 individuals had to be excluded from further analysis with a maximum number of 99 in
DHN2 and a minimum number of two found in LEA14
and PER64(Table 2).DHN2 was not included in the fur-ther analysis because we considered the number of indivi-duals lost due to low coverage (99) as too high. Excluding
DHN2, the average percentage of recovered individuals
was 92.3%. On average each gene fragment was covered by 46.09 reads. In total we detected 158 polymorphic sites [SNPs and Insertions/Deletions (InDels)] among the eight remaining candidate genes (Table 3) with an average of 19.75 sites per gene. The highest number was found in LEA14 and LTP (34), whereas a minimum number of seven polymorphic sites was detected in PER64. On aver-age 6.7 polymorphic sites occur each 100 bp with a
mini-mum of 2.8/100 bp in ARF16 and a maximum of 13.7/
100 bp inLTP. We found an average number of 22 alleles
per gene with a maximum of 52 inBMY7and a minimum
of ten in ARF16, PER64 and RD26. The total number of
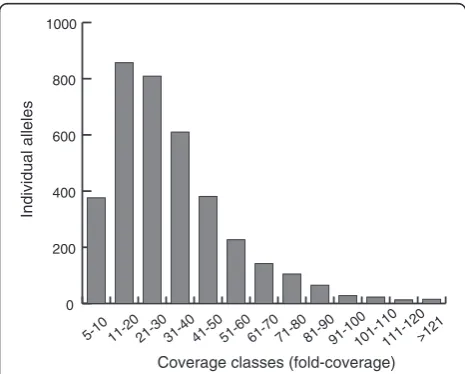
Additional file 1. Each allele of an individual was covered by an average of 32.64 reads (median 28, Figure 2). Total number of effective alleles was 23.561 with a minimum of
1.253 (RD26), a maximum of 6.656 (BMY7) and a mean
value of 2.945 (Table 3). Values for expected heterozygosity ranged from 0.202 (RD26) to 0.851 (BMY7) with an aver-age number of 0.545. Regarding observed heterozygosity, a
minimum of 0.115 in RD26and a maximum of 0.640 in
LEA14was detected. The mean value of observed hetero-zygosity was found to be 0.347. In all genes expected het-erozygosity exceeded the observed. All loci showed significant departure from Hardy-Weinberg expectations (HWE, Guo and Thompson’s exact test [P<0.05]). Null alleles were present in a high frequency (above 5%) in all loci observed. Tests for linkage disequilibrium (LD) revealed significant disequilibrium (P<0.01) within six pairwise combinations of loci (Additional file 2: Table S2).
Discussion
Several studies describe the in silico detection of SNPs from the growing amount of EST data available [22,23]. However this approach is likely to be biased by the small number of individuals coming from a limited amount of populations [24]. To overcome this limitation we made use of high throughput sequencing techniques and a bio-informatic pipeline. 454 Sequencing technology developed by Roche has been chosen to analyze coding regions of drought responsive candidate genes. The main of advan-tage of this technique is the high number of reads gener-ated leading to adequate coverage of each allele. Major drawbacks include the preferential amplification of short sequences and the high abundance of reading errors after homopolymer stretches. To cope with these problems we have developed a highly customizable pipeline which inte-grates preprocessing, statistics and error correction for 454 amplicon sequencing data and can be used to resolve mul-tiplexed samples and to detect variants in a large number of sequences.
[image:3.595.55.548.101.248.2]Different studies based on molecular markers have been conducted in oak. But the majority was investigating the
Table 1 Comparison between raw data and preprocessed reads
Pool Received Preprocessed
Number of reads Base pairs (Mbp) Average length Number of reads Base pairs (Mbp) Average length
Oak 1 30,207 5.72 189.45 22,826 5.11 200.96
Oak 2 38,797 8.55 220.43 29,290 7.71 239.25
Oak 3 31,731 6.70 211.29 24,336 6.08 229.92
Oak 4 31,874 7.63 239.31 26,063 7.10 248.58
Oak 5 33,645 8.68 258.07 30,619 8.38 180.76
Oak 6 30,008 6.95 231.72 23,650 6.39 246.25
Oak 7 29,307 7.07 241.34 23,909 6.61 252.14
Oak 8 28,061 6.49 231.16 20,927 5.61 244.92
Total 253,630 57.80 227.85 201,620 52.98 230.35
Preprocessed Short
Barcode corrupt Primer corrupt 201,620
79% 1,863
1% 5,108
2% 45,039
18%
[image:3.595.55.290.492.679.2]Figure 1Distribution of all reads after preprocessing.Amount of reads lost due to technical reasons including sequences shorter than 90 bp, reads with corrupt barcode or primer and remaining reads are displayed.
Table 2 Recovery statistics and individual coverage
Gene Technical Coverage Remaining Average loss loss Individuals Reads coverage
ARF16 27 18 291 (86.6%) 9,327 32.05
BMY7 28 16 292 (86.9%) 13,189 45.17
DHN2 22 99 n.a. n.a. n.a.
ERD8 8 9 319 (94.9%) 11,941 37.43
LEA14 25 2 309 (92.0%) 16,102 52.11
LTP 18 5 313 (93.2%) 20,409 65.20
PER64 11 2 323 (96.1%) 22,628 70.06
PIP1E 7 4 325 (96.7%) 11,364 34.97
RD26 15 9 312 (92.9%) 9,898 31.72
Average 18 18 310 (92.3%) 14,357 46.09
[image:3.595.303.539.556.732.2]population history ofQuercusspp. [25] and hybridisation between Q. roburandQ. petraea [26]. Only Deroryet al. [27] and Quanget al.[28] used SNPs to assess allelic di-versity of candidate genes. So far, this is the first study which aimed at detecting alleles of drought stress related genes of oak. With the aid of the bioinformatic pipeline presented above were able to detect a total amount of 183 alleles within eight genes of 336 oak individuals growing in Austria. The amount of alleles is comparable to results from white spruce where 173 alleles were detected in six loci from 283 individuals growing in Al-aska [29]. The average number of 6.71 mutations per 100 bp is higher or at least in the same range than in other plant species. Frequencies of 2.96 to 3.70, 3.85 or 3.83 to 7.30 have been discovered in maize [30], black poplar [31] and eucalyptus [16] which shows that the
number of mutations strongly varies between species and gene analyzed. A high level of heterozygosity is
present withinERD8andLEA14which points towards a
large amount of genetic variability. Regarding the large number of individuals sampled across the heterogenic climatic area of Austria, a high variability is expected es-pecially in genes likeERD8andLEA14which are directly involved in processes regulating drought response.
[image:4.595.57.540.99.253.2]The high number of discovered alleles will be used as valuable source for association studies between allele fre-quencies and environmental variables in connection with drought stress. SNPs discovered in this study can be used to describe the genetic diversity present in two Austrian oak species and to develop molecular markers for drought tolerance if natural selection can be proven for some loci. Significant deviation from Hardy-Weinberg equilibrium as well as lower values of observed heterozygosity than expected at all loci may be the first evidence for natural selection. The deviations could partly be a result of sam-pling, be explained by the presence of null alleles (Table 3) or might arise from selective pressure on the coding regions. Although varying among genes, low levels of observed heterozygosity and an excess of homozygotes at RD26support the latter hypothesis as well as the presence of linkage disequilibrium between some pairs of loci. This might either occur due to epistatic natural selection where favourable combinations of genes are linked and function together as supergenes [32] or several other factors in-cluding gene flow which is well documented among sev-eral oak species [27,33,34]. Present linkage between pairs of loci is the basis of association studies which can help to identify alleles occurring more frequently in plants exposed to dry conditions. Linkage between several loci of drought reactive genes is generally expected as drought response is under control of a huge regulatory network [35,36]. However, this approach is limited by the fact that rapid decay of LD is commonly observed in forest tree
Table 3 Polymorphisms detected
Gene S Na Ne Ho He Fn HWE Mutations/100 bp
ARF16 10 10 1.667 0.249 0.404 0.134 0.000 2.75
BMY7 19 52 6.656 0.481 0.851 0.189 0.030 5.97
ERD8 26 27 2.602 0.551 0.619 0.112 0.000 7.24
LEA14 34 49 5.079 0.640 0.803 0.095 0.000 12.23
LTP 34 13 2.849 0.260 0.648 0.228 0.000 13.71
PER64 7 10 1.817 0.209 0.444 0.182 0.000 3.37
PIP1E 15 12 1.638 0.274 0.391 0.111 0.000 4.79
RD26 13 10 1.253 0.115 0.202 0.115 0.000 3.61
Average 19.75 22.88 2.945 0.347 0.545 0.146 0.004 6.71
Total 158 183 23.561
S Number of polymorphic sites, Nanumber of alleles, Neeffective number of alleles, Hoobserved heterozygosity, Heexpected heterozygosity, Fnfrequency of null
alleles, HWE test for deviation from Hardy-Weinberg equilibrium (p-value)
0 200 400 600 800 1000
>121 111-120 101-110 91-100 81-90 71-80 61-70 51-60 41-50 31-40 21-30 11-20 5-10
Coverage classes (fold-coverage)
Individual alleles
[image:4.595.57.290.512.699.2]species [37,38] increasing the marker density needed for successful association studies.
Considering these findings, it points out clearly that the available dataset should be subject of further ana-lysis like decay of LD, estimation of genetic diversity or differentiation of populations. To evaluate if selective forces were acting, different neutrality test as well as de-tection of outlier loci will be necessary. To evaluate if these deviations were only generated by demographic processes the results should be related to neutral mar-kers like microsatellites found in chloroplasts (cpSSRs). If the presence of loci under selection and their associ-ation with climatic variables like temperature and pre-cipitation could be proven, development of molecular markers will be possible. Given the predicted climate change and the resulting pressure on sessile organisms, functional markers might be a valuable tool for forestry and a basis for marker assisted selection of drought tol-erant genotypes. Additional benefit arises from the fact that two different oak species were included in the ana-lysis. Although they are mainly sympatric,Q. petraeais
not as susceptible to drought induced damages as Q.
robur. If species specific alleles can be discovered and related to environmental conditions the genetic basis of this benefit may be revealed.
Conclusions
Given next generation sequencing data of ten drought stress related genes originating from different oak spe-cies growing in Austria, we were able to discover new SNPs and characterize 183 alleles. In order to obtain these results, we have developed a semiautomatic ana-lysis pipeline based on freely available tools and scripts. This pipeline can be fully automated and provided with a graphical user interface to make it more valuable for the scientific community. First analysis of the genetic data provides evidence of natural selection acting on the genes which makes them a target for future evolutionary studies and a potential source for molecular marker de-velopment. The alleles discovered will definitely help to understand drought adaptation processes acting in for-est tree species.
Availability of supporting data
The raw data supporting the results of this article are available in the Dryad repository, http://dx.doi.org/ 10.5061/dryad.83gf113b. The data sets supporting the results of this article are included within the article and its additional files.
Methods
Plant material and DNA isolation
Genomic DNA from 336 oak individuals collected across Austria [39,40] was extracted with the DNeasy Plant Mini
Kit (Qiagen) according to the manufacturer’s instructions. Microarray experiments with long-term drought stress applied to oak clones [21] provided the basis for selection of ten putative candidate genes for drought adaption (Table 4).
Amplification of candidate genes
Sequencing adaptors and barcodes were attached to the gene of interest following a modified two-step approach used by Schuelke [41]. In the first step, genespecific pri-mer pairs (internal pripri-mers) with M13-tails were used to amplify regions of interest. Internal primers targeting regions with a minimum of 200 and a maximum of 375 bp were planned with Primer3 [42] using default settings. M13Fw (5′-TGTAAAACGACGGCCAGT-3′)
and M13Re (5′-CAGGAAACAGCTATGACC-3′) were
synthesized to the 5′-end of the internal primers. Ampli-cons for 454 sequencing were generated from 20 ng of
template DNA. PCR reactions were performed in 25 μl
total volume using 5μl 5 x HOT FIREPolWBlend Master
Mix 12.5 mM MgCl2 without dye (Solis BioDyne) and 3
pmol of each primer. A three-step PCR program consist-ing of 15 min. initial denaturation at 95°C followed by 32 cycles denaturation at 95°C for 30 sec., annealing at a temperature of 68°C for 45 sec., extension at 72°C for one minute and a final extension at 72°C for 8 minutes was used.
Forward primer for the second amplification con-sisted of the 454 sequencing adaptor A (5′-CCATCT-CATCCCTGCGTGTCTCCGACTCAG-3′) linked to a hexanucleotide barcode sequence corresponding to the amplified individual and the M13Fw sequence. Reverse primers consisted of the 454 sequencing
adaptor B (5′- CCTATCCCCTGTGTGCCTTGGCAG
TCTCAG-3′) and the M13Re sequence. HOT FIREPolW
Blend Master Mix and a primer concentration according to Table 5 was used for the amplification including an ini-tial denaturation step of 95°C for 15 minutes. Subsequent cycling comprised denaturation at 95°C for 20 sec., annealing at 55°C for time given in Table 5 and extension at 72°C for 15 seconds. The number of cycles was depend-ing on the gene region amplified and can be found in Table 5. Product size and concentration was verified with gel electrophoresis on 1.0% agarose gels.
Multiplexed 454 amplicon sequencing
PCR products of forty-two individuals per gene were pooled resulting in a total number of 80 pools. Cleaning was performed after pooling with the QIAquick PCR purification kit (QIAGEN) according to the manufac-turer’s instructions. Concentrations of these pools were measured on Nanodrop (Thermo Scientific) and adjusted
to 30 ng/μl adding TE buffer pH 8.0. PCR products of
were combined and sent for sequencing which was car-ried out by GATC Biotech in an 8 gasket format run on the Genome Sequencer FLX system (454 Life Sciences) with Titanium chemistry.
Bioinformatic analysis pipeline
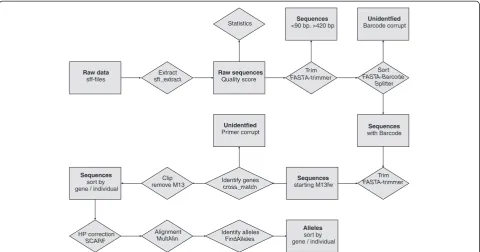
A semiautomatic pipeline for allele identification was developed using several publicly available software tools. The general workflow is shown in Figure 3. Sequencing data delivered in sff format was extracted usingsff_extract
(http://bioinf.comav.upv.es/sff_extract/) with the clipping option set (sff_extract -u -c input.sff -o output_raw). Length and quality statistics of the sequencing runs were calculated in R 2.12.1 [43], which was also used for graph-ical representation. All sequences shorter than 90 base pairs were removed from the analysis with custom Perl or shell scripts because these only contained 16 bp with possible SNP information (90 bp less 30 bp adaptor, 6 bp barcode, 18 bp M13 and 20 bp genespecific primer). Sequences longer than 420 bp were trimmed using FASTA-Trimmer (fastx_trimmer -l 420 -i input.long -o output_lenclipped.fasta) which is part of the FASTX-tool-kit (http://hannonlab.cshl.edu/fastx_toolkit/index.html) because a drop of quality below a threshold of 20 (454 quality score) was observed after this length. With the
aid of the FASTA-Barcode Splitter which is also part of
the FASTX-toolkit names of Quercus individuals were
[image:6.595.58.539.99.391.2]assigned to the corresponding reads with the exact match option set (cat input_lenclipped.fasta | fastx_barcode_ splitter.pl -bcfile Tags_Oak.txt -bol -exact -prefix BC_Oa-k_output/ -suffix “.fasta”). For this, a textfile (Tags_Oak. txt) including the names of the individuals and the bar-code sequences was used. Only perfect matching barbar-codes were considered for further analysis. After barcode identi-fication,FASTA-Trimmerwas used to remove the first six bases of each read (fastx_trimmer -f 7 -i input.fasta -o
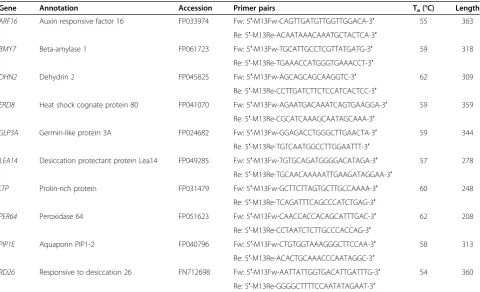
Table 4 Summary data of candidate genes
Gene Annotation Accession Primer pairs Ta(°C) Length
ARF16 Auxin responsive factor 16 FP033974 Fw: 5′-M13Fw-CAGTTGATGTTGGTTGGACA-3′ 55 363
Re: 5′-M13Re-ACAATAAACAAATGCTACTCA-3′
BMY7 Beta-amylase 1 FP061723 Fw: 5′-M13Fw-TGCATTGCCTCGTTATGATG-3′ 59 318
Re: 5′-M13Re-TGAAACCATGGGTGAAACCT-3′
DHN2 Dehydrin 2 FP045825 Fw: 5′-M13Fw-AGCAGCAGCAAGGTC-3′ 62 309
Re: 5′-M13Re-CCTTGATCTTCTCCATCACTCC-3′
ERD8 Heat shock cognate protein 80 FP041070 Fw: 5′-M13Fw-AGAATGACAAATCAGTGAAGGA-3′ 59 359
Re: 5′-M13Re-CGCATCAAAGCAATAGCAAA-3′
GLP3A Germin-like protein 3A FP024682 Fw: 5′-M13Fw-GGAGACCTGGGCTTGAACTA-3′ 59 344
Re: 5′-M13Re-TGTCAATGGCCTTGGAATTT-3′
LEA14 Desiccation protectant protein Lea14 FP049285 Fw: 5′-M13Fw-TGTGCAGATGGGGACATAGA-3′ 57 278
Re: 5′-M13Re-TGCAACAAAAATTGAAGATAGGAA-3′
LTP Prolin-rich protein FP031479 Fw: 5′-M13Fw-GCTTCTTAGTGCTTGCCAAAA-3′ 60 248
Re: 5′-M13Re-TCAGATTTCAGCCCATCTGAG-3′
PER64 Peroxidase 64 FP051623 Fw: 5′-M13Fw-CAACCACCACAGCATTTGAC-3′ 62 208
Re: 5′-M13Re-CCTAATCTCTTGCCCACCAG-3′
PIP1E Aquaporin PIP1-2 FP040796 Fw: 5′-M13Fw-CTGTGGTAAAGGGCTTCCAA-3′ 58 313
Re: 5′-M13Re-ACACTGCAAACCCAATAGGC-3′
RD26 Responsive to desiccation 26 FN712698 Fw: 5′-M13Fw-AATTATTGGTGACATTGATTTG-3′ 54 360
Re: 5′-M13Re-GGGGCTTTTCCAATATAGAAT-3′
Accession GeneBank accession number, Taannealing temperature of gene specific primers
Table 5 PCR settings
Gene Annealing time (sec.) Cycles Primer concentration (pmol)
ARF16 20 25 4
BMY7 25 26 4
DHN2 25 27 3
ERD8 20 28 4
GLP3A 25 27 3
LEA14 25 32 4
LTP 25 26 3
PER64 25 28 4
PIP1E 20 26 4
[image:6.595.55.291.581.732.2]output.trimmed). To identify the gene primercross_match (http://www.phrap.org/consed/consed.html) was applied with the minimum length of matched word set to eight and the minimum alignment score set to ten (cross_match input.trimmed ../Internal_primer.fasta -minmatch 8 -min-score 10>output.crossmatch). Starting position of the cross_match hit was extracted from the output (egrep“^ [0–9]”input.crossmatch | awk‘$6<40 { printf(“ %s\t%s\t-1\t%s\n”, $5, $6, $9) }‘ > output.crossmatch.filter) and used in a custom Perl script to clip M13 primers which precede the gene primer sequences.
To cope with errors resulting from the misinterpret-ation of homopolymer stretches by 454 sequencing we
made use of the assembly tool SCARF [20]. Sanger
sequences [21] of the amplicons were used as references and homopolymer correction was turned on for a mini-mum length of 2 bp. Therefore homopolymer errors longer than the reference sequence will be trimmed to reduce read errors. Minimum percent identity and mini-mum hit score were set to 80 and 100, respectively (./scarf -f input.fasta–r referrence.fasta -c T -l 2 -p 80 -s
100). Alignment of the assembled reads was done with
MultAlin [44] using the AltDNA symbol comparison table and the gap penalty at extremities parameter set to end (ma -c: altdna.tab –x:1 input.clusters). Reads with gaps larger than 10 bp were masked in the alignment using a bash script for detection and not considered for further analysis.
SNP and allele detection
We created an extensive script (FindAlleles) usingBioPerl [45] which is able to identify mutations and detect alleles.
Msf alignment files produced byMultAlinserve as input
and are read using theBio::AlignIO module. In a next step three different consensus sequences are calculated using the Bio::SimpleAlign module: consensus_iupac()— consen-sus sequence using IUPAC ambiguity codes for DNA, consensus_string()—standard consensus sequence
display-ing bases which occur in plurality and consensus_string
(40)—produces a standard consensus and marks positions with a lower percent-identity than 40 % with “?”. A col-umn representation of all sequence reads in the alignment is created. Using the three consensus sequences created, each column is screened for possible allelic distribution or arbitrary nucleotide insertions or deletions created by 454 sequencing technology and both types are annotated with a tag. In a next step the script checks each column for an allelic distribution of a 40/60 ratio. This correction thresh-old value was identified by manually examining randomly chosen alignments. In the examined alignments reading errors were not present in more than ten percent of the reads. The 40/60 distribution might be created by two dif-ferent nucleotides (nucleotide variation) or by the inser-tion or deleinser-tion of a nucleotide (InDel). If this ratio is found the position is considered as valid“allelic” distribu-tion. If it is not found, it is considered as reading error and is automatically corrected with the nucleotide found
Raw data
sff-files
Extract
sff_extract
Raw sequences
Quality score Statistics
Tr im
FASTA-trimmer Sequences
<90 bp, >420 bp
Sort
FASTA-Barcode Splitter Unidentfied
Barcode corrupt
Sequences
with Barcode
Trim
FASTA-trimmer Sequences
starting M13fw Identify genes
cross_match Unidentfied
Primer corrupt
Clip remove M13
Sequences
sort by gene / individual
HP correction
SCARF
Alignment
MultAlin
Identify alleles
FindAlleles
Alleles
[image:7.595.58.539.89.341.2]sort by gene / individual
in the Sanger reference if a previously set correction threshold of ten percent is reached. AsSCARFonly treats homopolymer errors longer than the length present in the reference, we implemented an additional routine to fill up homopolymers shorter than the reference. As we observed errors occurring already in homopolymers consisting of two nucleotides, the min homopolymer parameter which sets the amount of nucleotides in a row to trigger correc-tion was set to one. Nucleotide posicorrec-tions exceeding the reference are ignored.
After the correction phase the allele identification pro-cedure is started running again over each column. If a tag for allelic distribution is found, the process splits up the available reads into two subgroups and a recursive subroutine is started for each split alignment. Each sub-routine receives the associated reads and continues with them. Reads shorter than 70 % of the reference were dis-carded. Then the tags are checked and split up again if an allelic distribution is found. After all subroutines are finished alleles are exported to a multiple fasta file as well as statistics about the number of reads accounting for their creation and a text file with the excluded reads are generated. A cluster for allele generation was consid-ered as valid if at least five reads covconsid-ered more than 70 % of the reference sequence derived from Sanger sequen-cing. Number of alleles, observed and expected hetero-zygosities, deviation from Hardy-Weinberg equilibrium and linkage disequilibrium were calculated with Gene-pop 4.0 [46]. Frequency of null alleles was estimated with FreeNA [47] and effective number of alleles was calcu-lated with GenAlEx 6 [48] using default settings.
Additional files
Additional file 1:Self-contained websites displaying alleles and genotypes.
Additional file 2: Table S2.Table displaying linkage disequilibrium among pairwise combined loci.
Competing interests
The authors declare that they have no competing interests.
Acknowledgements
The project was funded by the Austrian Federal Ministry of Agriculture, Forestry, Environment and Water Management (LE 2109 GZ LE.3.2.3/0014-IV 2/2005), the Regional Office of Vienna , the Regional Office of Lower Austria (BD1 NU94-2005, LF2-FO-7059/001-05, LF4-A-25/009-2004), the Regional Office of Upper Austria, the Regional Office of Styria (A3-36E4-05/2) and the Regional Office of Burgenland. We thank Dr. Schüler and the Federal Forest Office Vienna for sharing genomic DNA with us.
Authors’contributions
AH participated in the design of the study, carried out the primer design and amplification of the candidate genes, analyzed bioinformatic as well as genetic data and drafted the manuscript. TE developed the allele finding algorithm. DK worked on SQL scripting and pipeline design. MB participated in primer design and candidate gene amplification. KB participated in the design of the study and commented on the manuscript. SF participated in
the design of the study and commented on the manuscript. All authors read and approved the final manuscript.
Received: 26 September 2011 Accepted: 03 April 2012 Published: 03 April 2012
References
1. Liesebach M, Schüler S, Weißenbacher L, Franner T, Henninger F, Geburek T: Herkunftsversuch mit Eiche in Vorbereitung.Forstzeitung2006,117:40–41. 2. Dickson RE, Tomlinson PT:Oak growth, development and carbon
metabolism in response to water stress.Ann Sci For1996,53:181–196. 3. Zhenzhu X, Guangsheng Z, Hideyuki S:Plant response to drought and
rewatering.Plant Signal Behav2010,5:649–654.
4. Beikircher B, Mayr S:Intraspecific differences in drought tolerance and acclimation in hydraulics ofLigustrum vulgareandViburnum lantana.Tree
Physiol2009,29:767–775.
5. Luo N, Liu J, Yu X, Jiang Y:Natural variation of drought response in
Brachypodium distachyon.Physiol Plant2011,141:19–29.
6. Ganal MW, Altmann T, Röder MS:SNP identification in crop plants.Curr
Opin Plant Biol2009,12:211–217.
7. Rafalski A:Applications of single nucleotide polymorphism in crop genetics.Curr Opin Plant Biol2002,5:94–100.
8. Le Dantec L, Chagné D, Pot D, Cantin O, Garnier-Géré P, Bedon F, Frigerio JM, Chaumeil P, Léger P, Garcia V, Laigret F, De Daruvar A, Plomion C: Automated SNP detection in expressed sequence tags: statistical considerations and application to maritime pine sequences.Plant Mol Biol 2004,54:461–470.
9. Becker A, Chao DY, Zhang X, Salt DE, Baxter I:Bulk segregant analysis using single nucleotide polymorphism microarrays.PLoS One2011,6: e15993.
10. Yao J, Lin H, Doddapaneni H, Civerolo EL:nWayComp: a genome-wide sequence comparison tool for multiple strains/species of
phylogenetically related microorganisms.In Silico Biol2007,7:195–200. 11. Meyer M, Stenzel U, Myles S, Prüfer K, Hofreiter M:Targeted
high-throughput sequencing of tagged nucleic acid samples.Nucleic Acids Res 2007,35:e97.
12. Koboldt DC, Chen K, Wylie T, Larson DE, McLellan MD, Mardis ER, Weinstock GM, Wilson RK, Ding L:VarScan: variant detection in massively parallel sequencing of individual and pooled samples.Bioinformatics2009, 25:2283–2285.
13. Margulies M, Egholm M, Altman WE, Attiya S, Bader JS, Bemben LA, Berka J, Braverman MS, Chen YJ, Chen Z, Dewell SB, Du L, Fierro JM, Gomes XV, Godwin BC, He W, Helgesen S, Ho CH, Irzyk GP, Jando SC, Alenquer ML, Jarvie TP, Jirage KB, Kim JB, Knight JR, Lanza JR, Leamon JH, Lefkowitz SM, Lei M, Li J,et al:Genome sequencing in microfabricated high-density picolitre reactors.Nature2005,437:376–380.
14. Stiller M, Knapp M, Stenzel U, Hofreiter M, Meyer M:Direct multiplex sequencing (DMPS)-a novel method for targeted high-throughput sequencing of ancient and highly degraded DNA.Genome Res2009, 10:1843–1848.
15. Hamady M, Walker JJ, Harris CK, Gold NJ, Knight R:Error-correcting barcoded primers for pyrosequencing hundreds of samples in multiplex.
Nat Methods2008,5:235–237.
16. Külheim C, Yeoh SH, Maintz J, Foley WJ, Moran GF:Comparative SNP diversity among fourEucalyptusspecies for genes from secondary metabolite biosynthetic pathways.BMC Genomics2009,10:452. 17. Neigenfind J, Gyetvai G, Basekow R, Diehl S, Achenbach U, Gebhardt C,
Selbig J:Haplotype inference from unphased SNP data in heterozygous polyploids based on SAT.BMC Genomics2008,9:356.
18. Wang IL, Chang CY:Mathematical properties and bounds on haplotyping populations by pure parsimony.Math Biosci2011,231:120–125. 19. Kirkpatrick BB:Haplotypes versus genotypes on pedigrees.Algorithms Mol
Biol2011,6:10.
20. Barker MS, Dlugosch KM, Reddy ACC, Amyotte SN, Rieseberg LH:SCARF: maximizing next-generation EST assemblies for evolutionary and population genomic analyses.Bioinformatics2009,25:535–536. 21. Spieß N, Oufir M, Matušíková I, Stierschneider M, Kopecky D, Homolka A,
22. Neale DB, Kremer A:Forest tree genomics: growing resources and applications.Nat Rev Genet2011,12:111–122.
23. Lepoittevin C, Harvengt L, Plomion C, Garnier-Géré P:Association mapping for growth, straightness and wood chemistry traits in thePinus pinaster
Aquitaine breeding population.Tree Genet Genomes2011,8:113–126. 24. González-Martínez SC, Krutovsky KV, Neale DB:Forest-tree population
genomics and adaptive evolution.New Phytol2006,170:227–238. 25. Petit RJ, Csaikl UM, Bordács S, Burg K, Coart E, Cottrell J, Van Dam B, Deans
JD, Dumolin-Lapègue S, Fineschi S,et al:Chloroplast DNA variation in European white oaks. Phylogeography and patterns of diversity based on data from over 2600 populations.Forest Ecol Manag2002,156:5–26. 26. Scotti-Saintagne C, Mariette S, Porth I, Goicoechea PG, Barreneche T,
Bodénès C, Burg K, Kremer A:Genome scanning for interspecific differentiation between two closely related oak species [Quercus roburL. andQ. petraea(Matt.) Liebl.].Genetics2004,168:1615–1626.
27. Derory J, Scotti-Saintagne C, Bertocchi E, Le Dantec L, Graignic N, Jauffres A, Casasoli M, Chancerel E, Bodénès C, Alberto F, Kremer A:Contrasting relations between diversity of candidate genes and variation of bud burst in natural and segregating populations of European oaks.Heredity 2010,105:401–411.
28. Quang ND, Ikeda S, Harada K:Nucleotide variation inQuercus crispula
Blume.Heredity2008,101:166–174.
29. Anderson LL, Hu FS, Paige KN:Phylogeographic history of white spruce during the last glacial maximum: uncovering cryptic refugia.J Hered 2011,102:207–216.
30. Ching A, Caldwell KS, Jung M, Dolan M, Smith OS, Tingey S, Morgante M, Rafalski AJ:SNP frequency, haplotype structure and linkage disequilibrium in elite maize inbred lines.BMC Genet2002,3:19. 31. Chu Y, Su X, Huang Q, Zhang X:Patterns of DNA sequence variation at
candidate gene loci in black poplar (Populus nigraL.) as revealed by single nucleotide polymorphism.Genetica2009,137:141–150. 32. Joron M, Frezal L, Jones RT, Chamberlain NL, Lee SF, Haag CR, Whibley A,
Becuwe M, Baxter SW, Ferguson L, Wilkinson PA, Salazar C, Davidson C, Clark R, Quail MA, Beasley H, Glithero R, Lloyd C, Sims S, Jones MC, Rogers J, Jiggins CD, Ffrench-Constant RH:Chromosomal rearrangements maintain a polymorphic supergene controlling butterfly mimicry.Nature2011, 477:203–206.
33. Whittemore AT, Schaal B:Interspecific gene flow in sympatric oaks.Proc
Nat Acad Sci USA1991,88:2540–2544.
34. Valbuena-Carabana M, González-Martínez SC, Sork VL, Collada C, Soto A, Goicoechea PG, Gil L:Gene flow and hybridization in a mixed oak forest (Quercus pyrenaicaWilld. andQuercus petraea(Matts.) Liebl.) in central Spain.Heredity2005,95:457–465.
35. Thapa G, Dey M, Sahoo L, Panda SK:An insight into the drought stress induced alterations in plants.Biol Plantarum2011,55:603–613. 36. Lorenz WW, Alba R, Yu Y, Bordeaux JM, Simões M, Dean JFD:Microarray
analysis and scale-free gene networks identify candidate regulators in drought-stressed roots of loblolly pine (P. taedaL.).BMC Genomics2011, 12:264.
37. González-Martínez SC, Ersoz E, Brown GR, Wheeler NC, Neale DB:DNA sequence variation and selection of tag single-nucleotide
polymorphisms at candidate genes for drought-stress response inPinus taedaL.Genetics2006,172:1915–1926.
38. Eckert AJ, Wegrzyn JL, Pande B, Jermstad KD, Lee JM, Liechty JD, Tearse BR, Krutovsky KK, Neale DB:Multilocus patterns of nucleotide diversity and divergence reveal positive selection at candidate genes related to cold hardiness in coastal Douglas fir (Pseudotsuga menziesiivar.menziesii).
Genetics2009,183:289–298.
39. Csaikl UM, Burg K, Fineschi S, König AO, Matyas C, Petit RJ:Chloroplast DNA variation of white oaks in the alpine region.Forest Ecol Manag2002, 156:131–1454.
40. Schüler S, Weißenbacher L:Herkunftsversuche mit Stiel- und
Traubeneiche aus Österreich und angrenzenden Ländern = Provenance trials with seed sources of pendunculate and sessile oak originating from Austria and neighboring countries.BFW-Dokumentation, Wien2010,13:40. 41. Schuelke M:An economic method for the fluorescent labeling of PCR
fragments.Nat Biotechnol2000,18:233–234.
42. Rozen S, Skaletsky HJ:Primer3 on the WWW for general users and for biologist programmers. InBioinformatics Methods and Protocols: Methods in Molecular Biology. Edited by Krawetz S, Misener S. Totowa: Humana Press; 2000:365–386.
43. Ihaka R, Gentleman R:R: a language for data analysis and graphics.J
Comput Graph Stat1996,5:399–414.
44. Corpet F:Multiple sequence alignment with hierarchical clustering.Nucl
Acids Res1988,16:10881–10890.
45. Stajich J, Block D, Boulez K, Brenner S, Chervitz S, Dagdigian C, Fuellen G, Gilbert JG, Korf I, Lapp H, Lehväslaiho H, Matsalla C, Mungall CJ, Osborne BI, Pocock MR, Schattner P, Senger M, Stein LD, Stupka E, Wilkinson MD, Birney E:The Bioperl toolkit: perl modules for the life sciences.Genome Res2002, 12:1611–1618.
46. Raymond M, Rousset F:GENEPOP (version 1.2): population genetics software for exact tests and ecumenicism.J Heredity1995,86:248–249. 47. Chapuis MP, Estoup A:Microsatellite null alleles and estimation of
population differentiation.Mol Biol Evol2007,24:621–631.
48. Peakall R, Smouse PE:GENALEX 6: genetic analysis in Excel. Population genetic software for teaching and research.Mol Ecol Notes2006,6:288– 295.
doi:10.1186/1756-0500-5-175
Cite this article as:Homolkaet al.:Allele discovery of ten candidate drought-response genes in Austrian oak using a systematically informatics approach based on 454 amplicon sequencing.BMC Research Notes2012
5:175.
Submit your next manuscript to BioMed Central and take full advantage of:
• Convenient online submission
• Thorough peer review
• No space constraints or color figure charges
• Immediate publication on acceptance
• Inclusion in PubMed, CAS, Scopus and Google Scholar
• Research which is freely available for redistribution