Open Access
Technical Note
SigWin-detector: a Grid-enabled workflow for discovering enriched
windows of genomic features related to DNA sequences
Márcia A Inda
1, Marinus F van Batenburg
2, Marco Roos
3, Adam SZ Belloum
3,
Dmitry Vasunin
3, Adianto Wibisono
3, Antoine HC van Kampen
2and
Timo M Breit*
1Address: 1Integrative Bioinformatics Unit, Swammerdam Institute for Life Sciences, Faculty of Science, University of Amsterdam, PO Box 94062,
1090 GB Amsterdam, The Netherlands, 2Bioinformatics Laboratory, Academic Medical Center, Meibergdreef 9, 1105 AZ Amsterdam, The
Netherlands and 3Institute of Informatics, Faculty of Science, University of Amsterdam, Kruislaan 403, 1098 SJ Amsterdam, The Netherlands
Email: Márcia A Inda - [email protected]; Marinus F van Batenburg - [email protected]; Marco Roos - [email protected]; Adam SZ Belloum - [email protected]; Dmitry Vasunin - [email protected]; Adianto Wibisono - [email protected]; Antoine HC van Kampen - [email protected]; Timo M Breit* - [email protected]
* Corresponding author
Abstract
Background: Chromosome location is often used as a scaffold to organize genomic information
in both the living cell and molecular biological research. Thus, ever-increasing amounts of data about genomic features are stored in public databases and can be readily visualized by genome browsers. To perform in silico experimentation conveniently with this genomics data, biologists need tools to process and compare datasets routinely and explore the obtained results interactively. The complexity of such experimentation requires these tools to be based on an e-Science approach, hence generic, modular, and reusable. A virtual laboratory environment with workflows, workflow management systems, and Grid computation are therefore essential.
Findings: Here we apply an e-Science approach to develop SigWin-detector, a workflow-based
tool that can detect significantly enriched windows of (genomic) features in a (DNA) sequence in a fast and reproducible way. For proof-of-principle, we utilize a biological use case to detect regions of increased and decreased gene expression (RIDGEs and anti-RIDGEs) in human transcriptome maps. We improved the original method for RIDGE detection by replacing the costly step of estimation by random sampling with a faster analytical formula for computing the distribution of the null hypothesis being tested and by developing a new algorithm for computing moving medians. SigWin-detector was developed using the WS-VLAM workflow management system and consists of several reusable modules that are linked together in a basic workflow. The configuration of this basic workflow can be adapted to satisfy the requirements of the specific in silico experiment.
Conclusion: As we show with the results from analyses in the biological use case on RIDGEs,
SigWin-detector is an efficient and reusable Grid-based tool for discovering windows enriched for features of a particular type in any sequence of values. Thus, SigWin-detector provides the proof-of-principle for the modular e-Science based concept of integrative bioinformatics experimentation.
Published: 8 August 2008
BMC Research Notes 2008, 1:63 doi:10.1186/1756-0500-1-63
Received: 25 April 2008 Accepted: 8 August 2008
This article is available from: http://www.biomedcentral.com/1756-0500/1/63
© 2008 Inda et al; licensee BioMed Central Ltd.
Findings
Genomic information is encoded in DNA and as such retained in a fairly steady configuration. In contrast to RNA, proteins, and metabolites, DNA is organized by a limited number of large chromosomes with relatively sta-ble DNA sequences. Therefore, position in the DNA sequence, i.e., chromosome location, provides a conven-ient and essential scaffold for both the living cell and molecular biological research. In cells, for example, chro-mosomal organization is important for gene-transcription processes. Expression-profiling studies showed that gene expression is not only controlled at the level of individual genes, but also via autonomous regulation of chromo-somal domains [1-5]. This suggests the existence of higher-order transcriptional regulatory mechanisms related to DNA organization or structures. The use of chromosomal organization in the life sciences is exempli-fied by the popularity of genome browsers that use chro-mosome location to map many genomic features, such as genes and their products, regulatory elements, gene expression, and epigenetic markers. The search for con-nections between genomic features is important in unraveling cellular mechanisms.
The pace at which omics experiments continuously keep producing large amounts of data about genomic features for an increasing number of sequenced genomes, creates a need for new high-throughput methods for identification of correlations between DNA related features [6-12]. Therefore, biologists would benefit from tools that could quickly identify enriched regions of genomic features. This would allow extensive, yet convenient in silico exper-imentation based on routinely processing and comparing multiple datasets. However, this requires these tools to be implemented in such a way that they deal with the many steps involved in this kind of experimentation. These include: acquiring the data from local or remote data repositories, converting it to the desired format, using it with the actual application that searches for the desired enrichment (possibly using Grid computation), visualiz-ing the results, and comparvisualiz-ing and/or integratvisualiz-ing multi-ple datasets. Therefore, such a tool should be developed applying an e-Science approach [13-17]: it should be generic with respect to which data it can analyze, easy to adapt, and its parts should be reusable.
In an e-Science approach, a computational environment that provides transparent access to distributed data, ade-quate computational resources, as well as the necessary interfacing tools, is called a virtual laboratory (VL). Work-flow management systems (WMSs, [18-21]) are an example of interfacing tooling that takes care of scheduling, keeps track of task executions, and provides the management framework necessary to develop applications inside a VL.
WMSs can be used to design scientific workflows that automate in silico experimentation by providing a pipeline for streaming large quantities of data through various algorithms, applications and services.
This paper describes an e-Science based data integration and analysis tool: SigWin-detector. This application can detect clusters with increased (or decreased) density of a genomic feature in a DNA-related sequence in a fast and reproducible way. In the context of the development of a VL, our tool was implemented as a workflow running under WS-VLAM[20,21], a Grid-enabled WMS. A biologi-cal use case shows its relevance for biologibiologi-cal research. Sig-Win-detector is based on a method previously used by Versteeg and coworkers [4] to detect regions of increased and decreased gene expression (RIDGEs and anti-RIDGES) in human transcriptome maps (HTM). We improved the original method by i) deriving an analytical formula for computing the new hypothesis probability distribution, which replaces the costly step of estimation by random sampling and ii) developing a new algorithm for comput-ing movcomput-ing medians. While these improvements radically increase the intrinsic efficiency of the method, imple-menting SigWin-detector using a generic e-Science approach with access to Grid resources broadens its appli-cability and makes it amenable to a wide spectrum of experiments on genomic features or in fact on any sequence of values.
Significant windows and the mmFDR procedure
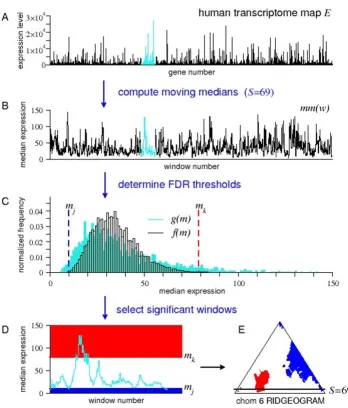
Versteeg et al. [4] identified clusters where the median expression level of the genes involved is significantly higher than expected (RIDGEs), using a moving median false discovery rate (mmFDR) procedure (Figure 1). The mmFDR procedure identifies RIDGEs by testing the input gene-expression against the null hypothesis that the posi-tion of the genes on the chromosomes does not affect their expression levels. This same procedure can be used to identify significant windows (i.e., windows in the input sequence that have a median value that deviates signifi-cantly from expected, if assumed that the ordering of the numbers in the input sequence is random) related to any genomic feature mapped to DNA sequences. In an even wider scope, it can also be used to identify significant win-dows in any sequence of numbers.
Avoiding permutations in the mmFDR procedure
Figure 1
Using a mmFDR method to detect RIDGEs in a human transcriptome map. Schematic representation of the moving
median false discovery rate (mmFDR) procedure identifying regions of high and low density of gene expression (RIDGEs and anti-RIDGEs, respectively) [4]. (A) Input sequence, a human transcriptome map (HTM), i.e., expression values of genes ordered by their chromosome location (cyan; chromosome 6). (B) mm(w), moving medians of the HTM for a given window size S. (C) Determination of the high and low mmFDR thresholds at a given level α: The high threshold mk is the smallest gene expression value for which the , here f(m) is the theoretical probability distribution of mm(w), and g(m) is the observed distribution of mm(w). (In [4], f(m) is estimated by simple sampling). Similarly, the low threshold mj is
the largest gene expression value for which . (D) Selection of significant windows in
chromo-some 6: RIDGEs (in red) all windows for which the median gene expression is higher than or equal to mk; anti-RIDGEs (in blue)
all windows for which the median gene expression is lower than or equal to mj. (E) Output RIDGEOGRAM of chromosome 6.
Each row (y-axis) in the RIDGEOGRAM represents a window size, ranging from S = 3 to S = M (the number of genes on the chromosome). Each column (x-axis) represents a sliding window number, ranging from w = S/2 to w = M-S/2 (hence the trian-gular form). Color is used to mark window medians significantly above (red) or below (blue) the genome-wide median. The scheme shows median expression data for window size S = 69 and FDR thresholds level α= 5%.
f m m m g m
m m≥ k ( ) /
∑
≥ k ( )≤∑
af m g m
m m
m mj j
( ) / ( )≤
≤
≤
∑
This exact formula reduces the number of cycles of com-puting moving medians of an input sequence of approxi-mately 25,000 entries from at least 5,000 to 1, giving SigWin-detector the efficiency it needs to be used rou-tinely and for processing and comparing multiple datasets within minutes to hours, instead of days. This efficiency could not be if f(m) was estimated by sampling the per-mutation space Eπ, and counting the number of times m was the median value in any sliding window of size S.
Speeding up the computation of moving medians
Although we removed the need for computing moving medians over permutations of the input sequence, we still need to compute medians of windows sliding over the input sequence. We developed a new algorithm to com-pute those moving medians efficiently by exploiting the fact that moving medians for many window sizes must be computed simultaneously (Figure 2). This new algorithm is also suitable for computing any other order-statistics.
Additional Figure A1 (Additional file 2) shows a graph comparing our moving medians algorithm with the com-monly used Hardle and Steiger's algorithm [22]. While the execution time of their algorithm increases with win-dow size (for a fixed sequence size), the execution time of our algorithm decreases with window size (Figure A1, upper panel). Because SigWin-detector needs to compute moving medians for many window sizes, our algorithm has a clear advantage over Hardle and Steiger's algorithm. In Figure A1, the break-even point of the cumulative com-putation is for Smax around 400. The efficiency of our method can be further improved by using a mixed algo-rithm that uses Hardle and Steiger's algoalgo-rithm for small window sizes and our algorithm for large window sizes, or by employing a divide-and-conquer approach. For exam-ple, a two-phase algorithm would start by dividing the input sequence into chunks of size 2M, with M ≥ 2Smax, and applying the original algorithm to each chunk sepa-rately. Similarly, the second phase computes the medians for the missing sliding windows by dividing the sequence into chunks of the same size, but now using an offset M. This two-phase algorithm is also suitable for paralleliza-tion.
Designing a Grid-enabled generic workflow
To broaden the applicability of the mmFDR procedure, we implemented SigWin-detector using an e-Science approach by implementing a general, reusable, and adapt-able tool with access to Grid resources using the
WS-First we split the procedure into a collection of workflow components (called modules), each module performing a specific task that may be fine-tuned using parameters. The modules exchange data with each other by means of input and output ports. We then can choose the appropriate modules and compose a workflow suited to our specific needs [16]. Figure 3 describes a basic workflow configura-tion of SigWin-detector.
The SigWin-detector Config-Basic1 workflow was tested on a Grid computer cluster composed of geographically distributed computational nodes: Distributed ASCI Super-computer 3 (DAS-3, [23]). Additional Figure A2 (Addi-tional file 2) presents wall clock execution times of the SigWin-detector Config-Basic1 workflow (Figure 3) for input sequences of various sizes.
The basic workflow can be altered by substituting, delet-ing, or adding modules. For example, we can extend the workflow to get the input sequence from a remote uniform resource identifier (URI)and then put the resulting SigWin-map back into it. We can modify the workflow to generate one SigWin-map per logical subsequence of the input sequence, instead of a single SigWin-map for the complete sequence [16]. We can also expand our workflow by com-puting significant windows for high median values (e.g., RIDGEs) and significant windows for low median values (e.g., anti-RIDGEs) simultaneously. The SigWin-detector workflow itself can be made into a "composite module" for more complex workflows. Furthermore, interconnec-tion of WS-VLAM with the TAVERNA workbench [19] will permit the use of the existing TAVERNA components in connection with SigWin-detector. At the moment, Grid authentication prevents WS-VLAM workflows being used outside the Grid without the extra step of Grid certifica-tion. However, we are working on a Taverna workflow that encapsulates the SigWin detector, to be made availa-ble through the myExperiment webpage [24].
Biological application: finding RIDGES in a human transcriptome map
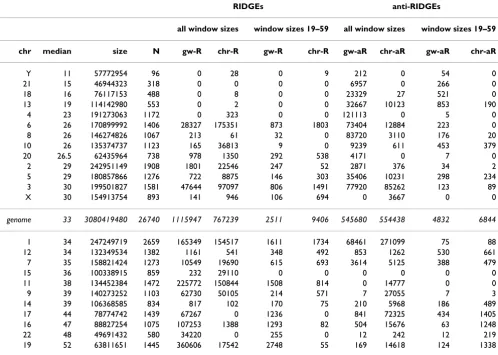
Once we finished our basic SigWin-detector, we modified it (Additional file 3) for application in our biological use case that aims to find (anti-)RIDGES in transcriptome maps. Figures 4 and 5 show a series of RIDGEOGRAMS for gene expression data for a recent version of the human transcriptome map (HTM) based on the UCSC release hg18 [4], and Table 1 summarizes some RIDGE statistics. Each RIDGEOGRAM displays both RIDGEs (red-shades) and anti-RIDGEs (blue-shades), the different color shades representing different mmFDR threshold levels. The size of the resulting RIDGEOGRAMS is proportional to the number of genes on a chromosome. We determined i) genome-wide (anti-)RIDGEs, i.e., windows for which the median expression is significantly higher (lower) than
ˆ( ) ( ) /
f r r K N r S K N S r S N r = − ⎛ ⎝ ⎜ ⎞ ⎠ ⎟⎛ − −− ⎝ ⎜ ⎞ ⎠ ⎟ ⎛ ⎝ ⎜ ⎞ ⎠ ⎟ = − − ⎛ ⎝ ⎜ ⎞ ⎠ ⎟ − 1 1 1
1 2 ((S ) / ( ) / ( ) / N S S N r S N r S N − ⎛ ⎝ ⎜ ⎞ ⎠ ⎟ ⎛ ⎝ ⎜ ⎞ ⎠ ⎟ = − − ⎛ ⎝ ⎜ ⎞ ⎠ ⎟⎛ −− ⎝ ⎜ ⎞ ⎠ ⎟ 1 2 1
1 2 1 2
Computing moving medians for many window sizes
Figure 2
Computing moving medians for many window sizes. Description of our moving medians algorithm and data structures
used. The figure illustrates a computation with input sequence size N = 7, and window sizes S = 3, 5, 7. (A) Rank data structure: used to store the input sequence. The Rank data structure gives access to the input sequence in its original and ranked order. It also allows fetching elements according to their rank. (B) Marker data structure: helps navigation through the sliding windows while keeping track of the median (or any other desired order-statistics). The Marker data structure is a Boolean array used to keep track of the elements that are inside a sliding window by means of crossing out the elements that are outside it. It also has a pointer that keeps track of the ith remaining element. This pointer is used to track the median. The Marker structure assumes the sequence is in ranked order. For example, if a sliding window of size 3 of a sequence of size 7 contains elements ranked 5, 1, and 6, the corresponding Marker structure has elements ranked 2, 3, 4, and 7 crossed out, and its median pointer points to element ranked 5. (C) Moving median algorithm for window size S. Our algorithm computes the moving medians for window sizes S = Smin, Smin+dS,..., Smin+n·dS, starting at S = Smin. When the last sliding window of size S is reached, the
algo-rithm proceeds to the next window size (S+dS) by inserting the elements that are in the first sliding window of size S+dS and crossing out the elements that were in the last sliding window of size S and setting the new position for the median pointer (which is element mm(S+dS) = (S+dS+1)/2). The algorithm stops after computing the medians for the largest window size.
(A)
Rank data structure
1
5 21 36 42 53 64 77
rank[
i
]
(C)
(rank of element with index
i
)
12 24 35 46 51 63 77
index[
i
]
(index of element ranked
i
)
11021 31541 53 65 720
sequence[
i
]
(element numbered
i
)
(B)
sequence array
Marker data structure
S=3 mmS(w)=2nd not marked
1
1021 31541 53 65 720 11 21 33 45 510615720
w
=1
1
1021 31541 53 65 720 11 21 33 45 510615720
w
=2
!
1
1021 31541 53 65 720 11 21 33 45 510615720
w
=3
"
1
1021 31541 53 65 720 11 21 33 45 510615720
w
=4
1
1
1021 31541 53 65 720 11 21 33 45 510615720
w
=5
"
S =5 mmS(w)=3rd not marked
1
1021 31541 53 65 720 11 21 33 45 510615720
w
=1
1
1021 31541 53 65 720 11 21 33 45 510615720
w
=2
1
1
1021 31541 53 65 720 11 21 33 45 510615720
w
=3
"
S =7 mmS(w)=4th not marked
1
1021 31541 53 65 720 11 21 33 45 510615720
w
=1
Moving medians algorithm at
window size
S
1. Cr oss out all elements that are not in
sliding window
w
=1.
2. Set median pointer equal to the
remaining element numbered
mm
S(
w
)=(
S
+1)/2 (blue arrow).
3.
FOR
w
=2 TO
N
-
S
+1
Update the Marker structure:
5
inser t the element that has entered it
7
cr oss out the element that has left it.
Move the median pointer according to
the following rules:
"
J ump up to the next remaining
element, if the rank of the element
that has left the window is smaller or
equal to the pointer value, and the
rank of the element that has entered
the window is larger than the pointer
value.
!
J ump down to the previous
remaining element, if the rank of the
element that has left the window is
smaller than or equal to the pointer
value, and the rank of the element
that has entered the window is larger
than the pointer value.
SigWin-Detector basic workflow using the WS-VLAM workflow composer
Figure 3
SigWin-Detector basic workflow using the WS-VLAM workflow composer. Upper: A snapshot of the workflow.
Lower: Short description of the functionality of each module, port connections, and output ports. The ports are named by an abbreviation of the module name followed by 'i' or 'o' (input or output respectively) and the port number. Input ports are colored in blue and output ports in red. The ports are numbered in the same order they appear in the workflow.
Module functionality port
connections
Output ports description
ColumnReader: Reads the input sequence E = {E1, E2, …, EN} from a selected column of a tab delimited file and transfers it to the output port.
CRi1: (Not used) CRo1: A vector containing the input sequence E.
Rank: Computes the ranks R= {R1, R2, …, RN} corresponding to E.
Ri1mCRo1 Ro1: The Rank structure corresponding to E, cf. methods section, and Figure 8.
Ro2:A vector containing R, a sorted version of E. Ro3: A vector containinga sorted version of the non duplicate values of E.
SWMedian: Computes mS(w), the moving medians ofE, for window sizes S = Smin,,Smin+'S, …, Smax=Smin+q'S. Uses the algorithm described in the
methods section.
SWMi1mRo1 SWMo1:The parameters SW=(N,Smin,,Smax,'S)
corresponding to the sliding window structure. SWMo2:A sliding window structure containing the computed moving medians (i.e., a sequence of vectors. Each containing mS(w),
forS = Smin,Smin+'S, …, Smax).
SWMedianPr ob: Computes fS(m), the exact
theoretical null hypothesis probability density function corresponding to the moving medians mS(w) using the analytical formula.
SWMPi1mSWMo1
SWMPi2mRo2
SWMPo1:A sequence of vectors. Each containing fS(m), for S = Smin,Smin+'S, …, Smax.
Sample2Fr eq: Generates gS(m), the normalized frequency counts corresponding to the moving medians mS(w).
S2Fi2mSWMo2
S2Fi1mRo3
S2Fo1:A sequence of vectors. Each containing gS(m), for S = Smin,Smin+'S, …, Smax.
FDRThr eshold: Uses gS(m) and fS(m) to compute mk, S (or mj , S), the high (or low) mmFDR thresholds at a given level Ş. corresponding to each window sizeS, for S = Smin,Smin+'S, …, Smax.
FDRTi1mSWMPo1
FDRTi2mS2Fo1
FDRTi3mRo3
FDRTo1: A sequence of high (or low) mmFDR thresholds mk, S (ormj , S), one for each S.
SigWinSelect : Selects the windows for which the median value mS(w) is above (or below) the FDR threshold mk, S (or mj , S). The resulting significant windows are written to a tab-delimited file.
SWSi1mSWMo1
SWSi2mSWMo2
SWSi3mFDRTo1
SWSo1:Name of the file to which the resulting significant windows were written.
SWSo1:(Not used)
SigWinPlot Gr ace: Generates an XMGRACE [13] configuration file with instructions of how to plot the resulting SigWin-map.
SWPGi1mSWMo1
SWPGi2mFDRTo1
SWPGo1:A file containing XMGRACE instructions on how to print the resulting SigWin-map.
XmGr ace: Displays the resulting SigWin-map using XMGRACE.
expected by considering the whole genome gene expres-sion profile in the mmFDR procedure (Figure 4), and ii) chromosome specific (anti-)RIDGEs, i.e., the same analy-sis, but considering only the specific chromosome gene expression profile (Figure 5). This distinction has a major effect on the outcome. If the expression values of the genes on a certain chromosome are typically significantly higher than the genome-wide values, then there are less chromosome specific than genome-wide RIDGEs (e.g., chromosome 19 in Figures 4 and 5 and Table 1). Con-versely, if the expression values of the genes on a chromo-some are typically significantly smaller than the genome-wide values, then there are more chromosome specific RIDGEs (e.g., chromosome 6 in Table 1 and Figures 4 and 5). In the case of anti-RIDGEs the opposite holds (e.g., chromosomes 17 in Table 1 and Figures 4 and 5). This example shows the importance of choosing the right sequence to compute the null hypothesis distribution. Based on the fact that chromosomes are separate mole-cules in a cell, one may favor the results from the
individ-ual chromosome SigWin-detector analysis to investigate potential higher-order gene expression regulatory mecha-nisms.
[image:7.612.55.553.102.456.2]The RIDGEOGRAMS shown in Figures 4 and 5 only take the ordering of the genes into account, and not their actual physical position in the chromosome. However, from a biological perspective it is likely that the higher order gene-expression mechanisms that underlie RIDGEs relate to an actual section of the chromosome rather than a cluster of genes just ordered by their chromosome loca-tion. So we used our SigWin-detector to take the physical gene position into account by subdividing the chromo-somes in stretches of constant value (250 kb). If a stretch contains the beginning of one or more genes, their average expression value is assigned to that stretch of DNA. For this analysis we used the SigWin-detector Config-Sub2 with preprocessed HTM data and adapted parameters. The resulting RIDGEOGRAMS are proportional to the chro-mosome's size (Additional Figure A3, Additional file 2). Table 1: HTM statistical data
RIDGEs anti-RIDGEs
all window sizes window sizes 19–59 all window sizes window sizes 19–59
chr median size N gw-R chr-R gw-R chr-R gw-aR chr-aR gw-aR chr-aR
Y 11 57772954 96 0 28 0 9 212 0 54 0
21 15 46944323 318 0 0 0 0 6957 0 266 0
18 16 76117153 488 0 8 0 0 23329 27 521 0
13 19 114142980 553 0 2 0 0 32667 10123 853 190
4 23 191273063 1172 0 323 0 0 121113 0 5 0
6 26 170899992 1406 28327 175351 873 1803 73404 12884 223 0
8 26 146274826 1067 213 61 32 0 83720 3110 176 20
10 26 135374737 1123 165 36813 9 0 9239 611 453 379
20 26.5 62435964 738 978 1350 292 538 4171 0 7 0
2 29 242951149 1908 1801 22546 247 52 2871 376 34 2
5 29 180857866 1276 722 8875 146 303 35406 10231 298 234
3 30 199501827 1581 47644 97097 806 1491 77920 85262 123 89
X 30 154913754 893 141 946 106 694 0 3667 0 0
genome 33 3080419480 26740 1115947 767239 2511 9406 545680 554438 4832 6844
1 34 247249719 2659 165349 154517 1611 1734 68461 271099 75 88
12 34 132349534 1382 1161 541 348 492 853 1262 530 661
7 35 158821424 1273 10549 19690 615 693 3614 5125 388 479
15 36 100338915 859 232 29110 0 0 0 0 0 0
11 38 134452384 1472 225772 150844 1508 814 0 14777 0 0
9 39 140273252 1103 62730 50105 214 571 7 27055 7 3
14 39 106368585 834 817 102 170 75 210 5968 186 489
17 44 78774742 1439 67267 0 1236 0 841 72325 434 1405
16 47 88827254 1075 107253 1388 1293 82 504 15676 63 1248
22 48 49691432 580 34220 0 255 0 12 242 12 219
19 52 63811651 1445 360606 17542 2748 55 169 14618 124 1338
The anti-RIDGEs show a lower cut-off caused by the many 0 values in the HTM. The results from the SigWin-detector analysis using chromosome position are substantially dif-ferent to those using chromosome ordering. This applica-tion demonstrated that SigWin-detector is an e-Science tool that allows convenient in-silico experimentation. To prove that this tool is generic, we used our workflow to examine a simple sequential data set: an extended time series of hourly ground level ozone concentration meas-urements (Additional file 4).
Availability and requirements
• Project name: SigWin-detector
• Project home page: http://mad-db.science.uva.nl/ projects/sigwin/
• Programming language: C++
• Other requirements: SigWin-detector needs the WS-VLAM workflow management system. WS-WS-VLAM has a cli-ent distribution and site distribution.
i. WS-VLAM client distribution: The WS-VLAM composer, a graphical interface used for creating, modifying, and sub-mitting workflows. Needs Java virtual machine (version1.5 or higher).
ii. WS-VLAM site distribution: The WS-VLAM engine, which is needed for running the workflows in a Grid. The WS-VLAM engine needs a GLOBUS GT4 (4.0.3) installation.
To download these WS-VLAM distributions (Additional file 5) go to http://staff.science.uva.nl/~gvlam/wsvlam/, click the "Distributions" tab and follow the instructions in it.
Competing interests
The authors declare that they have no competing interests.
Authors' contributions
MAI carried out the entire research project and wrote the manuscript. MFvB participated in development of the sta-tistical methods. MR was involved in the conceptualiza-tion of the analytical formula, in the e-Science approach, and in the coordination of the project. ASZB, DV, and WA
[image:8.612.60.293.79.326.2]Genome-wide RIDGES in a human transcriptome map (HTM)
Figure 4
Genome-wide RIDGES in a human transcriptome
map (HTM). Genome-wide RIDGEOGRAMS per
chromo-some for the HTM based on the UCSC release hg18 [4]. The expression levels are mapped to gene number. Each RIDGE-OGRAM displays a composite of both RIDGES (red-shades) and anti-RIDGEs (blue-shades) for different mmFDR rate lev-els: 10% (lighter shade), 5%, 1%, and 0.5% (darker shade). All the different window sizes are depicted because they give dif-ferent specific results. In general, small windows suffer from noise and large windows suffer from lack of detail.
0 500 1000 1500 2000 2500 1 0 500 1000 1500 2000 2500
0 500 1000 1500 2 0 500 1000 1500
0 500 1000 1500 3 0 500 1000 1500
0 500 1000 4 0 500 1000
0 500 1000 5 0 500 1000
0 500 1000 6 0 500 1000
0 500 1000 7 0 500 1000
0 500 1000 8 0 500 1000
0 500 1000 9 0 500 1000
0 500 1000 10 0 500 1000
0 500 1000 11 0 500 1000
0 500 1000 12 0 500 1000 0 500 13 0 500 0 500 14 0 500 0 500 15 0 500
0 500 1000 16 0 500 1000
0 500 1000 17 0 500 1000 0 18 0
0 500 1000 19 0 500 1000 0 500 20 0 500 0 21 0 0 500 22 0 500 0 500 X 0 500 0 Y 0
Chromosome-specific RIDGES in a human transcriptome map (HTM)
Figure 5
Chromosome-specific RIDGES in a human
transcrip-tome map (HTM). Chromosome-specific
RIDGEO-GRAMS per chromosome for the HTM based on the UCSC release hg18 [4]. The expression levels are mapped to gene number. Each RIDGEOGRAM displays a composite of both RIDGES (red-shades) and anti-RIDGEs (blue-shades) for dif-ferent mmFDR rate levels: 10% (lighter shade), 5%, 1%, and 0.5% (darker shade).
0 500 1000 1500 2000 2500 1 0 500 1000 1500 2000 2500
0 500 1000 1500 2 0 500 1000 1500
0 500 1000 1500 3 0 500 1000 1500
0 500 1000 4 0 500 1000
0 500 1000 5 0 500 1000
0 500 1000 6 0 500 1000
0 500 1000 7 0 500 1000
0 500 1000 8 0 500 1000
0 500 1000 9 0 500 1000
0 500 1000 10 0 500 1000
0 500 1000 11 0 500 1000
0 500 1000 12 0 500 1000 0 500 13 0 500 0 500 14 0 500 0 500 15 0 500
0 500 1000 16 0 500 1000
0 500 1000 17 0 500 1000 0 18 0
[image:8.612.318.547.86.328.2]worked on the development and support of WS-VLAM. AHvK developed the methods for the genomic mapping of expression data and was involved in the development of the statistical methods. TMB conceived the study, par-ticipated in its design and coordination and helped to draft the manuscript. All authors read and approved the final manuscript.
Additional material
Acknowledgements
We thank R. Monajemi for assistance with the HTM data sets, R. H. Bis-seling for checking the mathematics, L. O. Hertzberger for his constant sup-port, and J. Batson for proofreading the paper. This work was carried out in the context of the Virtual Laboratory e-Science project http://www.vl-e.nl and BioRange program of the Netherlands Bioinformatics Centre (NBIC). VL-e is supported by a BSIK grant from the Dutch Ministry of Edu-cation, Culture and Science (OC&W) and the ICT innovation program of the Ministry of Economic Affairs (EZ). BioRange is supported by a BSIK grant through the Netherlands Genomics Initiative (NGI).
References
1. Spellman PT, Rubin GM: Evidence for large domains of similarly expressed genes in the Drosophila genome. J Biol 2002, 1:5.
2. Boutanaev AM, Kalmykova AI, Shevelyov YY, Nurminsky DI: Large clusters of co-expressed genes in the Drosophila genome.
Nature 2002, 420:666-669.
3. Roy PJ, Stuart JM, Lund J, Kim SK: Chromosomal clustering of muscle-expressed genes in Caenorhabditis elegans. Nature 2002, 418:975-979.
4. Versteeg R, van Schaik BD, van Batenburg MF, Roos M, Monajemi R, Caron H, Bussemaker HJ, van Kampen AH: The human transcrip-tome map reveals extremes in gene density, intron length, GC content, and repeat pattern for domains of highly and weakly expressed genes. Genome Res 2003, 13:1998-2004. 5. Sabo PJ, Kuehn MS, Thurman R, Johnson BE, Johnson EM, Hua C, Man
Y, Rosenzweig E, Goldy J, Haydock A, Weaver M, Shafer A, Lee K, Neri F, Humbert R, Singer MA, Richmond TA, O Dorschner M, McArthur M, Hawrylycz M, Green RD, Navas PA, Noble WS, Stama-toyannopoulos JA: Genome-scale mapping of DNase I sensitiv-ity in vivo using tiling DNA microarrays. Nature Methods 2006,
3:511-518.
6. Birney E, Stamatoyannopoulos JA, Dutta A, Guigo R, Gingeras TR, Margulies EH, Weng ZP, Snyder M, Dermitzakis ET, Stamatoyannop-oulos JA, Thurman RE, Kuehn MS, Taylor CM, Neph S, Koch CM, Asthana S, Malhotra A, Adzhubei I, Greenbaum JA, Andrews RM, Flicek P, Boyle PJ, Cao H, Carter NP, Clelland GK, Davis S, Day N, Dhami P, Dillon SC, Dorschner MO, Fiegler H, Giresi PG, Goldy J, Hawrylycz M, Haydock A, Humbert R, James KD, Johnson BE, John-son EM, Frum TT, Rosenzweig ER, Karnani N, Lee K, Lefebvre GC, Navas PA, Neri F, Parker SCJ, Sabo PJ, Sandstrom R, Shafer A, Vetrie D, Weaver M, Wilcox S, Yu M, Collins FS, Dekker J, Lieb JD, Tullius TD, Crawford GE, Sunyaev S, Noble WS, Dunham I, Dutta A, Guigo R, Denoeud F, Reymond A, Kapranov P, Rozowsky J, Zheng DY, Cas-telo R, Frankish A, Harrow J, Ghosh S, Sandelin A, Hofacker IL, Baert-sch R, Keefe D, Flicek P, Dike S, Cheng J, HirBaert-sch HA, Sekinger EA, Lagarde J, Abril JF, Shahab A, Flamm C, Fried C, Hackermuller J, Her-tel J, Lindemeyer M, Missal K, Tanzer A, Washietl S, Korbel J, Emanuelsson O, Pedersen JS, Holroyd N, Taylor R, Swarbreck D, Matthews N, Dickson MC, Thomas DJ, Weirauch MT, Gilbert J, Drenkow J, Bell I, Zhao X, Srinivasan KG, Sung WK, Ooi HS, Chiu KP, Foissac S, Alioto T, Brent M, Pachter L, Tress ML, Valencia A, Choo SW, Choo CY, Ucla C, Manzano C, Wyss C, Cheung E, Clark TG, Brown JB, Ganesh M, Patel S, Tammana H, Chrast J, Henrichsen CN, Kai C, Kawai J, Nagalakshmi U, Wu JQ, Lian Z, Lian J, Newburger P, Zhang XQ, Bickel P, Mattick JS, Carninci P, Hayashizaki Y, Weissman S, Dermitzakis ET, Margulies EH, Hubbard T, Myers RM, Rogers J, Sta-dler PF, Lowe TM, Wei CL, Ruan YJ, Snyder M, Birney E, Struhl K, Gerstein M, Antonarakis SE, Gingeras TR, Brown JB, Flicek P, Fu YT, Keefe D, Birney E, Denoeud F, Gerstein M, Green ED, Kapranov P, Karaoz U, Myers RM, Noble WS, Reymond A, Rozowsky J, Struhl K, Siepel A, Stamatoyannopoulos JA, Taylor CM, Taylor J, Thurman RE, Tullius TD, Washietl S, Zheng DY, Liefer LA, Wetterstrand KA, Good PJ, Feingold EA, Guyer MS, Collins FS, Margulies EH, Cooper GM, Asimenos G, Thomas DJ, Dewey CN, Siepel A, Birney E, Keefe D, Hou MM, Taylor J, Nikolaev S, Montoya-Burgos JI, Loytynoja A, Whelan S, Pardi F, Massingham T, Brown JB, Huang HY, Zhang NR, Bickel P, Holmes I, Mullikin JC, Ureta-Vidal A, Paten B, Seringhaus M, Church D, Rosenbloom K, Kent WJ, Stone EA, Gerstein M, Antona-rakis SE, Batzoglou S, Goldman N, Hardison RC, Haussler D, Miller W, Pachter L, Green ED, Sidow A, Weng ZP, Trinklein ND, Fu YT, Zhang ZDD, Karaoz U, Barrera L, Stuart R, Zheng DY, Ghosh S, Flicek P, King DC, Taylor J, Ameur A, Enroth S, Bieda MC, Koch CM, Hirsch HA, Wei CL, Cheng J, Kim J, Bhinge AA, Giresi PG, Jiang N, Liu J, Yao F, Sung WK, Chiu KP, Vega VB, Lee CWH, Ng P, Shahab A, Sekinger EA, Yang A, Moqtaderi Z, Zhu Z, Xu XQ, Squazzo S, Ober-ley MJ, Inman D, Singer MA, Richmond TA, Munn KJ, Rada-Iglesias A, Wallerman O, Komorowski J, Clelland GK, Wilcox S, Dillon SC, Andrews RM, Fowler JC, Couttet P, James KD, Lefebvre GC, Bruce AW, Dovey OM, Ellis PD, Dhami P, Langford CF, Carter NP, Vetrie D, Kapranov P, Nix DA, Bell I, Patel S, Rozowsky J, Euskirchen G, Hartman S, Lian J, Wu JQ, Urban AE, Kraus P, Van Calcar S, Heintz-man N, Kim TH, Wang K, Qu CX, Hon G, Luna R, Glass CK, Rosen-feld MG, Aldred SF, Cooper SJ, Halees A, Lin JM, Shulha HP, Zhang XL, Xu MS, Haidar JNS, Yu Y, Birney E, Weissman S, Ruan YJ, Lieb JD, Iyer VR, Green RD, Gingeras TR, Wadelius C, Dunham I, Struhl K, Hardison RC, Gerstein M, Farnham PJ, Myers RM, Ren B, Snyder M, Thomas DJ, Rosenbloom K, Harte RA, Hinrichs AS, Trumbower H, Clawson H, Hillman-Jackson J, Zweig AS, Smith K, Thakkapallayil A, Barber G, Kuhn RM, Karolchik D, Haussler D, Kent WJ, Dermitzakis
Additional file 1
Derivation of the exact formula for the probability function f(m), and detailed description of the mmFDR-procedure.
Click here for file
[http://www.biomedcentral.com/content/supplementary/1756-0500-1-63-S1.pdf]
Additional file 2
Additional Figures. Click here for file
[http://www.biomedcentral.com/content/supplementary/1756-0500-1-63-S2.pdf]
Additional file 3
Description of alternative SigWin-detector workflow configurations. Click here for file
[http://www.biomedcentral.com/content/supplementary/1756-0500-1-63-S3.pdf]
Additional file 4
Applicability of SigWin-detector: periodic time series of air quality data. Click here for file
[http://www.biomedcentral.com/content/supplementary/1756-0500-1-63-S4.pdf]
Additional file 5
This tar file contains the source files of the WS-VLAM modules needed to run the SigWin-detector workflow, and some examples. To uncompress use. ▪ tar -xvzf SigWin-VLAM.v1.1.tar.gz (Linux users). ▪ WinZip or a similar tool.
Click here for file
Publish with BioMed Central and every scientist can read your work free of charge
"BioMed Central will be the most significant development for disseminating the results of biomedical researc h in our lifetime."
Sir Paul Nurse, Cancer Research UK
Your research papers will be:
available free of charge to the entire biomedical community peer reviewed and published immediately upon acceptance cited in PubMed and archived on PubMed Central yours — you keep the copyright
Submit your manuscript here: BioMedcentral ET, Armengol L, Bird CP, Clark TG, Cooper GM, de Bakker PIW,
Kern AD, Lopez-Bigas N, Martin JD, Stranger BE, Thomas DJ, Woodroffe A, Batzoglou S, Davydov E, Dimas A, Eyras E, Hallgrims-dottir IB, Hardison RC, Huppert J, Sidow A, Taylor J, Trumbower H, Zody MC, Guigo R, Mullikin JC, Abecasis GR, Estivill X, Birney E, Bouffard GG, Guan XB, Hansen NF, Idol JR, Maduro VVB, Maskeri B, McDowell JC, Park M, Thomas PJ, Young AC, Blakesley RW, Muzny DM, Sodergren E, Wheeler DA, Worley KC, Jiang HY, Weinstock GM, Gibbs RA, Graves T, Fulton R, Mardis ER, Wilson RK, Clamp M, Cuff J, Gnerre S, Jaffe DB, Chang JL, Lindblad-Toh K, Lander ES, Kori-abine M, Nefedov M, Osoegawa K, Yoshinaga Y, Zhu BL, de Jong PJ:
Identification and analysis of functional elements in 1% of the human genome by the ENCODE pilot project. Nature 2007,
447:799-816.
7. Eckhardt F, Lewin J, Cortese R, Rakyan VK, Attwood J, Burger M, Bur-ton J, Cox TV, Davies R, Down TA, Haefliger C, HorBur-ton R, Howe K, Jackson DK, Kunde J, Koenig C, Liddle J, Niblett D, Otto T, Pettett R, Seemann S, Thompson C, West T, Rogers J, Olek A, Berlin K, Beck S:
DNA methylation profiling of human chromosomes 6, 20 and 22. Nature Genetics 2006, 38:1378-1385.
8. van Steensel B: Mapping of genetic and epigenetic regulatory networks using microarrays. Nature Genetics 2005, 37:S18-S24. 9. Pollack JR, Perou CM, Alizadeh AA, Eisen MB, Pergamenschikov A,
Williams CF, Jeffrey SS, Botstein D, Brown PO: Genome-wide analysis of DNA copy-number changes using cDNA microar-rays. Nature Genetics 1999, 23:41-46.
10. Su AI, Cooke MP, Ching KA, Hakak Y, Walker JR, Wiltshire T, Orth AP, Vega RG, Sapinoso LM, Moqrich A, Patapoutian A, Hampton GM, Schultz PG, Hogenesch JB: Large-scale analysis of the human and mouse transcriptomes. Proceedings of the National Academy of Sciences of the United States of America 2002, 99:4465-4470. 11. Yanai I, Benjamin H, Shmoish M, Chalifa-Caspi V, Shklar M, Ophir R,
Bar-Even A, Horn-Saban S, Safran M, Domany E, Lancet D, Shmueli O:
Genome-wide midrange transcription profiles reveal expression level relationships in human tissue specification.
Bioinformatics 2005, 21:650-659.
12. Halasz G, van Batenburg MF, Perusse J, Hua S, Lu XJ, White KP, Bussemaker HJ: Detecting transcriptionally active regions using genomic tiling arrays. Genome Biology 2006, 7:.
13. Rauwerda H, Roos M, Hertzberger BO, Breit TM: The promise of a virtual lab in drug discovery. Drug Discovery Today 2006,
11:228-236.
14. Goble C: The low down on e-science and grids for biology.
Comparative and Functional Genomics 2001, 2:365-370.
15. Oehmen CS, Straatsma TP, Anderson GA, Orr G, Webb-Robertson BJM, Taylor RC, Mooney RW, Baxter DJ, Jones DR, Dixon DA: New challenges facing integrative biological science in the post-genomic era. Journal of Biological Systems 2006, 14:275-293. 16. Inda MA, Belloum ASZ, Roos M, Vasunin D, de Laat C, Hertzberger
LO, Breit TM: Interactive Workflows in a Virtual Laboratory for e-Bioscience: the SigWin-Detector Tool for Gene Expression Analysis. In Proceedings of the e-Science 2006; Amster-dam IEEE CS Press; 2006.
17. Post LJG, Roos M, Marshall MS, van Driel R, Breit TM: A semantic web approach applied to integrative bioinformatics experi-mentation: a biological use case with genomics data. Bioinfor-matics 2007, 23:3080-3087.
18. Ludascher B, Altintas I, Berkley C, Higgins D, Jaeger E, Jones M, Lee EA, Tao J, Zhao Y: Scientific workflow management and the Kepler system. Concurrency and Computation-Practice & Experience 2006, 18:1039-1065.
19. Hull D, Wolstencroft K, Stevens R, Goble C, Pocock MR, Li P, Oinn T: Taverna: a tool for building and running workflows of serv-ices. Nucleic Acids Research 2006, 34:W729-W732.
20. Korkhov V, Vasunin D, Wibisono A, Belloum ASZ, Inda MA, Roos M, Breit T, Hertzberger BLO: VLAM-G: Interactive Dataflow Driven Engine for Grid-enabled Resources. Scientific Program-ming 2007, 15:173-188.
21. WS-VLAM [http://www.science.uva.nl/~gvlam/wsvlam]
22. Hardle W, Steiger W: Optimal Median Smoothing. Applied Sta-tistics-Journal of the Royal Statistical Society Series C 1995, 44:258-264. 23. DAS3, The Distributed ASCI Supercomputer 3 [http://
www.cs.vu.nl/das3]
24. Goble C, Roure DCD: myExperiment: social networking for workflow-using e-scientists. In Proceedings of the 2nd workshop on