Improved models for the prediction of
breeding values in trees
by
Gregory Wojtek Dutkowski B. F. Sc. (Hons) (University
of Melbourne)
A thesis submitted in fulfilment of the requirements for the Degree of Doctor of Philosophy
University of Tasmania
This thesis contains no material which has been accepted for the award of any other degree or diploma in any tertiary institution, and to the best of my knowledge and belief, contains no material previously published or written by another person, except where due reference is made in the text of the thesis.
………
Greg Dutkowski
This thesis may be made available for loan and limited copying in accordance with
the Copyright Act 1968.
………
Abstract
This thesis develops a number of tools and strategies for the adaptation to forest trees
of the individual additive genetic model for the prediction of breeding values.
Eucalyptus globulus ssp. globulus andcentral Victorian E. nitens are the most important temperate hardwood plantation species in Australia. The geographic
patterns of variation in these species were examined using multivariate analysis of
open pollinated base population progeny trials. Race classifications were developed
from these patterns. New divisions were identified and previously separated
provenances were amalgamated. Prediction of breeding values for a variety of traits
for E globulus showed that the inclusion of races improved the model and increased selection gains by up to 20%.
One problem in the prediction of breeding values in open pollinated base population
progeny trials of many genera, including Eucalyptus, is that the parents and their offspring do not conform to the assumptions usually made about relatedness in the
construction of the additive relationship matrix. An algorithm was developed to
modify the additive relationship matrix, and generate its inverse, using simple rules,
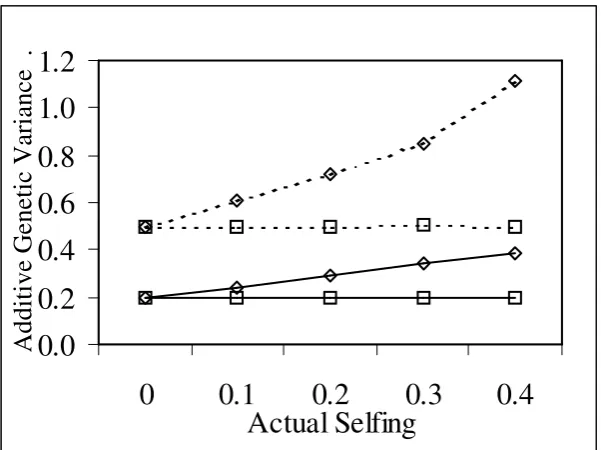
where parental inbreeding and partial selfing occurs. In simulated data sets, use of the
modified relationship matrix lead to unbiased heritability and breeding value
estimates. If the correct variance components were used with an incorrect
relationship matrix, then the correlation between breeding values was high, but the
offspring breeding values were deflated and parental breeding values were inflated.
Breeding value prediction can be further improved by better modelling of
environmental variations within trials. The spatial analysis of forest genetic trials
using separable autoregressive processes of residuals was adapted from agricultural
variety yield trial analysis following the comparison of a number of approaches for
five selected forest genetic trials. Augmenting the design model with a spatially
auto-correlated component was found to be a good general model which lead to large
reductions in design feature effects. The spatial component was found to be relatively
small, but with high auto-correlations indicating features spread over relatively large
areas. Models without an independent error term were poorer and lead to inflation of
successful and resulted in only marginal increases in selection gain.
Applying the model to 216 variables from 55 forestry trials resulted in selection gains
of more than 10% in around one tenth of cases, although in general the gains were
more modest. For growth data, the auto-correlations were generally high, indicating a
smooth environmental surface, but they were lower for other traits such a pest and
disease damage, indicating more patchiness. Auto-correlations less than zero,
indicating competition was dominant, occurred for some large diameter trials, but a
bimodal likelihood surface indicated competition was present in more cases. Traits
such as stem counts, and form and branching scores, did not respond as often to
spatial analysis.
The race classifications, modified relationship matrix, and better environmental
modelling developed in the thesis will allow better application of the individual tree
Acknowledgments
I would like to thank my supervisors during my thesis, Arthur Gilmour, Brad Potts,
and, early on, Nuno Borralho, for their support in executing this work. I am sure that
I have been both the best and worst student for them. Best, as I haven’t bothered
them too much. Worst, as I haven’t bothered them too much as I have been doing lots
of other things during the nine years (part-time!) that it has taken me to finish the
work that comprises the thesis. So, again, for their support and patience, thank you. I
am doubly indebted to Arthur Gilmour for his wonderful software ASReml. Its ease
of use has grown over the years, and its power and flexibility remain unsurpassed. It
has provided both the inspiration for much of my work, and the means of carrying it
out.
While there have been a large number of co-authors in the published work that makes
up the thesis, foremost amongst these has been my long time collaborator on the
spatial work, João Costa e Silva. Thanks for all the help and stimulating discussion.
As each of the works in the thesis contains its own acknowledgements, I will go no
further here than to thank all of the co-authors, technicians, companies and individuals
who have designed the experiments and carried out the measurements upon which this
thesis work is based. Without their diligent work there would have been no thesis. In
quantitative genetics work in forestry it is normally the case that you are analysing
someone else’s data, saving you the hassle of dusting off your steel-capped boots, and
replacing your out-of-date hard hat.
Finally, I would like to thank my family, who have had to put up with me
disappearing back to work after dinner and shirking housework for far too long. Mind
you, I don’t know how much of that will change in the future as there are always more
While studying part-time I have also been the author or co-author of a number of
other works that were not included in this thesis. Below I include a list of all refereed
and unrefereed publications that have been produced during the term of this thesis.
Those which are part of this thesis are marked with an asterisk.
Refereed Publications
Borralho N.M.G., Dutkowski G.W. (1998) Comparison of rolling front and discrete
generation breeding strategies for trees. Canadian Journal of Forest Research28, 987-993.
Costa e Silva J., Dutkowski G.W., Borralho N.M.G. (2005) Across-site heterogeneity
of genetic and environmental variances in the genetic evaluation of Eucalyptus
globulus trials for height growth. Annals of Forest Science62, 183-191.
Costa e Silva J., Dutkowski G.W., Gilmour A.R. (2001) Analysis of early tree height
in forest genetic trials is enhanced by including a spatially correlated residual.
Canadian Journal of Forest Research31, 1887-1893.
*Dutkowski G.W., Costa e Silva J., Gilmour A.R., Lopez G.A. (2002) Spatial analysis
methods for forest genetic trials. Canadian Journal of Forest Research32, 2201-2214.
*Dutkowski G.W., Costa e Silva J., Gilmour A.R., Wellendorf H., Aguiar A. (2005)
Spatial analysis enhances modelling of a wide variety of traits in forest genetic trials.
Canadian Journal of Forest Researchsubmitted.
*Dutkowski G.W., Potts B.M. (1999) Geographical patterns of genetic variation in
Eucalyptus globulus ssp. globulus and a revised racial classification. Australian
Journal of Botany46, 237-263.
Freeman J.S., Jackson H.D., Steane D.A., McKinnon G.E., Dutkowski G.W., Potts
B.M., Vaillancourt R.E. (2001) Chloroplast DNA phylogeography of Eucalyptus
Lopez G.A., Potts B.M., Dutkowski G.W., Apiolaza L.A., Gelid P. (2002) Genetic
variation and inter-trait correlations in Eucalyptus globulus base population trials in Argentina. Forest Genetics9, 223-237.
Lopez G.A., Potts B.M., Dutkowski G.W., Traverso J.M.R. (2001) Quantitative
genetics of Eucalyptus globulus: Affinities of land race and native stand localities.
Silvae Genetica50, 244-252.
Unrefereed Publications
Borralho N.M.G., Dutkowski G.W. (1996) A 'rolling-front' strategy for breeding trees.
In proceedings of QFRI - IUFRO Conference 'Tree Improvement for Sustainable
Tropical Forestry'. (Eds M.J. Dieters, A.C. Matheson, D.G. Nikles, C.E. Harwood and
S.M. Walker). 27 October - 1 November, Caloundra, Queensland. Vol. 2. pp.
317-322. (Queensland Forest Research Institute: Gympie, Queensland)
Costa e Silva J., Dutkowski G.W., Gilmour A.R. (1999) 'Spatial analysis of forest
genetic trials.' Internal Report, 16 pp. (Royal Veterinary and Agricultural University:
Horsholm, Denmark)
Dutkowski G.W. (2000) 'Eucalyptus globulus race classification confirmed and extended.' Hot Off the Seed Bed 32, 2 pp. (CRC-SPF: Hobart, Tasmania)
Dutkowski G.W. (2004) Gains from clonal breeding and deployment. In proceedings
of IUFRO Conference 'Eucalyptus in a Changing World'. (Eds N.M.G. Borralho, J.S. Pereira, C. Marques, J. Coutinho, M. Madeira and M. Tomé). 11-15 October, Aveiro,
Portugal. p. 163. (RAIZ, Instituto Investigação de Floresta e Papel: Aveiro, Portugal)
Dutkowski G.W. (2004) GSIM - a tree breeding and deployment simulator. In
proceedings of IUFRO Conference 'Eucalyptus in a Changing World'. (Eds N.M.G.
Borralho, J.S. Pereira, C. Marques, J. Coutinho, M. Madeira and M. Tomé). 11-15
October, Aveiro, Portugal. p. 189. (RAIZ, Instituto Investigação de Floresta e Papel:
Aveiro, Portugal)
Dutkowski G.W. (2004) GSOOP - a open-pollinated seed orchard management tool
Madeira and M. Tomé). 11-15 October, Aveiro, Portugal. p. 165. (RAIZ, Instituto
Investigação de Floresta e Papel: Aveiro, Portugal)
Dutkowski G.W., Bail I.R., Gore P.L., Powell M.B. (1998) 'Eucalyptus Realised
Gains Trials Design.' Technical Report TR98-02. (Southern Tree Breeding
Association: Mount Gambier, South Australia)
Dutkowski G.W., Costa e Silva J., Gilmour A.R. (2001) Spatial analysis of forest
genetic trials. In proceedings of IUFRO International Symposium 'Developing the
Eucalypt of the Future'. 10-15 September, Valdivia, Chile. p. 141. (INFOR: Santiago,
Chile)
Dutkowski G.W., Gilmour A.R., Borralho N.M.G. (1996) Analysis of growth data
using ARMA spatial models. In proceedings of QFRI - IUFRO Conference 'Tree
Improvement for Sustainable Tropical Forestry'. (Eds M.J. Dieters, A.C. Matheson,
D.G. Nikles, C.E. Harwood and S.M. Walker). 27 October - 1 November, Caloundra,
Queensland, Australia. (Queensland Forest Research Institute: Gympie, Queensland)
Dutkowski G.W., Gilmour A.R., Borralho N.M.G. (1997) Application of spatial
analysis to tree breeding trials. In proceedings of 'IUFRO Conference on Silviculture
and Improvement of Eucalypts'. (Eds A.R. Higa, E. Schaitza and S. Gaiad). 24-29
August, Salvador, Bahia, Brazil. Vol. 1. p. 83. (EMBRAPA: Colombo, Brazil)
*Dutkowski G.W., Gilmour A.R., Borralho N.M.G. (2001) Modification of the
additive relationship matrix for open pollinated trials. In proceedings of IUFRO
International Symposium 'Developing the Eucalypt of the Future'. 10-15 September,
Valdivia, Chile. (INFOR: Santiago, Chile)
Dutkowski G.W., Gore P.L., McRae T., Pilbeam D., Apiolaza L. (2000) 'The STBA
Cooperative Tree Improvement Strategy for Eucalyptus globulus.' Technical Report TR99-03, 30 pp. (Southern Tree Breeding Association/CRCSPF: Mount Gambier,
South Australia / Hobart, Tasmania)
*Dutkowski G.W., Potts B.M., Borralho N.M.G. (1997) Revised racial classification
of progeny trials. In proceedings of 'IUFRO Conference on Silviculture and
Improvement of Eucalypts'. (Eds A.R. Higa, E. Schaitza and S. Gaiad). 24-29 August,
Salvador, Bahia, Brazil. Vol. 1. pp. 322-329. (EMBRAPA: Colombo, Brazil)
Dutkowski G.W., Potts B.M., Williams D.R., Kube P.D., McArthur C. (2001)
Geographic genetic variation in Central Victorian Eucalyptus nitens. In proceedings of IUFRO International Symposium 'Developing the Eucalypt of the Future'. 10-15
September, Valdivia, Chile. p. 39. (INFOR: Santiago, Chile)
Dutkowski G.W., Raymond C.A. (2001) A decision support tool for expensive to
measure traits in progeny trials. In proceedings of IUFRO International Symposium
'Developing the Eucalypt of the Future'. 10-15 September, Valdivia, Chile. (INFOR:
Santiago, Chile)
Dutkowski G.W., Whittock S.P. (2004) 'Gains from Clonal Breeding and
Deployment.' 9 pp. (CRC-SPF: Hobart, Tasmania)
Greaves B.L., Dutkowski G.W., McRae T.A. (2004) Breeding objectives for
Eucalyptus globulus for products other than kraft pulp. In proceedings of IUFRO
Conference 'Eucalyptus in a Changing World'. (Eds N.M.G. Borralho, J.S. Pereira, C. Marques, J. Coutinho, M. Madeira and M. Tomé). 11-15 October, Aveiro, Portugal.
pp. 175-180. (RAIZ, Instituto Investigação de Floresta e Papel: Aveiro, Portugal)
Greaves B.L., Dutkowski G.W., Raymond C.A., Bamess M., Bulinski J. (2004) Basic
density inventory of routine Eucalyptus globulus plantations. In proceedings of IUFRO Conference 'Eucalyptus in a Changing World'. (Eds N.M.G. Borralho, J.S.
Pereira, C. Marques, J. Coutinho, M. Madeira and M. Tomé). 11-15 October, Aveiro,
Portugal. pp. 189-190. (RAIZ, Instituto Investigação de Floresta e Papel: Aveiro,
Portugal)
Greaves B.L., Hamilton M., Pilbeam D.J., Dutkowski G.W. (2004) Genetic variation
in commercial properties of six and fifteen year-old Eucalyptus globulus. In
proceedings of IUFRO Conference 'Eucalyptus in a Changing World'. (Eds N.M.G.
Borralho, J.S. Pereira, C. Marques, J. Coutinho, M. Madeira and M. Tomé). 11-15
Jordan G.J., Dutkowski G.W., Potts B.M., MacDonald A.C., Tilyard P., Borralho
N.M.G. (1998) 'Genetic variation in North Forest Products' Eucalyptus globulus ssp.
globulus base population trials.' Technical Report 8. (Cooperative Research Centre for Sustainable Production Forestry: Hobart, Tasmania, Australia)
Kerr R.J., Dutkowski G.W., Apiolaza L.A., McRae T.A., Tier B. (2002) Developing a
genetic evaluation system for forest tree improvement - the making of TREEPLAN®.
In proceedings of '7th World Congress on Genetics Applied to Livestock Production'.
19-23 August, Montpellier, France.
Kerr R.J., McRae T.A., Dutkowski G.W., Apiolaza L.A., Tier B. (2001) TREEPLAN
- a genetic evaluation system for forest tree improvement. In proceedings of
'Developing the Eucalypt of the Future'. 10-15 September, Valdivia, Chile. (INFOR:
Santiago, Chile)
Kube P.D., Dutkowski G.W. (2002) 'Estimation of Eucalyptus nitens breeding values for volume, basic density, pulp yield and branch size at RP252/8 & 9.' Technical
Report 28/2002, 21 pp. (Forestry Tasmania: Hobart, Tasmania)
Lopez G.A., Apiolaza L.A., Potts B.M., Dutkowski G.W., Gelid P., Rodriguez
Traverso J.M. (2001) Genetic parameters of Eucalyptus globulus in Argentina. In proceedings of IUFRO International Symposium 'Developing the Eucalypt of the
Future'. 10-15 September, Valdivia, Chile. (INFOR: Santiago, Chile)
Lopez G.A., Potts B.M., Dutkowski G.W., Rodriguez Traverso J.M., Gelid P.E.
(2001) Quantitative genetic affinities of land races and native stand localities of
Eucalyptus globulus. In proceedings of IUFRO International Symposium 'Developing the Eucalypt of the Future'. 10-15 September, Valdivia, Chile. (INFOR: Santiago,
Chile)
McRae T.A., Dutkowski G.W., Pilbeam D.J., Powell M.B., Tier B. (2004) Genetic
Evaluation Using the TREEPLAN® System. In proceedings of IUFRO Joint
Conference Division 2 'Forest Genetics and Tree Breeding in the Age of Genomics:
Carolina. (North Carolina State University: Raleigh, North Carolina)
McRae T.A., Pilbeam D.J., Gore P.L., Dutkowski G.W., Apiolaza L.A. (2001)
Australian cooperative tree improvement strategy for Eucalyptus globulus. In proceedings of IUFRO International Symposium 'Developing the Eucalypt of the
Future'. 10-15 September, Valdivia, Chile. p. 179. (INFOR: Santiago, Chile)
Pilbeam D.J., Dutkowski G.W. (2004) Simulation to determine optimal wood quality
sampling strategies. In proceedings of IUFRO Conference 'Eucalyptus in a Changing
World'. (Eds N.M.G. Borralho, J.S. Pereira, C. Marques, J. Coutinho, M. Madeira and
M. Tomé). 11-15 October, Aveiro, Portugal. pp. 211-212. (RAIZ, Instituto
Investigação de Floresta e Papel: Aveiro, Portugal)
Potts B.M., Dutkowski G., Jordan G., Vaillancourt R.E. (1999) Providing a
population genetic framework for exploitation of eucalypt genetic resources: The case
of Eucalyptus globulus. In proceedings of proceedings of ‘11th Australian Plant Breeding Conference’. (Eds P. Langridge, A. Barr, G. Auricht, G. Collins, A.
Granger, D. Handford and J. Paull). Adelaide, South Australia, 19-23 April. Vol. 1
Invited Papers pp. 97-101. (CRC for Molecular Plant Breeding: Adelaide, South
Australia)
Potts B.M., Lopez G.A., Volker P.W., Dutkowski G.W., Jordan G.J., Apiolaza L.A.,
Vaillancourt R.E. (2002) Genetic impacts on the productivity of Eucalyptus globulus. In proceedings of 'EucProd 2002: International Conference on Eucalypt Productivity'.
1-5 November 2002, Hobart, Tasmania. p. 28. (CRC for Sustainable Production
Forestry: Hobart, Tasmania)
Potts B.M., Milgate A., Joyce K., Mohammed C.L., Vaillancourt R.E., Dutkowski
G.W. (2004) Quantitative genetic control of Mycosphaerella resistance in Eucalyptus
globulus and impact on growth. In proceedings of IUFRO Conference 'Eucalyptus in a changing world'. (Eds N.M.G. Borralho, J.S. Pereira, C. Marques, J. Coutinho, M.
Madeira and M. Tomé). 11-15 October, Aveiro, Portugal. pp. 116-122. (RAIZ,
Instituto Investigação de Floresta e Papel: Aveiro, Portugal)
Tomé). 11-15 October, Aveiro, Portugal. pp. 46-61. (RAIZ, Instituto Investigação de
Floresta e Papel: Aveiro, Portugal)
Whittock S.P., Apiolaza L.A., Dutkowski G.W., Greaves B.L., Potts B.M. (2004)
Carbon revenues and economic breeding objectives in Eucalyptus globulus pulpwood plantations. In proceedings of IUFRO Conference 'Euclayptus in a changing world'.
(Eds N.M.G. Borralho, J.S. Pereira, C. Marques, J. Coutinho, M. Madeira and M.
Tomé). 11-15 October, Aveiro, Portugal. pp. 146-150. (RAIZ, Instituto Investigação
Table of Contents
Declarations ...ii
Abstract ... iii
Table of Contents ... xiii
List of Figures ...xvii
List of Tables ...xx
Chapter 1 Introduction...1
Chapter 2 Geographical patterns of genetic variation in Eucalyptus globulus ssp. globulus and a revised racial classification...5
2.1 Summary ...5
2.2 Introduction...5
2.3 Materials and Methods...8
2.4 Results...15
2.4.1 Spatial Patterns...15
2.4.2 Correlations...20
2.4.3 Race Classification...21
2.5 Discussion ...29
2.5.1 Regional Patterns ...29
2.5.2 Correlation between Traits...31
2.5.3 Racial Classification ...33
2.6 Conclusion ...39
2.7 Acknowledgments...39
3.2 Introduction...40
3.3 Materials And Methods...42
3.4 Results...43
3.5 Discussion ...44
3.6 Conclusion ...45
3.7 Acknowledgements...45
Chapter 4 Geographic Genetic Variation in, and Race Classification of, Central Victorian Eucalyptus nitens...46
4.1 Summary ...46
4.2 Introduction...47
4.3 Materials and Methods...48
4.4 Results...53
4.5 Discussion ...57
4.6 Conclusion ...58
4.7 Acknowledgements...58
Chapter 5 Inversion of the A matrix under parental inbreeding and partial selfing .60 5.1 Summary ...60
5.2 Introduction...60
5.3 Materials and Methods...64
5.3.1 Derivation of A-1 under partial selfing and parental inbreeding ...64
5.4 Results...72
5.5 Discussion ...76
5.6 Conclusion ...78
Chapter 6 Development and comparison of methodology of spatial analysis ...79
6.1 Summary ...79
6.2 Introduction...80
6.3 Materials and methods ...83
6.3.1 Data sets ...83
6.3.2 The general statistical model ...83
6.3.3 Standard models...85
6.3.4 Variance parameters and model comparison ...87
6.3.5 Impact on selection ...88
6.3.6 Extended spatial models ...88
6.4 Results...93
6.4.1 Standard models...93
6.4.2 Extended spatial models ...96
6.4.3 Variance parameters and accuracy of breeding value predictions...99
6.4.4 Breeding value correlations and relative genetic gains...103
6.5 Discussion ...103
6.6 Conclusion ...107
6.7 Acknowledgements...107
7.2 Introduction...109
7.3 Materials and methods ...111
7.3.1 Data sets ...111
7.3.2 Model fitting ...117
7.4 Results...122
7.5 Discussion ...135
7.6 Conclusion ...141
7.7 Acknowledgements...141
Chapter 8 Concluding Discussion ...143
List of Figures
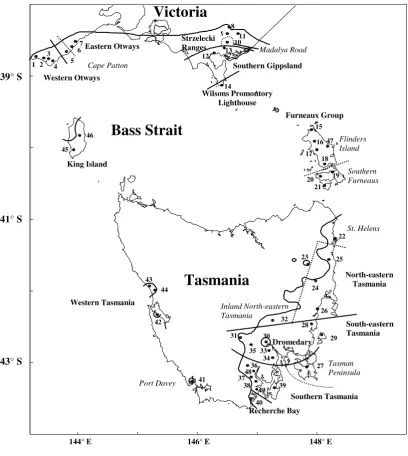
Figure 2-1 Location of seed collection localities with respect to the species
distribution. ...10
Figure 2-2 Geographic variation of traits. Locality means of synthetic, leaf morphology and other traits. ...18
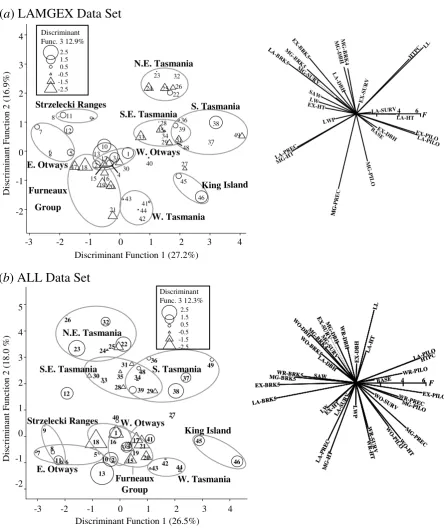
Figure 2-3 Locality scores on the major discriminant functions. ...24
Figure 2-4 Geographic variation of discriminant scores...25
Figure 2-5 Average linkage clustering of localities...28
Figure 2-6 The revised racial classification. ...32
Figure 4-1 Distribution of Eucalyptus nitens and E. denticulata in Australia...47
Figure 4-2 Species distribution, sub-provenances, and localities of central Victorian Eucalyptus nitens. ...49
Figure 4-3 Discriminant function scores for localities on the first three axes. ...56
Figure 4-4 Average linkage clustering of the significant discriminant axis scores and the proposed races...57
Figure 5-1 The effect of parental inbreeding (F) and selfing rate on the parent-offspring relationship. ...66
Figure 5-2 The effect of parental inbreeding (F) and selfing rate on the offspring-offspring relationship. ...66
Figure 5-3 The effect of parental inbreeding (F) and selfing rate on the offspring inbreeding (F)...67
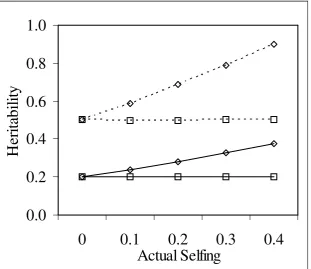
Figure 5-4 Additive variance estimates at different rates of selfing. ...73
Figure 5-7 Correlation (r) between true and predicted parental breeding values for
different rates of selfing. ...74
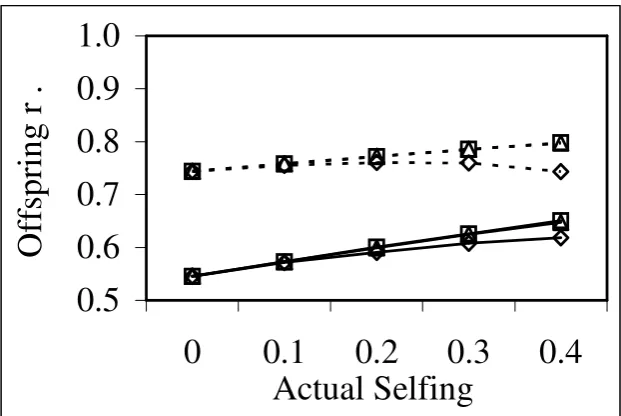
Figure 5-8 Correlation (r) between true and predicted offspring breeding values for different rates of selfing. ...75
Figure 5-9 Slope (b) of the relationship between true and predicted parental breeding values for different rates of selfing. ...75
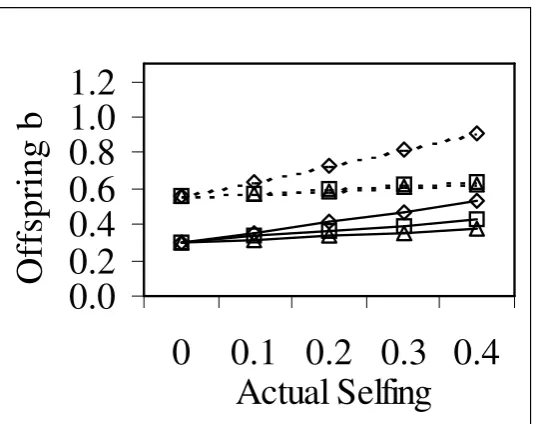
Figure 5-10 Slope (b) of the relationship between true and predicted offspring breeding values for different rates of selfing. ...76
Figure 5-11 Gain relative to the KNOWN model for different rates of selfing. ...77
Figure 6-1 Simulated AR1⊗AR1 process for a 40 x 40 grid. ...90
Figure 6-2 Simulated AR1⊗AR1 process with independent error for a 40 x 40 grid. ...91
Figure 6-3 Data, best base model surface and variogram...95
Figure 6-4 Extended model surfaces and variograms...98
Figure 7-1 Height and diameter (0.3 or 1.3m) growth for each trial. ...116
Figure 7-2 Changes in log likelihood (∆LogL) from adding within replicate design features and spatial components to the simplified design model for more complex trial designs. ...124
Figure 7-3 Spatial and independent error variance in spatial model by trait type. ...125
Figure 7-4 Distribution of auto-correlations by trial shape and trait type. ...126
Figure 7-5 Spatial (Sp) and extended spatial (Sp+) models for variables with highly asymmetric auto-correlations...127
...130
Figure 7-7 Genetic variance (additive or clonal) for design and spatial models by trait
type...131
Figure 7-8 Change in additive genetic value accuracy for spatial models by trait type.
...132
Figure 7-9 Correlation between breeding values from the design and spatial models
for parents and offspring by trait type...133
Figure 7-10 Gain from selection for spatial models by trait type. ...134
Figure 8-1 Eucalyptus globulus locality variation on the major discriminant functions from Dutkowski (2000a)...143
Figure 8-2 UPGMA clustering of E. globulus native stand and land race localities from Lopez et al. (2001). ...144
Figure 8-3 Revised race and sub-race boundaries. ...147
Table 2-1 Localities sampled in the 1987 and 1988 CSIRO collections of Eucalyptus
globulus that are represented in this analysis...9
Table 2-2 Description of traits measured...12
Table 2-3 Locality ANOVAs and locality mean spatial clustering. ...16
Table 2-4 Principal components analysis of locality means and their spatial clustering. ...17
Table 2-5 Correlations of trait locality means. ...17
Table 2-6 Correlation between locality trait means and climatic variables...20
Table 2-7 Discrimination between localities and their spatial clustering. ...21
Table 2-8 Allocation of localities to race and sub-race groups. ...34
Table 2-9 Summary of attributes of major races from our data and other published information...36
Table 3-1 The effect of including race into the prediction of breeding values...43
Table 4-1 The geographic origin of localities sampled and families used in the trials. ...50
Table 4-2 Distribution of families across the trials and trial design information. ...51
Table 4-3 Traits measured and their means. ...52
Table 4-4 Probability that there are no locality mean differences. ...54
Table 4-5 Correlations between locality means of synthetic traits. ...55
Table 6-1 Trial and trait information. ...84
Table 6-2 Akaike Information Criterion relative to the base model...94
Table 6-3 Variance parameter estimates and breeding value accuracies for selected
standard models and extended spatial models. ...100
Table 6-4 Correlation of breeding values and gains in selection between models...103
Table 7-1 Summary of trials used in the analysis. ...112
Table 7-2 Data analysed (other than growth) grouped by type. ...114
Table 7-3 Distribution of changes in log likelihood with spatial model by trait type.
...123
Table 7-4 Distribution of changes in log-likelihood with respect to the ratio of the
sum of design feature variances to the error variance in the design model and the
number of observations...124
Chapter 1
Introduction
Breeding values, or additive genetic values, represent the average additive effects of
the genes that an individual receives from its parents (Falconer and MacKay 1996). It
is the part of genetic variation that can be used for population improvement through
selection. In progeny trial analysis the challenge is to appropriately separate
environmental from genetic effects so that selections can be made for future breeding
and deployment. In animal breeding, the method of Henderson called best linear
unbiased prediction (BLUP) has been increasingly used for the prediction of breeding
values and other genetic effects, simultaneously with the estimation of other fixed and
random effects in the framework of the Mixed Model Equations (MME) (Henderson
1984; Mrode 1998). The properties of BLUP are neatly incorporated into its name:
• Best – maximises the correlation between true and predicted random effects,
• Linear – predictors are a linear function of the data,
• Unbiased – the expectations of the fixed and random effects are unbiased, and
• Prediction – it involves the prediction of random effects.
The use of the Additive (or Numerator) Relationship Matrix, which takes the
co-ancestry between trees into account, in BLUP further enables it to use all additive
relationships to allow estimation of breeding values of all individuals in the pedigree
and to take selection into account in both the estimation of variances and prediction of
breeding value, if the selection data is included (Henderson 1975).
BLUP differs from BLP (Best Linear Prediction) in that the fixed effects are
estimated, rather than being assumed to be known. Both can be used for the
prediction of random effects, although BLUP has often come to mean prediction of
breeding values through the use of the Numerator Relationship Matrix. White and
Hodge (1989) argue that in many forestry situations fixed effects can be adequately
estimated so the computational complexity of BLUP can be avoided. Certainly in
many situations the problems that led to the development of BLUP for animal
Chapter 1 - Introduction
genetic trend due to multiple generations of data, and more data on better animals due
to culling – are not present in base generation tree breeding programs with large
balanced trials. For animal breeding, prediction of breeding values requires the use of
large data sets because of the lack of structure and experiments in the breeding
populations. This has not been the case for trees.
Increasingly, however, breeding value prediction in forestry trials is moving closer to
the animal breeding model. Programs are moving into advanced generations where
simple trial means are no longer unbiased estimates of site effects, and relatedness and
selection need to be taken into account in variance component estimation and
breeding value prediction. Trial designs are now more complex than the simple
randomised complete block designs of the past with cyclic and computer-generated
designs (Nguyen and Williams 1993) using incomplete blocks within replicates and
models using recovery of inter-block information (Williams and Matheson 1994).
The computational limitations of the past are being removed with the general increase
in processing speed and the development of software such as ASReml (Gilmour et al. 1999) for variance component estimation and solving of the mixed model equations.
These changes are gradually seeing an increase in the use of the mixed model
equations and the numerator relationship matrix in the prediction of breeding values
(Jarvis et al. 1995; Araújo et al. 1997; Fernandez et al. 1998; Soria et al. 1998; Wei and Borralho 2000; Apiolaza and Garrick 2001).
In their comparison of BLP and BLUP, White and Hodge (1989) urged that the
assumptions used in the application of BLUP to animal breeding be examined for
their appropriateness when the method is used in tree breeding. Specifically they
raise the issues of heterogenous variances, estimation of population effects, dealing
with inbreeding and coancenstry, the effect of selection and computational feasibility.
Similarly, Borralho (1995) argued that the problems due to uncertain pedigree in
open-pollinated material, spatial auto-correlation, and heterogenous variances
amongst classes of fixed effects all required attention. This thesis attempts to
examine certain aspects of the use of BLUP in tree breeding to ensure that the models
that are used are the most appropriate.
components and prediction of breeding values. Chapters 2 to 4 examine the
geographic patterns of variation in two plantation eucalypt species that have
worldwide importance, Eucalyptus globulus and E. nitens. Based on multivariate variation, race boundaries are proposed, and the effect of using races on model fit,
variance component estimates and breeding value predictions is examined.
Often in forest trees we are dealing with populations that have been sampled from the
wild which violate some of the assumptions usually made in the construction of the
Numerator Relationship Matrix for animals. The parents are often inbred and the seed
from them is subject to partial selfing which can lead to problems in variance
component estimation (Squillace 1974; Askew and El-Kassaby 1994; Borralho 1994).
In Chapter 5, the Numerator Relationship Matrix is modified to cope with parental
inbreeding and partial selfing, and rules for calculation of its inverse are derived. The
effect of using or ignoring these assumptions on variance component estimation and
breeding value prediction is then examined.
Spatial analysis as a means of better separating environmental from genetic or other
treatment effects in analysis of designed trials has been growing in agriculture for
some years (Braysher et al. 2001; Singh et al. 2003; Yang et al. 2004). Chapter 6 compares different spatial models for their utility in a number of selected tree
breeding trials and recommends a general approach based on model improvement, the
ease of model fitting and gains from selection. Chapter 7 then applies this method to
a large range of data sets in order to examine how widespread its utility is, and
appreciate the likely gains in selection that can be made. The final chapter attempts to
put the thesis in the context of other recent work.
Most of the work presented in this thesis has been previously published in journal
articles and conference proceedings – only the expanded section on the derivation of
the inverse of the Numerator Relationship Matrix in Chapter 5 has been added. As
each chapter is a published work, they have been altered little for the thesis, except to
homogenise format and numbering, and to have a single list of references. As the
works are largely self contained, the introduction and discussion for the thesis is
suitably brief, and there is a small degree of unavoidable repetition in the
Chapter 1 - Introduction
final chapter also attempts to put the work in a current context. I have also elected to
retain the use of “we” in references to the authors of each work as each of these were
the results of collaborations with both my academic supervisors and others.
Chapter 2
Geographical patterns of genetic
variation in
Eucalyptus globulus
ssp.
globulus
and
a revised racial classification
*2.1 Summary
The geographic patterns of genetic variation in a wide variety of quantitative traits
were studied in Eucalyptus globulus ssp. globulus and its intergrades, leading to a revised racial classification. The analysis was based on 35 traits assessed across five
field trials in northern Tasmania from approximately 500 open-pollinated families,
encompassing 49 collection localities in native stands. There were significant
differences between the collection localities for most traits. While growth and
survival exhibited weak spatial structuring, there were clear regional patterns in bark
thickness, wood basic density, flowering precocity and some aspects of juvenile leaf
morphology. There were a number of significant correlations between trait locality
means, but few simple correlations between the regional patterns observed and
climatic variables. Multivariate analyses indicated that the localities could be
effectively amalgamated into larger, geographically concordant races. A hierarchy of
five major groupings of 13 races and 20 subraces is proposed to account for most of
the quantitative genetic variation while allowing for outliers and intermediate
populations. Some areas of the distribution may need further sampling to more
accurately elucidate their racial affinities, especially those with traits of high
economic importance.
2.2 Introduction
Spatially structured genetic variation within a species can arise where genetic drift or
adaptive differentiation are not overcome by the homogenising effects of dispersal
*
Published as Dutkowski, G.W. and Potts, B.M. (1999). Geographical patterns of genetic variation in
Chapter 2 – E. globulus race classification
and gene flow (Endler 1977; Roughgarden 1979). Such is likely to be the case for
widespread plant species with no special mechanisms for dispersal, or for which
barriers to dispersal exist. Natural selection may also act on a number of different
traits, in different places and at different times, resulting in extant patterns of spatial
genetic variation reflecting both current and historic patterns of differentiation.
Spatial patterns of genetic variation may thus be complex, especially where changing
environments have caused changes in selection pressures, dispersal barriers and
species distribution.
Regardless of the cause of genetic differentiation, the existence of spatial structure in
genetic variation on a relatively broad scale allows the delineation of geographic
races, within which individuals are more related to each other than to individuals in
other groups (Endler 1977). Such genetic variation is often multi-dimensional and
continuous in nature, and the exact delineation of races may be difficult if clear
geographical and genetic disjunctions are not present. Nevertheless, racial groups are
of interest to breeders because they standardise the classification of seed sources,
enable links between different seed collections, provide a means of summarising
complex patterns of genetic variation, and may improve the prediction of breeding
values through the use of a genetic groups model (Quaas 1981). An earlier version of
the classification derived in this paper has been shown to improve the accuracy of
breeding value prediction and thus improve the gains from selection by up to 20%
(Dutkowski et al. 1997).
Eucalyptus globulus Labill. ssp. globulus, a native of south-eastern Australia, is likely to exhibit spatial genetic variation. It has a widespread distribution, occurs in a
number of different environments, and is likely to have had a complex history of
environmental change, migration, barriers to dispersal and intergradation with related
subspecies (Jordan et al. 1993; Potts and Jordan 1994a). Although its pollen dispersal mechanisms are undocumented, its relatively heavy seed means that seed dispersal is
likely to be limited (Cremer 1977). On the basis of phenotypic variation in floral
morphology and climatic information, Kirkpatrick (1975) amalgamated E. globulus Labill. and its related species into a single species with subspecies globulus, bicostata,
extensive zones of intergradation. Jordan et al. (1993) extended this work, recognising a number of core and intergrade zones between the subspecies.
Eucalyptus globulus ssp. globulus is one of the most widespread plantation pulpwood species in the world, with over 1,700,000 ha planted, and over 70,000 ha planted in
Australia by 1996 (Tibbits et al. 1997). There are active breeding programs in Australia (Butcher 1990; Jarvis et al. 1995), Chile (Prado and Alvear 1993), Portugal (Borralho and Cotterill 1994), Spain (Vega Alonso et al. 1994) and China (Zang et al. 1995). In many of these programs the subspecies is still in the early stages of
domestication, so the investigation of the patterns of genetic variation in native stands
is still important. Genetic differences have been revealed when seed collected from
native stands has been grown under more or less uniform conditions in field trials.
Most studies of ssp. globulus and its intergrades have been based on trials established from two major seed collections (Orme 1977; Gardiner and Crawford 1987, 1988).
Spatially structured genetic variation has been reported for survival (Almeida 1993;
Prado and Alvear 1993), growth (Volker and Orme 1988; Almeida 1993; Prado and
Alvear 1993; Spencer and Williams 1993; Potts and Jordan 1994b; Vega Alonso et al. 1994; Kube et al. 1995; Zang et al. 1995), taper (Guimaraes et al. 1995), pilodyn penetration (MacDonald et al. 1998), stem form (Zang et al. 1995), fungal resistance (Carnegie et al. 1994; Zang et al. 1995), insect feeding (Farrow et al. 1994), stem borer resistance (Soria and Borralho 1998), frost resistance (Tibbits et al. 1991; Almeida et al. 1995; Zang et al. 1995), drought resistance (Dutkowski 1995; Toro et
al. 1998), juvenile leaf morphology (Potts and Jordan 1994a), persistence of juvenile foliage (Spencer and Williams 1993; Potts and Jordan 1994a), seedling abnormalities
(Potts and Jordan 1994b), and variation in RAPD markers (Nesbitt et al. 1995).
Jordan et al. (1994) derived a racial classification of the subspecies and its intergrades based on the offspring from open-pollinated seed collected from trees throughout the
natural range grown to age 4 years in five trials in Tasmania. Although there was
clearly spatially structured variation, much of the variation was continuous and the
racial groups were not distinct. Discontinuities in the geographic distribution had to
be used to define races. Some localities represented by only a few families also
Chapter 2 – E. globulus race classification
classification based on RAPD variation (Nesbitt et al. 1995) showed poor
geographical clustering of localities, although a major latitudinal cline was detected.
Data from the same field trials used by Jordan et al. (1994) are now available for numerous traits other than growth, such as survival, flowering precocity, wood basic
density, and juvenile leaf morphology, many of which are of economic importance. A
geographical race classification should be most effective when it is based on the
genetic variation of many traits which exhibit spatial variation. Incorporation of
economic traits ensures the relevance of the races to current breeding objectives,
while incorporation of a variety of non-economic traits helps ensure that the racial
groups are robust. This paper summarises the spatial patterns of genetic variation of
these traits and examines their relationships with each other and with environmental
variables. The patterns of variation are used to revise the racial classification of this
taxon.
2.3 Materials and Methods
The families studied were growing in field trials established from a range-wide
collection of open pollinated seed from native stand parent trees of globulus and its intergrade populations made in 1987 and 1988 by the Australian Tree Seed Centre of
the CSIRO (Gardiner and Crawford 1987, 1988). Progeny trials of this material have
been planted in Australia, Chile, Portugal, Spain and China (MacDonald et al. 1995; Zang et al. 1995) and have formed the basis of a number of breeding programs. A varying number of easily accessible, representative trees were collected from areas
within the range of the subspecies. Potts and Jordan (1994b) grouped the collection
areas into 46 localities, which were an arbitrarily defined area of approximately 10 km
diameter. These localities, and three extra localities with few families used in this
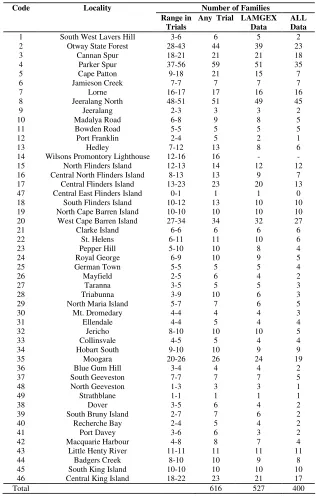
Table 2-1 Localities sampled in the 1987 and 1988 CSIRO collections of
Eucalyptus globulus that are represented in this analysis.
The codes follow Jordan et al. (1994) up to code 46; three extra localities (47-49) have been
included. The number of families in the trials and their representation in the two
classification data sets (LAMGEX and ALL) analysed are shown. Locality 14 was not
included in the classification analysis as it was not sampled for all traits.
Code Locality Number of Families Range in
Trials
Any Trial LAMGEX Data
ALL Data 1 South West Lavers Hill 3-6 6 5 2 2 Otway State Forest 28-43 44 39 23
3 Cannan Spur 18-21 21 21 18
4 Parker Spur 37-56 59 51 35
5 Cape Patton 9-18 21 15 7
6 Jamieson Creek 7-7 7 7 7
7 Lorne 16-17 17 16 16
8 Jeeralang North 48-51 51 49 45
9 Jeeralang 2-3 3 3 2
10 Madalya Road 6-8 9 8 5
11 Bowden Road 5-5 5 5 5
12 Port Franklin 2-4 5 2 1
13 Hedley 7-12 13 8 6
14 Wilsons Promontory Lighthouse 12-16 16 - - 15 North Flinders Island 12-13 14 12 12 16 Central North Flinders Island 8-13 13 9 7 17 Central Flinders Island 13-23 23 20 13 47 Central East Flinders Island 0-1 1 1 0 18 South Flinders Island 10-12 13 10 10 19 North Cape Barren Island 10-10 10 10 10 20 West Cape Barren Island 27-34 34 32 27
21 Clarke Island 6-6 6 6 6
22 St. Helens 6-11 11 10 6
23 Pepper Hill 5-10 10 8 4
24 Royal George 6-9 10 9 5
25 German Town 5-5 5 5 4
26 Mayfield 2-5 6 4 2
27 Taranna 3-5 5 5 3
28 Triabunna 3-9 10 6 3
29 North Maria Island 5-7 7 6 5
30 Mt. Dromedary 4-4 4 4 3
31 Ellendale 4-4 5 4 4
32 Jericho 8-10 10 10 5
33 Collinsvale 4-5 5 4 4
34 Hobart South 9-10 10 9 9
35 Moogara 20-26 26 24 19
36 Blue Gum Hill 3-4 4 4 2
37 South Geeveston 7-7 7 7 5
48 North Geeveston 1-3 3 3 1
49 Strathblane 1-1 1 1 1
38 Dover 3-5 6 4 2
39 South Bruny Island 2-7 7 6 2
40 Recherche Bay 2-4 5 4 2
41 Port Davey 3-6 6 3 2
42 Macquarie Harbour 4-8 8 7 4
43 Little Henty River 11-11 11 11 11
44 Badgers Creek 8-10 10 9 8
45 South King Island 10-10 10 10 10 46 Central King Island 18-22 23 21 17
Chapter 2 – E. globulus race classification 8 9 11 10 13 12 14 7 6 5 4 3 1 2 46 45 15 16 17 47 18 20 19 21 43 44 42 41 40 39 38 37 36 34 33 35 31 32 27 29 28 26 24 23 22
Tasmania
King Is. Furneaux Group Gippsland Otway Ranges Flinders Is.Cape Barren Is.
Clarke Is.
globulusintergrades
core globulus
Lighthouse
pseudoglobulus outlier
Victoria
Bass Strait
South Gippsland Strzelecki
globulusintergrade
core globulus
core globulus
core globulus
Central Western Tasmania
globulusintergrade Port Davey globulusintergrade Northeast Tasmania Eastern Tasmania Southeast Tasmania EX LA MG WR WO
144°E 146°E 148°E 39°S
41°S
43°S
25
3-fruited intergrades 3-fruited intergrades
Jericho
30
48
[image:31.612.106.537.84.568.2]49
Figure 2-1 Location of seed collection localities with respect to the species distribution.
Symbols are () seed collection localities (codes follow Table 2-1); () distribution and subspecies boundaries of Jordan et al. (1993); () race boundaries of Jordan et al. (1994);
The five progeny trials used in this analysis were established by North Forest
Products in the northwest of Tasmania in 1989; Exeter (EX), Latrobe (LA), Massy
Greene (MG), West Ridgley (WR) and Woolnorth (WO). The trials encompassed a
wide range of environments suitable for plantations of the subspecies in north-western
Tasmania, but all fell outside its natural distribution (Figure 2-1). Each trial was
established with row plots of two trees in five complete replicates with between 21
and 28 incomplete blocks in a resolvable incomplete block design. The number of
families at any one trial varied between 450 and 596 (see Jordan et al. (1994) for further details).
Direct and indirect measurements were made of growth, survival, bark thickness,
flowering precocity, wood basic density, leaf damage by sawfly (Perga affinus) larvae, and juvenile leaf morphology and persistence (Table 2-2). Growth was
measured as height and diameter. Bark thickness was calculated as a proportion of
diameter. Pilodyn penetration was used as an index of wood basic density (Greaves et
al. 1996). Not all traits were measured at all sites, nor were all trees measured for
each variable. Only the latest, or most complete, measurement of a variable was used,
except for bark thickness, where an earlier, more complete, measurement at Massy
Greene was also included. The measurements of the 12 traits on between one and five
sites yielded 35 variables.
Data from runts, multi-stemmed or damaged trees, and measurements deemed to be
outliers were rejected. The data for some variables were subject to a transformation
(see Table 2-2) to ensure normality and homogeneity of variance. Family least square
means were calculated with the univariate linear model:
[2-1] Y = µ + Rep + Inblk + Fam + ε
where Y is the observation of the variable for the tree, µµµµ is the mean of the variable,
Chapter 2 – E. globulus race classification
Table 2-2 Description of traits measured.
The traits measured, the code used in subsequent tables, trait description, the trials in which
the data was collected, the age at which it was collected, the tree sampling strategy, and the
transformation used in the analysis.
Trait Code Trials Description Age
(years)
Sample Trans-formation Height HT All Height to tallest growing tip 4.0 All trees Square Diameter DBH All Diameter at Breast Height
(1.3m).
4.0 All trees
Pilodyn penetration
PILO All Average of 2 shots in a small bark window on the western side of the tree at 1.3m
5.5 First tree in each plot from 2 replicates Bark thickness
BRK4 MG Double bark thickness, average of 4 measurements around the stem at 1.3m using a bark thickness gauge, as a proportion of DBH
4.0 1 tree per plot in 4 replicates
Ln
Bark thickness
BRK5 All Double bark thickness from 1 measurement in the window used for pilodyn measurement, as a proportion of DBH
5.5 First tree in each plot from 2
replicates Ln
Survival SURV All Survival as a binary trait 4.0 All trees Flowering
precocity
PREC EX
MG WR
Flowering precocity: presence (1) or absence (0) of flower buds or capsules at a young age
4.0 All trees
Leaf length LL MG Leaf length of the average juvenile leaf sampled at 1.3m
1.5 All trees Ln
Leaf width LW MG Leaf width, as a proportion of LL
1.5 All trees Ln
Length to the widest point
LWP MG Length to widest point on leaf, as a proportion of LL
1.5 All trees Square root
Basal lobing
BASE MG Length of basal lobe on leaf, as a proportion of LL
1.5 All trees Square root Height to
phase change
HTPC MG Height on main stem to first petiolate leaf, as a proportion of tree height
1.5 All trees from 4 replicates Square root Sawfly damage
SAW MG Defoliation by Sawfly larvae (Perga affinus subsp. insularis,
PERGIDAE) scored on a three
point scale
The family least square means were calculated using VCE version 3.2 (Groeneveld
1996) and PEST version 3.0 (Groeneveld 1990), SAS (SAS Institute 1990), or
ASReml (Gilmour et al. 1997b). The incomplete block term was not included in the model for precocity as insufficient trees were sampled (or flowered) in each block to
reliably estimate this effect.
The family least square means were used in one-way ANOVAs to test for differences
between locality means. The geographic pattern of variation and the correlations of
the traits with each other, and with climatic variables, were examined using locality
means. The tendency of the locality means to display a spatial structure was assessed
by a measure of spatial autocorrelation. In general, the approach used to classify
localities into races followed Jordan et al. (1994) involving multivariate
discrimination and clustering techniques. Wilsons Promontory Lighthouse (14;
hereafter termed Lighthouse) was generally not included in the analyses because of
its extremely slow growth.
In order to summarise the geographic variation, locality means (including Lighthouse
(14) for comparison) were plotted against their geographic position for each trait. To
summarise variation in traits measured by more than one variable, synthetic traits
were created from locality means for groups of similar variables: growth (using height
and diameter), bark thickness (using BRK4 and BRK5), pilodyn penetration, survival
and flowering. These synthetic traits were the first axis from principal components
analyses based on the correlations between the means of the 33 localities with at least
three families for each variable used. Scores on the first axis were then calculated for
these 33 localities and an extra 11 localities with fewer families. The principal
components analysis was undertaken using Genstat 5.32 (Payne et al. 1988).
Pairwise Pearson’s correlations of the localities means were calculated between the
traits, and between the traits and selected climatic variables. The climatic variables
were selected as they summarised the mean and variation in annual rainfall and
temperature and as they showed little correlation with each other. The climatic
variables used were mean annual temperature (tann), the difference between the
coldest monthly mean minimum and the warmest monthly mean maximum (tspan),
Chapter 2 – E. globulus race classification
rainfall (rcvar) (see Jordan et al. (1993) for further details). Correlations significantly different from zero were detected using both a single comparison and a multiple
comparison test (using Bonferroni’s inequality) (Snedecor and Cochrane 1980). Only
the 44 localities with trait means based on more than three families were used.
Discriminant function analysis (DFA) (Sokal and Rohlf 1981) was used to
discriminate between localities. DFA finds linear combinations of family means that
maximally differentiate localities in multivariate space. Locality discriminant scores
for all localities were calculated from the discriminant coefficients based on a subset
of the data with only those localities with more than three families for all the
variables. The discriminant scores were graphed for the first three discriminant
functions and mapped in their geographic position for the first four functions.
For the DFA, only families measured for all variables could be used. The main data
set used (denoted ALL) comprised 35 variables measured on the five sites for 372
families from 33 localities. In order to sample a greater number of families and
localities a second data set was formed with just those families common to the sites
with the greatest number of families: LA, MG, and EX. This data set (denoted
LAMGEX) comprised 24 variables measured on the three sites for 513 families from
42 localities.
To group the localities into races, the locality discriminant scores were used to
hierarchically classify the localities. The primary clustering was done using average
linkage clustering (Sneath and Sokal 1973) of all discriminant functions for only those
localities with more than three families; however, the clustering was also carried out
with different sets of localities (all localities, and only localities with more than three
families), using different clustering techniques (average linkage, single-linkage and
Ward’s method), and with different numbers of discriminant functions (all, or only the
significant discriminant functions). The grouping of localities into races was done
primarily on the clustering, but was supplemented by the maps of the locality
discriminant scores and other information about specific localities. The discriminant
function analysis and clustering were undertaken using SAS (SAS Institute 1990).
The tendency of the locality trait means and discriminant scores to have similar values
was determined in order to verify that there was a spatial structure to the variation. A
variogram describes the spatial autocorrelation in a data set by calculating the
variance of differences between pairs of values at different distances apart (Isaaks and
Srivastava 1989). If there is a tendency for spatial autocorrelation, then the variogram
will increase with distance. The significance of the increase with distance was
determined by an F-test of an isotropic bounded linear model fitted to the observed
variogram in 10 km distance classes using Genstat 5.32 (Payne et al. 1988).
2.4 Results
2.4.1 Spatial Patterns
There were significant locality differences for all variables, except for survival
(SURV) at EX and LA (Table 2-3). There was significant spatial autocorrelation of
locality means in all groups of variables, but not for all variables within a group
(Table 2-3). Pilodyn penetration (PILO) at WR showed the highest spatial
autocorrelation, while diameter (DBH) at MG showed the lowest. The PILO and bark thickness (BRK) variables showed the strongest spatial autocorrelation, while survival
(SURV) showed the lowest. Leaf length (LL) and leaf width (LW) were strongly
autocorrelated, and length to widest point (LWP) and basal lobing (BASE) were not.
The first principal component axis explained a large proportion of the variation of the
locality means for most groups of variables (Table 2-4). The first principal
components for flowering precocity and bark thickness each explained over 80% of
the variation, indicating that these traits were very stable across trial sites. Survival
was the least stable trait across sites, with less than half of the variation explained by
the first principal component axis. Spatial autocorrelation of the synthetic traits was
again strongest for pilodyn and bark thickness, and was not significant for growth and
Chapter 2 – E. globulus race classification
Table 2-3 Locality ANOVAs and locality mean spatial clustering.
For locality ANOVA, the F ratio and probability of no difference between localities from
univariate ANOVA of family means, and for spatial clustering, the F ratio and probability
that a bounded linear model explains none of the observed variogram.
Trait Site ANOVA Spatial
Clustering
F-ratio F-Prob. F-ratio F -Prob.
HT EX 3.05 < 0.001 0.72 0.491
LA 3.57 < 0.001 3.22 0.047
MG 5.91 < 0.001 1.26 0.291
WO 6.67 < 0.001 3.07 0.054
WR 4.28 < 0.001 1.68 0.195
DBH EX 2.75 < 0.001 2.20 0.120
LA 2.93 < 0.001 3.12 0.052
MG 4.50 < 0.001 0.01 0.990
WO 6.08 < 0.001 3.63 0.033
WR 3.04 < 0.001 1.18 0.315
BRK4 MG 3.73 < 0.001 3.34 0.042
BRK5 EX 6.00 < 0.001 5.30 0.008
LA 8.17 < 0.001 3.94 0.025
MG 5.26 < 0.001 2.95 0.061
WO 3.62 < 0.001 4.03 0.023
WR 3.68 < 0.001 3.54 0.036
PILO EX 4.89 < 0.001 4.30 0.018
LA 4.91 < 0.001 4.77 0.012
MG 4.71 < 0.001 2.11 0.131
WO 3.41 < 0.001 3.29 0.044
WR 3.97 < 0.001 7.57 0.001
SURV EX 1.00 0.484 0.25 0.779
LA 1.16 0.221 2.97 0.059
MG 2.95 < 0.001 1.09 0.343
WO 3.50 < 0.001 1.82 0.171
WR 5.40 < 0.001 2.40 0.099
PREC LA 5.59 < 0.001 3.31 0.043
MG 7.05 < 0.001 2.76 0.072
WR 3.53 < 0.001 2.92 0.062
LL MG 8.43 < 0.001 4.56 0.015
LW MG 3.52 < 0.001 4.95 0.010
LWP MG 2.33 < 0.001 1.28 0.286
BASE MG 2.07 < 0.001 0.40 0.672
HTPC MG 6.20 < 0.001 2.58 0.084
Table 2-4 Principal components analysis of locality means and their spatial clustering.
The variables used to create synthetic traits and the proportion of variation explained by the
first principal component (PCA-1), and for the spatial clustering, the F ratio and probability
that a bounded linear model explains none of the observed variogram.
Synthetic Trait
Variables Used
PCA-1 Spatial Clustering
(%) F ratio F Prob.
Growth HT, DBH 54.9 1.40 0.254
Bark BRK4,BRK5 82.0 6.95 0.002
Pilodyn PILO 71.7 7.70 0.001
Survival SURV 45.4 0.94 0.397
Precocity PREC 88.4 3.37 0.041
Table 2-5 Correlations of trait locality means.
Correlations of locality means between the synthetic traits and the variables, leaf morphology
(LL, LW, LWP & BASE), height to phase change (HTPC), and sawfly damage (SAW).
Individual significant correlations are marked as + p< 0.05, ++ p < 0.01, +++ p < 0.001, or
significant correlations detected using Bonferroni’s inequality within the whole suite of
correlations are marked as * p < 0.05, ** p < 0.01, *** p < 0.001.
Synthetic Traits Variables
Growth Bark Pilo-dyn
Survi -val
Preco -city
LL LW LWP BASE HTPC
Bark -0.08
Pilodyn 0.08 -0.42++
Survival 0.56** -0.11 0.12
Precocity 0.15 0.16 -0.13 0.41++
LL -0.04 0.14 0.12 -0.32+ -0.50*
LW 0.02 -0.26 -0.17 0.11 0.20 -0.57**
LWP -0.47+++ -0.10 -0.12 0.35+ -0.21 -0.19 0.44++
BASE 0.39++ -0.33+ 0.19 0.51* 0.30+ -0.33+ 0.38++ -0.42++
HTPC 0.26 0.09 -0.02 -0.11 -0.33+ 0.65*** -0.19 -0.25 0.01
Figure 2-2 Geographic variation of traits. Locality means of synthetic, leaf morphology and other traits.
(a) Growth (b) Bark Thickness (c) Pilodyn Penetration (d) Flowering Precocity (e) Leaf Length
(f) Leaf Width (g) Length to Widest Point (h) Basal Lobing (i) Height to Phase Change (j) Sawfly Damage
4 3 ° S 4 1 ° S 3 9 ° S 4 3 ° S 4 1 ° S 3 9 ° S
The geographic patterns of variation of the synthetic traits (except survival), juvenile
leaf morphology, sawfly damage and height to phase change are summarised in
Figure 2-2. For growth (Figure 2-2a), while the spatial autocorrelation was not
significant, the Otway and Strzelecki Ranges, and southern Tasmania were regions of
above average growth. Lighthouse (14) and Port Davey (41) were slow growing, but
localities from eastern Tasmania and south Gippsland also showed below average
growth, while the Bass Strait islands were variable. Bark thickness exhibited clear
regional differences (Figure 2-2b). Gippsland, the eastern Otway Ranges, and
north-eastern Tasmania had thick bark. There was a steep cline in bark thickness in the
Otway Ranges from west to east, and from north to south in the more or less
continuous distribution along the east coast of Tasmania. The Furneaux Group and
western Otways were intermediate, while King Island had thin bark. The lowest
pilodyn penetration was found in Gippsland, with below-average penetration in the
eastern Otway Ranges, the Furneaux Group, and some parts of eastern Tasmania
(Figure 2-2c). The highest penetration was found at King Island, with high
penetration also in the western Otway Ranges, the central west coast of Tasmania, and
isolated localities in eastern Tasmania. The Furneaux Group, especially the southern
islands, and Lighthouse (14), were by far the most precocious flowering regions
(Figure 2-2d). Port Davey and the Otway Ranges were above average, but there was
little early flowering elsewhere. Long juvenile leaves were found in eastern Tasmania
(Figure 2-2e), short leaves in western Tasmania and the Furneaux Group, with
intermediate leaf lengths elsewhere. The widest leaves were from western Tasmania
and Gippsland (except Lighthouse (14)) (Figure 2-2f), the narrowest leaves from
eastern Tasmania and Lighthouse (14), and localities elsewhere were intermediate.
The length to the widest point was high in Gippsland and isolated localities in
Tasmania (Figure 2-2g). Basal lobes were notably short at Lighthouse (14) (Figure
2-2h), but no clear pattern was evident otherwise. The least juvenile foliage by far
was retained by Lighthouse (14) (Figure 2-2i), while the west coast of Tasmania,
south-eastern Tasmania, and the Furneaux Group were below average. More juvenile
foliage than average was retained by localities in the Strzelecki Ranges, and the
northern and southern parts of the Tasmanian east coast distribution. Sawfly damage
was high for the eastern Otways (Figure 2-2j), the Furneaux Group and the central
south-Chapter 2 – E. globulus race classification
eastern Tasmanian, and intermediate elsewhere. Survival (not shown in Figure 2-2
because of its low percentage of variation explained by the first principal component
axis and its lack of spatial autocorrelation) showed no strong patterns, with the
localities with the maximum and minimum survival occurring in close proximity in
Gippsland.
2.4.2 Correlations
The locality means (Table 2-5) show the strongest correlations (significant at 5% by
the Bonferroni test) between leaf length (LL) and height to phase change (HTPC)
(0.65), leaf length (LL) and leaf width (LW) (-0.57), growth and survival (0.56), bark
thickness and sawfly damage (SAW) (0.54), and survival and basal lobing (BASE)
(0.51). For these major correlations there was little evidence that geographic groups
of high leverage inflated the correlation estimates. A number of correlations between
traits were found that were only significant (P < 0.05) by a univariate test.
Table 2-6 Correlation between locality trait means and climatic variables.
Correlations of locality means of synthetic traits and variables, leaf morphology (LL, LW,
LWP & BASE), height to phase change (HTPC), and sawfly attack (SAW), with climatic
variables, mean annual temperature (tann), the difference between the coldest months mean
minimum temperature and the warmest months mean maximum temperature (tspan), the
mean annual rainfall (rann), and the coefficient of variation of mean monthly rainfall (rcvar).
Individual significant correlations are marked as + p < 0.05, ++ p < 0.01, +++ p < 0.001, or
significant correlations detected using Bonferroni’s inequality within the whole suite of
correlations are marked as * p < 0.05, ** p < 0.01, *** p < 0.001.
tann tspan rann rcvar
Growth 0.23 0.28 -0.15 0.35+
Bark 0.28 0.56** -0.32+ -0.23
Pilodyn -0.03 -0.49* 0.12 0.45++ Survival 0.00 0.03 -0.03 0.32+ Precocity 0.61*** 0.08 -0.07 0.29
LL -0.42++ 0.07 -0.30+ -0.27
LW 0.21 -0.10 0.52** 0.19
LWP -0.12 0.01 0.29 -0.16
BASE 0.23 -0.24 0.16 0.39++
HTPC -0.23 0.14 -0.13 -0.19