Open Access
Methodology
Real-time quantitative PCR with SYBR Green I detection for
estimating copy numbers of nine drug resistance candidate genes in
Plasmodium falciparum
Isabel D Ferreira
1, Virgílio E do Rosário
1and Pedro VL Cravo*
2Address: 1Centro de Malária e Outras Doenças Tropicais/IHMT/UNL, Rua da Junqueira, 96, 1349-008, Lisbon, Portugal and 2Centro de Malária e Outras Doenças Tropicais/UEI Biologia Molecular/IHMT/UNL, Rua da Junqueira, 96, 1349-008, Lisbon, Portugal
Email: Isabel D Ferreira - [email protected]; Virgílio E do Rosário - [email protected]; Pedro VL Cravo* - [email protected] * Corresponding author
Abstract
Background: Evaluating copy numbers of given genes in Plasmodium falciparum parasites is of major importance for laboratory-based studies or epidemiological surveys. For instance, pfmdr1
gene amplification has been associated with resistance to quinine derivatives and several genes involved in anti-oxidant defence may play an important role in resistance to antimalarial drugs, although their potential involvement has been overlooked.
Methods: The ∆∆Ct method of relative quantification using real-time quantitative PCR with SYBR Green I detection was adapted and optimized to estimate copy numbers of three genes previously indicated as putative candidates of resistance to quinolines and artemisinin derivatives: pfmdr1,
pfatp6 (SERCA) and pftctp, and in six further genes involved in oxidative stress responses.
Results: Using carefully designed specific RT-qPCR oligonucleotides, the methods were optimized for each gene and validated by the accurate measure of previously known number of copies of the
pfmdr1 gene in the laboratory reference strains P. falciparum 3D7 and Dd2. Subsequently, Standard Operating Procedures (SOPs) were developed to the remaining genes under study and successfully applied to DNA obtained from dried filter blood spots of field isolates of P. falciparum collected in São Tomé & Principe, West Africa.
Conclusion: The SOPs reported here may be used as a high throughput tool to investigate the role of these drug resistance gene candidates in laboratory studies or large scale epidemiological surveys.
Background
In the absence of a viable vaccine, current methods used for the control of malaria invariably rely on prevention through minimizing exposure to mosquitoes, and drug treatment of clinical disease. In areas of high transmis-sion, where large numbers of malaria cases are presently inevitable, there is a reliance on anti-malarial drugs to
treat the disease. However, parasite resistance, especially of Plasmodium falciparum, has been recorded to every anti-malarial drug currently in use [1].
It has been shown that differential copy numbers and/or differential transcription of putative drug resistance gene candidates may influence responses to drugs in malaria
Published: 18 January 2006
Malaria Journal 2006, 5:1 doi:10.1186/1475-2875-5-1
Received: 19 October 2005 Accepted: 18 January 2006
This article is available from: http://www.malariajournal.com/content/5/1/1
© 2006 Ferreira et al; licensee BioMed Central Ltd.
parasites. For instance, both in laboratory-adapted strains and clinical samples of P. falciparum increased copy num-bers of the pfmdr1 gene have been implicated in resistance to quinine derivatives [2,3]. Additionally, changes in copy numbers of other genes, such as those coding for antioxi-dant defense enzymes, may be important in antimalarial drug resistance although these have not been fully explored as putative candidates [2,4]. In this context, is has been shown that higher levels of glutathione (GSH) in some parasites may help protect them from the toxic effects of chloroquine and thus contribute to resistance. Both in P. falciparum and in the rodent malaria parasite
Plasmodium berghei, CQ-resistant lines contained higher levels of GSH than their sensitive counterparts [5], and this was related to increased expression of glutathione-s-transferase (gst) [6,7]. In addition, other anti-oxidant stress genes such as thioredoxins, have been widely shown to confer resistance to artesunate in tumor cells [8], but these have scarcely investigated in the context of drug-resistant malaria.
More recently, Uhlemann and colleagues provided strong evidence to indicate that resistance to artemisinins may depend on single nucleotide polymorphisms in the drug's putative chemotherapeutic target, the SERCA-type ATPase protein of P. falciparum (PfATP6) [9], although epidemio-logical evaluation of gene copy numbers in natural para-site populations has not been carried out.
Previous reports have described protocols for estimating copy numbers of the pfmdr1, using real-time quantitative PCR (RT-qPCR) [10,11]. Although the methods were shown to be highly sensitive, the fluorescent PCR signal was detected with TaqMan or hybridization probes spe-cific for the mdr1 gene exclusively.
The objective of the present work was to develop proto-cols to estimate candidate gene copy numbers in genomic DNA extracted from dried blood spots of laboratory-adapted strains and field-collected isolates of P.
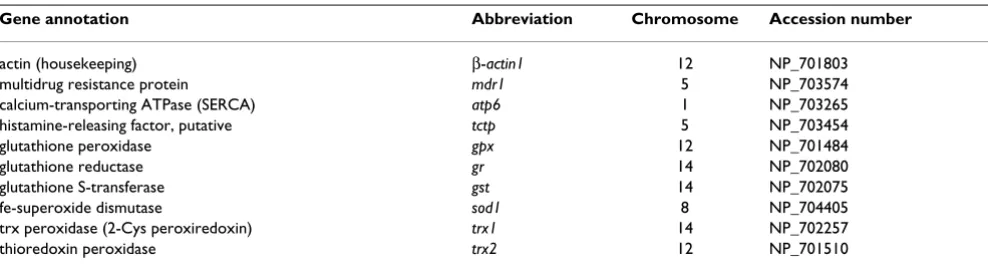
falci-parum, using RT-qPCR with SYBR green I detection. The genes included in the study were chosen on the basis of either a previous involvement in antimalarial drug resist-ance or their involvement in parasite responses to antioxi-dant stress (Table 1). SYBR Green I fluorescent dye has the important property of being a sequence-independent, universal RT-qPCR detection system, due to its ability to bind to all dsDNA molecules. Therefore, when working with a large panel of genes, using SYBR green instead of probes is another way to meet the demand of high throughput and to work more cost effectively.
Although SYBR Green I detection is prone to lack of spe-cificity, its comparative low price and ability to detect any given PCR product in a sequence-independent manner outweigh its potential disadvantages provided optimal conditions are assured.
Methods
DNA extraction from laboratory clones and field isolates of P. falciparum
A set of eight DNA samples of P. falciparum from the Dem-ocratic Republic of Sao Tomé & Principe (DRSTP) were used in this study. Blood samples had been collected pre-viously by Passive Case Detection (PCD) as part of an on-going collaboration between Portugal and the DRSTP dur-ing the month of February 2004, from suspected malaria carriers attending the Centro Policlínico de Saúde de Água Grande, in the city of São Tomé.
[image:2.612.59.553.99.234.2]No age restrictions were applied. After confirmation of P. falciparum infection by microscopical observation of thin and thick Giemsa-stained blood films, 1 ml of venous blood was collected into Monovettes containing EDTA, after individual informed consent and local ethical approval. A sub-sample of this was spotted onto What-man n°4 filter paper and then parasite genomic DNA was obtained from all samples by boiling in Chelex-100 [12] followed by ethanol precipitation. A similar protocol was used to extract genomic DNA from the references strains Table 1: Genes analysed in this study
Gene annotation Abbreviation Chromosome Accession number
actin (housekeeping) β-actin1 12 NP_701803
multidrug resistance protein mdr1 5 NP_703574
calcium-transporting ATPase (SERCA) atp6 1 NP_703265
histamine-releasing factor, putative tctp 5 NP_703454
glutathione peroxidase gpx 12 NP_701484
glutathione reductase gr 14 NP_702080
glutathione S-transferase gst 14 NP_702075
fe-superoxide dismutase sod1 8 NP_704405
trx peroxidase (2-Cys peroxiredoxin) trx1 14 NP_702257
P. falciparum 3D7 and Dd2, which were kept in deep fro-zen stabilates and cultured in vitro at the time of these experiments.
Oligonucleotide primer design
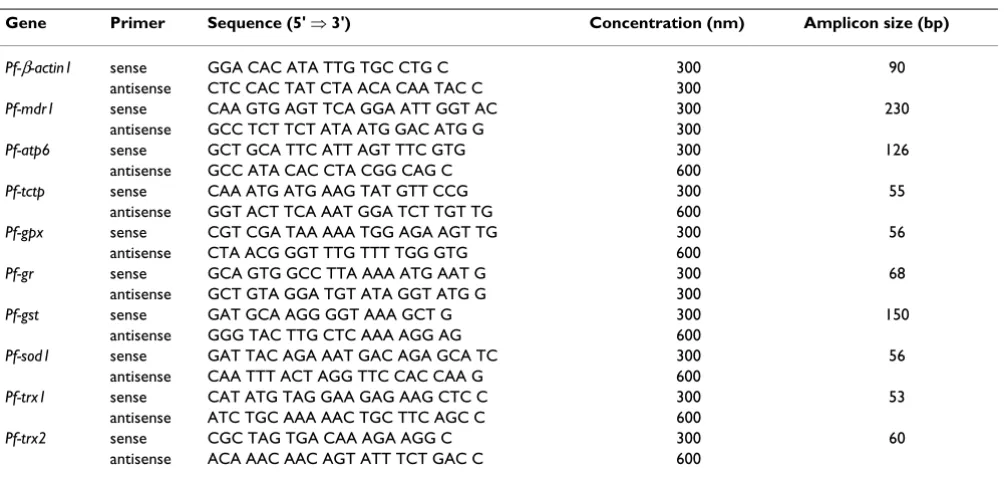
Using data deposited in P. falciparum GeneDB [13], P. fal-ciparum 3D7 individual cDNA gene sequences were retrieved and used as template for designing all real-time PCR oligos (Table 2).
Real-time PCR oligonucleotide primers were manually designed for each of the genes to assure maximal effi-ciency and sensitivity, according to the following parame-ters: avoidance of the formation of self and hetero-dimers, hairpins and self-complementarity, primer length and melting temperature. These properties were verified using two different internet-based interfaces: Primer-3 [14] and Oligonucleotide Properties Calculator [15]. When possi-ble, "GC clamps" were placed at the 3'-end of each primer to minimize breathing between primer and template DNA, which can promote mispriming and decrease effi-ciency. Primers were designed such that amplicon sizes ranged between 50 and 250 bps. Melting curve analysis was always performed at the end of each PCR assay to con-trol for specificity; specific reactions should result in a sin-gle melting peak corresponding to the PCR product being amplified. In contrast, multiple melting peaks imply that that the reaction is either unspecific in that it originates more than one amplicon or that primer dimers are being formed. Either condition alters the validity of PCR kinetic parameters and, thus, any primer pairs producing more than one melting peak were discarded.
Real-time PCR assays
Real-time PCR was performed in the GenAmp 5700 SDS®
(Applied Biosystems™), using the default thermocycler program for all genes: 10 minutes of pre-incubation at 95°C followed by 40 cycles for 15 seconds at 95°C and one minute at 60°C.
Individual real-time PCR reactions were carried out in 20
µl volumes in a 96-well plate (Applied Biosystems™) con-taining 1× buffer (10×), 3.5 mM MgCl2, 200 µM dNTPs, different concentrations of sense and antisense primers (Table 2), 0.025 U/µl enzyme and 1:66000 SYBR GreenI
®. All reactions were made using qPCR™ Core Kit for SYBR
Green I® (EUROGENTEC™).
At the end of each reaction, Cycle threshold (Ct) was man-ually setup at the level that reflected the best kinetic PCR parameters, and melting curves were acquired and ana-lysed.
Data analysis using the 2-∆∆Ct method and its validation
[image:3.612.56.558.97.336.2]The two most commonly used methods to analyse data from real-time, quantitative PCR experiments are absolute quantification and relative quantification. Absolute quan-tification is usually applied to determine the input copy number, usually by relating the PCR signal to a standard curve. Relative quantification is more commonly used to measure gene expression by relating the PCR signal of the target transcript in a treatment group to that of a sample such as an untreated control. Absolute quantification is usually more accurate but requires elaboration of stand-ard curves for each gene under study that need be ran at Table 2: Real-time quantitative PCR primers
Gene Primer Sequence (5' ⇒ 3') Concentration (nm) Amplicon size (bp)
Pf-β-actin1 sense GGA CAC ATA TTG TGC CTG C 300 90
antisense CTC CAC TAT CTA ACA CAA TAC C 300
Pf-mdr1 sense CAA GTG AGT TCA GGA ATT GGT AC 300 230
antisense GCC TCT TCT ATA ATG GAC ATG G 300
Pf-atp6 sense GCT GCA TTC ATT AGT TTC GTG 300 126
antisense GCC ATA CAC CTA CGG CAG C 600
Pf-tctp sense CAA ATG ATG AAG TAT GTT CCG 300 55
antisense GGT ACT TCA AAT GGA TCT TGT TG 600
Pf-gpx sense CGT CGA TAA AAA TGG AGA AGT TG 300 56
antisense CTA ACG GGT TTG TTT TGG GTG 600
Pf-gr sense GCA GTG GCC TTA AAA ATG AAT G 300 68
antisense GCT GTA GGA TGT ATA GGT ATG G 300
Pf-gst sense GAT GCA AGG GGT AAA GCT G 300 150
antisense GGG TAC TTG CTC AAA AGG AG 600
Pf-sod1 sense GAT TAC AGA AAT GAC AGA GCA TC 300 56
antisense CAA TTT ACT AGG TTC CAC CAA G 600
Pf-trx1 sense CAT ATG TAG GAA GAG AAG CTC C 300 53
antisense ATC TGC AAA AAC TGC TTC AGC C 600
Pf-trx2 sense CGC TAG TGA CAA AGA AGG C 300 60
each experiment, thus increasing experimental costs and significantly decreasing throughput.
In this work, the 2-∆∆Ct method of relative quantification
(described in detail in [16]) was adapted to estimate copy numbers in P. falciparum genes. This method allows to estimate gene copy numbers in unknown samples, requir-ing two main pre-requisites. The first is the existence of at least one calibrator consisting of template DNA with known copies of each of the studied genes. The second is the need to have a house-keeping gene of constant copy number in all samples, which permits normalization of the quantitative data. In this work, genomic DNA extracted from P. falciparum 3D7, known to harbour a sin-gle copy of each gene studied, was used as calibrator, while Pf-β-actin1 served as the house-keeping gene in all experiments.
The ∆∆Ct calculation for the relative quantification of tar-get was used as follows ∆∆Ct = (Ct, target gene – Ct, Pf-β
-actin1)χ – (Ct, target gene – Ct, Pf-β-actin1)y, where χ = unknown sample and y = P. falciparum 3D7. After valida-tion of the method, results for each sample were expressed in N-fold changes in χ target gene copies, normalized to
Pf-β-actin-1 relative to the copy number of the target gene in P. falciparum 3D7, according to the following equation: amount of target = 2-∆∆Ct [16]. A minimum of two
experi-ments was carried out for each gene and sample. At each experiment, each individual sample was run in triplicate wells and the Ct of each well was recorded at the end of the reaction. The average and standard deviation (SD) of the three Cts was calculated and the average value was accepted if the SD was lower than 0.38 [17]. Results for each sample were expressed as the N-fold copy number of a given gene relative to P. falciparum 3D7, by calculating the geometric mean between the two experiments. Assays were repeated if amplification curves did not reflect expo-nential kinetic parameters or if the N-fold copy number of a given gene was lower than 0.7 or higher than 1.3. In cases where N-fold was comprehended between those val-ues (0.7 <N-fold< 1.3), it was accepted that the test sample harboured a single copy of the target gene, i.e., N-fold = 1.
Determination of real-time PCR efficiencies
For the ∆∆Ct calculation to be valid, two important parameters must be considered beforehand. First, the effi-ciency of a given PCR amplification must be close to 100%, and second, the relative efficiency must be
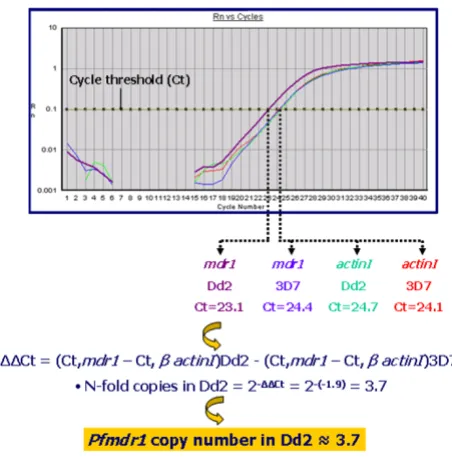
[image:4.612.321.547.87.318.2]opti-Typical results of estimation of pfmdr1 copy number in P. fal-ciparum Dd2 relative to 3D7
Figure 2
Typical results of estimation of pfmdr1 copy number in P. fal-ciparum Dd2 relative to 3D7.
Calculation of relative efficiency of the P. falciparum glutath-ione reductase gene (Pfgr)
Figure 1
Calculation of relative efficiency of the P. falciparum
mal, that is, the amplification efficiencies of the target and reference genes must be approximately equal [16]. In order to determine PCR efficiencies for each gene, P. falci-parum 3D7 genomic DNA was diluted in serial 10-fold ranges and the Ct value at each dilution was measured. A curve was then constructed for each gene from which effi-ciency was determined. Real-time PCR efficiencies (E) were calculated from the given slopes, according to the equation: E = 10(-1/slope) - 1 × 100 [10], where E = 100
cor-responds to 100% efficiency [12]. PCR reactions where the amplicon doubles at every cycle have an optimal effi-ciency of 100% compared to reactions where no amplifi-cation occurs and efficiency is 0%.
To measure relative efficiency, amplifications were per-formed on the same diluted samples, using primers for the reference (Pf-β-actin1) and the target genes. The aver-age Ct was calculated for both reference and target genes and the ∆Ct (Ct, target gene – Ct, Pf-β-actin1) was deter-mined. Plots of the log DNA dilution versus ∆Ct were made. If the absolute value of the slope was close to zero (m < 0.1), the efficiencies of the target and reference genes were similar, and thus the ∆∆Ct calculation could be applied.
Results and discussion
Reaction efficiencies and validation of the assay
Predicted coding sequences obtained for each gene were used to design internal oligonucleotide primers for appli-cation in real-time PCR (Figure 2 and Table 3) as described in Materials and Methods section. Using these primers, real-time PCRs were first optimised for each gene by varying both primer and PCR reagent concentrations,
in order to obtain optimal efficiencies (data not shown).
After a number of rounds of optimisation for each gene individual PCR efficiencies (E) neared 100% in all cases (data not shown). This was also the case for the relative efficiencies between each target gene and Pf-β-actin1. Therefore, there was no need for efficiency correction. Fig-ure 1 depicts an example assay for the calculation of rela-tive PCR efficiency.
To further test the validity of the assays, the copy number of the Pfmdr1 gene was compared between the laboratory clones P. falciparum 3D7 and P. falciparum Dd2. The clone 3D7 harbours one copy of the gene while the multi-drug-resistant resistant line, Dd2, a derivative of W2mef, contains 4 copies. [3,18]. After ensuring optimal condi-tions for the pfmdr1 assay, the N-fold copy number of Dd2 in comparison to 3D7 was evaluated in twenty inde-pendent experiments, as depicted in an example in Figure 2. We note that this system was not directly compared to that reported in references 10 and 11 and in addition, that it would have been more informative to further validate the assay with other Pfmdr1 multicopy strains. Neverthe-less, the present observations indicated that the assay was robust enough to ensure validation (Table 3).
Testing the methods on genomic DNA of natural parasite populations
After optimization of protocols for all different genes the assays were deployed on genomic DNA extracted from confirmed P. falciparum infections obtained from eight isolates of the Democratic Republic of São Tomé and Princípe. Parasite densities were determined in Giemsa-stained blood smears and recorded as the number of par-asites/µl of blood, assuming an average leukocyte count of 8,000/µl (all smears were examined against 500 leuco-cytes prior to be declared negative). Parasite densities in these isolates ranged from 2,500 to 500,000 parasites/µl. For measuring the copy number of each gene in each sam-ple, two microlitres of undiluted genomic DNA were used as template for RT-qPCR regardless of parasitaemia. Although it was observed that lower parasite densities caused small shifts of amplification curves to the right (reflecting higher Ct values), that did not influence the
outcome of relative kinetic parameters, since data was Table 4: Estimated gene copy numbers in eight P. falciparum field-isolates from the DRSTP
Parasite Copy number relative to P. falciparum 3D7
Pfmdr1 Pfatp6 pftctp pfgpx pfgr pfgst Pfsod1 Pftrx1 Pftrx2
Dd2 3.7 1 1 1 1 1 1 1 1
S. Tomé strains
1 1 1 1 1 1 1 1 1
[image:5.612.54.554.604.687.2]Legend: Eight strains from the islands of São Tomé and Princípe were tested (coded ST060, ST073, ST045, ST013, ST065, ST058 and ST035). For simplification, results are expressed in a single row, since all parasites harboured one copy of the studied genes.
Table 3: Estimation of pfmdr1 copy number in P. falciparum Dd2 relative to 3D7, resulting from the analysis of 20 independent experiments
Previously reported Observed in present work
Mean Min. Max. SD
normalized against the β-actin1 gene (data not shown). These experiments showed, however, that there was no amplification in any of the genes among all isolates ana-lysed (Table 4).
Conclusion
Protocols were developed to estimate copy numbers of nine putative drug resistance candidate genes in P. falci-parum. These were initially validated by accurate measure of previously known number of copies of the pfmdr1 gene in the drug-sensitive strain P. falciparum 3D7 and the multi-drug resistant Dd2. Subsequently, protocols were developed for 8 other genes, which were successfully applied to DNA obtained from field isolates of P. falci-parum collected in the DRSTP. In these particular case, however, all isolates harboured a single copy of the genes studied (Table 4).
The methodology was shown to be sensitive and specific allowing copy number estimations using template DNA extracted with chelex resin from filter paper blood spots, independent of sample parasitaemia. Since all Standard Operating Procedure were designed to function under similar PCR temperatures and reagent concentrations, multiple genes may be analysed in a 96-well optical plate, significantly increasing throughput. The method by-passes the need of gene-specific probes since it relies on SYBR Green I detection and can, thus, be adapted to any given gene provided optimal experimental conditions are assured. As long as primers are properly constructed, most genes are easily and reliably detected with the less cum-bersome and less expensive SYBR green I detection method.
Since the methodology relies on relative quantification, it by-passes the need to measure DNA concentration in any given sample. Although a quantification of target genes in genomic DNA is reported, these methods should be equally useful to measure gene expression using cDNA as template, since all primers are located in exons, although it is advisable that PCR efficiencies are calculated and opti-mized if required, prior to such experiments.
For all reasons cited above, these protocols may be a highly useful tool for high throughput large scale epide-miological assays or laboratory studies.
Authors' contributions
IDF carried out most of the experimental procedures and contributed for the elaboration of the manuscript. VEdR and PC conceived the study, participated in its design and co-ordination and were involved in phases of the experi-mental work.
Acknowledgements
This study is part of the research conducted by RESMALCHIP, a European Research Consortium, contract QLK2-CT-2002-01503. Virgílio E. do Rosário and Pedro Cravo were funded by the Instituto de Higiene e Medic-ina Tropical/UNL, Portugal. Isabel D. Ferreira was funded by RESMALCHIP (contract QLK2-CT-2002-01503). We thank the staff of the Centro Poli-clínico de Saúde de Água Grande, city of São Tomé.
References
1. Wongsrichanalai C, Pickard AL, Wernsdorfer WH, Meshnick SR:
Epidemiology of drug-resistant malaria. Lancet Infect Dis 2002,
2:209-218.
2. Cravo P, Culleton R, Afonso A, Ferreira ID, do Rosário VE: Mecha-nisms of drug resistance in malaria: current and new chal-lenges. Anti-infective Agents in Medicinal Chemistry 2006, 5:63-73. 3. Cowman AF, Galatis D, Thompson JK: Selection for mefloquine
resistance in Plasmodium falciparum is linked to amplification of the pfmdr1gene and cross-resistance to halofantrine and quinine. Proc Natl Acad Sci USA 1994, 91:1143-1147.
4. Ginsburg H: Should chloroquine be laid to rest? Acta Trop 2005,
96:16-23.
5. Meierjohann S, Walter RD, Muller S: Regulation of intracellular glutathione levels in erythrocytes infected with chloroquine-sensitive and chloroquine-resistant Plasmodium falciparum.
Biochem J 2002, 368:761-768.
6. Dubois VL, Platel DF, Pauly G, Tribouley-Duret J: Plasmodium berghei: implication of intracellular glutathione and its related enzyme in chloroquine resistance in vivo. Exp Parasitol
1995, 81:117-124.
7. Srivastava P, Puri SK, Kamboj KK, Pandey VC: Glutathione-S-transferase activity in malarial parasites. Trop Med Int Health
1999, 4:251-254.
8. Efferth T: Mechanistic perspectives for 1,2,4 trioxanes in anti-cancer therapy. Drug Resist Updat 2005, 8:85-97.
9. Uhlemann AC, Cameron A, Eckstein-Ludwig U, Fischbarg J, Iserovich P, Zuniga FA, East M, Lee A, Brady L, Haynes RK, Krishna S: A single amino acid residue can determine the sensitivity of SERCAs to artemisinins. Nat Struct Mol Biol 2005, 12:628-629.
10. Pickard AL, Wongsrichanalai C, Purfield A, Kamwendo D, Emery K, Zalewski C, Kawamoto F, Scott Miller R, Meshnick SR: Resistance to antimalarials in southeast Asia and genetic polymor-phisms in pfmdr1. Antimicrob Agents Chemother 2003,
47:2418-2423.
11. Price RN, Uhlemann AC, Brockman A, McGready R, Ashley E, Phaipun L, Patel R, Laing K, Looareesuwan S, White NJ, Nosten F, Krishna S: Mefloquine resistance in Plasmodium falciparum and increased pfmdr1 gene copy number. Lancet 2004, 364:438-447. 12. Plowe CV, Djimde A, Bouare M, Doumbo O, Wellems TE:
Pyrimethamine and proguanil resistance-conferring muta-tions in Plasmodium falciparum dihydrofolate reductase: polymerase chain reaction methods for surveillance in Africa. Am J Trop Med Hyg 1995, 52:565-568.
13. Plasmodium falciparum GeneDB [http://www.genedb.org/ genedb/malaria/blast.jsp]
14. Rozen S, Skaletsky HJ: Primer3 on the WWW for general users and for biologist programmers. In Bioinformatics Methods and Pro-tocols: Methods in Molecular Biology Edited by: Krawetz S, Misener S. Humana Press, Totowa, NJ; 2000:365-386.
15. Oligonucleotide Properties Calculator [http:// www.basic.northwestern.edu/biotools/oligocalc.html]
16. Livak KJ, Schmittgen TD: Analysis of relative gene expression data using real-time quantitative PCR and the 2-∆∆Ct method. Methods 2001, 25:402-408.
17. Pfaffl MW: A new mathematical model for relative quantifica-tion in real-time RT-PCR. Nucleic Acids Res 2001, 29:2002-2007. 18. Wellems TE, Panton LJ, Gluzman IY, Rosário VE, Gwadz RW, Walker-Jonah A, Krogstad DJ: Chloroquine resistance not linked to mdr-like genes in a Plasmodiumfalciparum cross. Nature