This is the Accepted Version of a paper to be published in
the journal: Global Change Biology
Ferrari, Renata, Bryson, Mitch, Bridge, Tom, Hustache, Julie, Williams, Stefan B., Byrne, Maria, and Figueira, Will (2015) Quantifying the response of
structural complexity and community composition to environmental change in marine communities. Global Change Biology, 22 (5). pp. 1965-1975.
Accepted
Article
This article has been accepted for publication and undergone full peer review but has not been through the copyediting, typesetting, pagination and proofreading process, which may
Received Date : 15-Oct-2015
Accepted Date : 13-Nov-2015
Article type : Technical Advances
Title: Quantifying the response of structural complexity and community composition to environmental change in marine communities
Running Head: Measuring change in marine habitat complexity
Authors: Renata Ferrari1,2, Mitch Bryson2,Tom Bridge3,4, Julie Hustache1, Stefan B. Williams2, Maria Byrne1,5, Will Figueira1
1
Coastal and Marine Ecosystems Group, School of Biological Sciences, University of Sydney, Sydney, NSW, Australia
2
Australian Centre for Field Robotics, University of Sydney, Sydney, NSW, Australia
3
Australian Research Council Centre of Excellence for Coral Reef Studies, James Cook University, Townsville, QLD 4811, Australia
4
Australian Institute of Marine Science, Townsville MC, Townsville, QLD, Australia
5
Schools of Medical and Biological Sciences , University of Sydney, Sydney, NSW, Australia
Corresponding author: Dr. Mitch Bryson, Ph: +61-2-9351-5583, Fax: +61-2-9351-7474, email: [email protected]
Accepted
Article
Type of Paper: Technical Advance
Abstract:
Habitat structural complexity is a key factor shaping marine communities. However, accurate
methods for quantifying structural complexity underwater are currently lacking. Loss of structural complexity is linked to ecosystem declines in biodiversity and resilience. We
developed new methods using underwater stereo-imagery spanning four years (2010-2013) to reconstruct 3D models of coral reef areas, and quantified both structural complexity at two
spatial resolutions (2.5 and 25 cm) and benthic community composition to characterise changes after an unprecedented thermal anomaly on the west coast of Australia in 2011. Structural complexity increased at both resolutions in quadrats (4 m2) that bleached, but not
those that did not bleach. Changes in complexity were driven by species-specific responses to warming, highlighting the importance of identifying small-scale dynamics to disentangle
ecological responses to disturbance. We demonstrate an effective, repeatable method for quantifying the relationship among community composition, structural complexity and ocean warming, improving predictions of the response of marine ecosystems to environmental
change.
Introduction
Habitat complexity is an important predictor of species richness and abundance in numerous
marine ecosystems, including kelp forests, seagrass beds and coral reefs (Luckhurst and Luckhurst 1978; Gratwicke and Speight 2005; Kovalenko et al., 2012). Although some
Accepted
Article
ecosystem engineers, such as corals on tropical reefs or seaweeds on temperate reefs. Shifts in habitat-forming taxa and associated changes to structural complexity can have significant
and long-lasting effects on marine ecosystems (Steneck et al., 2002; Graham et al., 2006, Roff et al., 2015). Consequently, understanding the relationship between the composition of
ecosystem engineer communities and habitat complexity is critical for predicting the response of marine ecosystems to environmental change (Nagelkerken et al., 2000). However, despite the widespread acknowledgement of the importance of structural complexity, quantitative,
repeatable methods for measuring complexity in marine systems are either costly (e.g. Airborne LiDAR (Brock et al., 2004)) or infeasible for use over large spatial extents (e.g.
manual measurements using diver-based surveys).
Increases in the frequency and severity of disturbances are altering the abundance and
distribution of ecosystem engineers, leading to widespread changes in the composition of marine communities. For example, declines in the abundance of seaweeds (on temperate reefs) and corals (on tropical reefs) have precipitated shifts in the composition and body size
structure of associated fish assemblages (Halford and Caley 2009; Wernberg et al., 2012; Nash et al., 2015). However, not all coral or seaweed species contribute equally to the
provision of structural complexity. Different species also show differential vulnerability to disturbances such as temperature anomalies, disease and storms (Wernberg et al., 2012;
Bridge et al., 2014; Madin et al., 2014). Consequently, understanding the relationships between community composition and structural complexity is critical for predicting
Accepted
Article
Disturbances such as warm-water induced coral bleaching have resulted in significant shifts in the composition of coral communities and over large spatial scales (Baker et al., 2008;
Darling et al. 2013; McClanahan et al. 2014). However, the response of coral assemblages to disturbance events is taxonomically and spatially heterogeneous, particularly at the small but
ecologically important spatial extents of 1-10 m (Baker et al., 2008; Madin et al., 2014). Maintaining structural complexity is a key factor determining whether a reef community returns to a coral-dominated or shifts to an algal-dominated state following disturbance
(Graham et al., 2015). Consequently, predictions of coral reef vulnerability and recovery potential would be empowered by a greater understanding of the relationship between
community composition and structural complexity at small, ecologically relevant spatial extents (Harborne et al., 2012), potentially providing an ‘early-warning’ system for reefs at
risk of shifting to alternative, undesirable stable states (Kennedy et al., 2013).
The status and trajectories of coral reefs in many regions is assessed through monitoring programs such as the Global Coral Reef Monitoring Network (see
http://www.icriforum.org/gcrmn). Despite the clear importance of structural complexity for determining ecosystem resilience, complexity is rarely incorporated into monitoring
programs in a quantitative manner. Instead, most monitoring focuses on metrics such as the percent cover of live corals, which cannot account for size-dependent changes in colony
morphology (Madin et al., 2014), changes in morphology among habitats (Veron 2000), or additional complexity provided by the underlying substrate. Furthermore, some disturbances may alter the composition of coral communities, thereby influencing structural complexity
and coral size distribution, without significantly affecting total coral cover (Berumen and Pratchett 2006, Ferrari et al., 2012b). The relatively weak relationship between live coral
Accepted
Article
complexity (Graham and Nash 2013) demonstrates the need to develop better metrics for
quantifying indicators of coral reef status.
Effectively quantifying structural complexity requires measurement across multiple spatial
extents and resolutions, because individuals of different species and with different body sizes and morphologies influence complexity at different scales (Tews et al., 2004; Bozec et al., 2013; Nash et al., 2013). Many methods have been developed to measure habitat complexity
underwater (e.g. Risk 1972; McCormick 1994; Graham and Nash 2013), and considerable interest surrounds the use of high-resolution 3D terrain models of the seascape reconstructed using close-range photogrammetry (Leon et al., 2015; Burns et al., 2015). Close-range
photogrammetry provides a powerful tool for examining marine habitat complexity across broad spatial scales. Reconstructions derived from photogrammetry enable precise
measurements of structural complexity using area-based analogues of the traditional chain-and-tape method, and provide lower error variance than other methods (Friedman et al., 2013). Reconstructing 3D topographic data also allows structural complexity measurements
across multiple spatial resolutions (analogous to the link size in chain-and-tape
measurements) by sub-sampling the generated terrain surface (mesh of interconnected
triangular faces) at a range of different resolutions. Spatial resolution (or the distance between vertices in the mesh, hereafter referred to as link size) is an important factor in structural
complexity measurements (Knudby and LeDrew, 2007) but is rarely reported (Graham and Nash, 2013).
We quantified the spatial and temporal variation in community composition and structural
Accepted
Article
2014). Using precisely-aligned, georeferenced orthomosaics of AUV-derived images, we examined: 1) the effect of coral bleaching and changes in community composition on
structural complexity across multiple years; and 2) which taxa contributed to changes in structural complexity at different spatial resolutions/link sizes. We demonstrate the use of
new post-processing methods for constructing high-resolution orthomosaics (derived using 2mm per pixel AUV imagery) and 3D terrain reconstructions (Johnson-Roberson et al., 2010) (2.5 cm link size) over 625 m2 reef areas. We produced Digital Surface Models (DSMs)
across multiple surveys over a period of four years, from which the changes of community composition and structural complexity were quantified. We undertook precisely geo-located
and repeated measurements (precision ± 5cm), without the need for diver-based data
collection or permanent infrastructure to mark site location. For the first time, we quantified the changes in structural complexity across years and over multiple spatial resolutions (from
2.5cm to 25cm), an approach broadly applicable to a wide range of marine ecosystems.
Materials and Methods Study Site
The study was conducted at ee an E), a submerged bank in the
Houtman Abrolhos Islands (HAI), Western Australia (Fig. 1). In the austral summer of 2010-11, the region experienced an unprecedented ‘marine heatwave’ associated with strong La
Niña conditions (Pearce and Feng, 2013; Zinke et al., 2014) verage sea surface
temperatures in e ruary pea ed at C above long-term monthly averages over of
latitude of the Western Australian coast (Pearce and Feng, 2013). In the HAI, the average
Accepted
Article
on HadISST) (Abdo et al., 2012). This marine heatwave resulted in the first documented mass bleaching event in the HAI, and also had detrimental effects on macroalgae, fish and
marine invertebrates (Wernberg et al., 2012; Bridge et al., 2014). Additional smaller thermal anomalies occurred during the summer of 2012 and 2013 (see
http://coralreefwatch.noaa.gov/satellite/vs/australia.php).
Data Collection
Autonomous Underwater Vehicles (AUVs) are increasingly being used for oceanic and seafloor ecology and monitoring to complement traditional approaches involving SCUBA
and ship-towed video (Bridge et al., 2011; Smale et al., 2012; Williams et al., 2012). They are well suited to collecting high-resolution optical imagery of the seafloor due to their ability for precise trajectory control and because they provide an ideal platform for mounting
stereo-cameras (Yoerger et al., 2007; Williams et al., 2012). Importantly, AUVs allow for repeatable surveying of spatially-precise observational units, owing to precise navigation and the ability
to revisit a location with a high degree of accuracy (Williams et al., 2010; Bryson et al., 2013).
Stereo images were collected using the AUV Sirius in April of each year from 2010-2013. This allowed comparison among years while minimising the influence of seasonal variability
of some taxa (e.g. macroalgae). Maintaining an altitude of 2 m above the seafloor and a speed of approximately 1 m/s using a Doppler velocity log sensor, the AUV captured stereo image pairs with a resolution of 1360-by-1024 pixels and a footprint of approximately 1.5 x 1.2 m at
Accepted
Article
Georeferencing, accurate to ±0.5 cm (accuracy determined by visual re-identification of seafloor features), was conducted using a combination of ship-based GPS at the surface, an
Ultra-Short BaseLine (USBL) acoustic positioning system, Doppler velocity log and depth sensors to determine the vehicle’s location in real-time. These tools enabled repeated surveys
of the same geographical location each year without the need for fixed infrastructure on the reef (Williams et al., 2012). Data were collected over three 625 m2 (25 x 25 m) plots, each consisting of overlapping stereo image pairs that allowed for three contiguous sections of the
reef to be mapped in 3D at high-resolution in each year. The three plots were 50 – 100 m apart to ensure spatial independence and capture spatial heterogeneity within each site
(Hurlbert, 1984).
Post Processing and Precisely Aligned ‘Virtual Quadrats’
In order to evaluate the effect of bleaching on changes in habitat complexity we selected 61 ‘virtual quadrats’ (2 x 2 m) from each plot. Each quadrat was analysed from imagery taken in
2010, 2011 and 2013 to identify temporal changes in community composition and structural complexity over the three-year period. The quadrat size was selected to be similar to but slightly larger than spatial extents used in past coral reef studies (e.g. 0.5 to 2.0 m) in order to
encapsulate effects that occurred directly on top of coral colonies and the immediate spatial region around colonies. Quadrats were selected based on the presence of bleached corals in
post-Accepted
Article
processing steps (described below), and precisely spatially-aligned to ensure high spatial precision among years. Each quadrat contained an orthographically-projected colour
photomosaic layer with a resolution of 2 mm per pixel and a 3D topographic surface model layer (composed of a regular grid of vertices and triangular surface elements) with a link size
of 2.5 cm per grid cell. Post-processing consisted of a bundle adjustment algorithm (Bryson et al., 2012) for highly accurate estimation and refinement of stereo camera poses and lens distortion calibration parameters, a 3D terrain reconstruction and texturing algorithm
(Johnson-Roberson et al., 2010) and an inter-year precision spatial alignment technique (Bryson et. al, 2013). The multi-year spatial alignment of the virtual quadrats was performed
first by using an automated technique (Bryson et al., 2013) to provide a coarse alignment, followed by an additional correction step in which common features in the quadrats were annotated by hand (using up to 10 points) and used to precisely align the plots to an accuracy
of ±5cm (based on residual analysis of the annotated features).
Benthic Community Composition and Bleaching
We estimated the areal coverage of the five most abundant coral (branching Acropora
[AcBr], tabulate Acropora [AcTb] and plating Montipora spp. [Mon]) and algal (simple algae with canopy height less than 5 cm [MAs] and complex algae with canopy height > 5 cm
[MAc]) morphotypes in each quadrat using a polygonal region-based labelling scheme in ImageJ (version 1.47, http://imagej.nih.gov/ij/). Photomosaics for each quadrat were divided into hand-annotated regions, with each region assigned to one of the five morphotypes which together accounted for ~95% of epibenthic taxa in the quadrats. The areal (m2) and percent coverage of each taxon was estimated in all quadrats for 2010 and 2013 to evaluate change
Accepted
Article
Structural Complexity
To examine change in structural complexity over the study period, we quantified structural
complexity as surface rugosity sensu (Friedman et al., 2012). Surface rugosity was calculated by dividing the actual surface area of the 3D terrain by the area of the terrain projected onto a flat plane, which can be either the plane of best fit or the horizontal plane. We used the plane
of best fit in order to decouple structural complexity from the effect of slope. A plane-of-best-fit algorithm, based on a least-squares plane-of-best-fit to the vertices of the topographic model, was used
to transform the surface model of each quadrat into its own coordinate system. Surface rugosity (SR) was calculated for each quadrat in 2010 and 2013, at both 2.5 cm (SR2.5) and
25 cm (SR25) link sizes. Measurements of SR2.5 were derived from the original DSMs for
SR2.5, while values for SR25 were obtained by downscaling the original layers to a 25cm grid
size. The 2.5 cm scale was selected based on the maximum consistently derived topographic
resolution achievable from the AUV images used in this study, and is similar to chain link lengths used in previous studies on structural complexity of coral reefs (Knudby and LeDrew,
2007; Graham and Nash, 2013). The 25 cm scale was selected as one order of magnitude greater, and is a scale likely to be relevant as shelter for small and medium-sized reef fish (Caley and St. John, 1996; Rogers et al., 2014). Link sizes greater than 25 cm required a level
of 3D surface sub-sampling that resulted in a high degree of measurement error within the 2 x 2 m quadrats used in this study, and hence were not used. The maximum achievable link size
is dependant on the spatial extent over which measurement are made; in practice we found that link sizes could be derived up to approximately one tenth of the spatial measurement unit
(quadrat size) considered. Surface rugosity was calculated as:
Accepted
Article
Where ai is the actual area of a surface face element i, i=1 to N, and aproj,i is the
orthographically projected area of face i, corresponding to the coordinate system based on the plane-of-best-fit. Change in SR (CSR) was calculated as the difference in SR measurements made in 2013 to those made in 2010 in a given quadrat, and was computed at both the 2.5cm
and 25cm link sizes separately.
Statistical analyses
We used multivariate Generalised Linear Models (GLMs) to investigate the relationship between benthic community composition and two categorical explanatory variables: year
(2010, 2013) and bleaching incidence, a binary response depending on whether bleaching was observed in a quadrat (‘bleached’) or not ‘not leached’). A negative binomial distribution was applied to all models to account for over-dispersion, and 999 pit-trap
re-sampling iterations were run for each model to account for correlation in testing and calculate model term p-values using the R package mvabund (Wang et al., 2013). Data were also examined using distance-based multivariate data (e.g. PERMANOVA; Anderson et al., 2008), which produced parsimonious results. We present only the results of the multivariate GLMs, which are considered more statistically robust, given that in contrast to the negative
binomial distribution, transforming raw data and distance-based methods can potentially confound the effects of explanatory variables and thus inflate p-values, leading to incorrectly
rejecting the null hypothesis (Warton et al., 2012). Residual plots were used to verify that model assumptions were not violated. The results were visualised using non-metric
Accepted
Article
We used hierarchical linear mixed-effects models (GLMMs) to investigate the effect of bleaching on the change in surface rugosity over time for both SR2.5 and SR25. The models
used change in surface rugosity CSR2.5 or CSR25 as the response variable and bleaching state
in 2011 (bleached or not bleached), percent cover of benthic taxa in each quadrat in 2011 and
changes in the percent coverage from 2011 to 2013 as explanatory variables (Table 1). In all models ‘plot’ was originally included as a random effect, but was subsequently removed
because it did not improve model fit (Zuur et al., 2009). Model fit was evaluated using
Aikaike Information Criterion, Bayesian Information Criterion and Maximum Likelihood, with all three metrics agreeing on the best-fitting model in all cases. Residual plots were used
to verify assumptions of normality, independence and heteroscedasticity. All GLMMs were run using the package lme4 (Bates et al., 2013) in R.
Results and Discussion
Using high-resolution spatial models, we detected and quantified shifts in community composition and structural complexity at both link sizes (SR2.5 and SR25). Importantly, our
results showed that changes in surface rugosity were dependent on the occurrence of
bleaching, identified which taxa were responsible for driving changes in surface rugosity and showed the link sizes at which changes in rugosity occurred. Our results demonstrate that
three-dimensional terrain reconstructions can be used to quantify disturbance-mediated shifts in both community composition and surface rugosity, and provides a basis for predicting the impact of ocean warming on habitat structural complexity, a key attribute of marine
Accepted
Article
Change in community composition
Community composition of the most abundant epibenthic taxa changed significantly between
2010 and 2013, and among bleached and unbleached quadrats (Table 2). The interaction between year and bleaching was significant, meaning that the multiplicative effect of year on the mean abundance of the morphospecies present in each quadrat differed between quadrats
that bleached in 2011 and quadrats that did not. Differences in community composition between years were primarily due to changes in the abundance of plating Montipora,
branching Acropora and complex macroalgae (Fig. 2). The 2011 bleaching event had a significant effect on the subsequent composition of quadrats in 2013. There were greater
declines in Montipora and increases in branching Acropora in quadrats where bleaching was observed in 2011 (Fig. 3).
Change in Surface Rugosity
Across all quadrats, there was a significant increase in surface rugosity at both SR2.5 (12%
mean ± 2.9% SE) and SR25 (4.1% mean ± 0.7% SE) over 2010-2013 (Table 3). However,
changes in complexity varied significantly between quadrats where bleaching was observed
in 2011 versus quadrats with no bleaching. At both link sizes, structural complexity increased significantly from 2010 to 2013 in quadrats with bleaching, but not in quadrats that did not
bleach (Table 3, Fig. 4).
Changes in surface rugosity were related to shifts in the relative abundances of the three
dominant coral morphospecies at smaller link sizes (SR2.5), but not at the larger link size
(SR25). For SR2.5, changes in the abundance of branching and tabulate Acropora had
Accepted
Article
2010 showed a significant increase in SR2.5, due to increased abundance of branching
Acropora over the three-year period. Increases in complexity at SR2.5 were more frequent in
quadrats where bleaching occurred in 2011 than quadrats with no bleaching. In contrast, increased abundance of tabulate Acropora from 2010-2013 was related to a significant decrease in SR2.5, which was also more frequently observed in bleached quadrats (Table 3,
Fig. 4).
Bleaching incidence was the only significant predictor of increase in SR25. However, initial
cover of branching Acropora was related to an increase of SR25 but only in unbleached
quadrats and so improved model fit, and was therefore retained in the final model (Table 3,
Fig. 5).
Implications for quantifying changes in benthic marine communities
Habitat complexity is important for maintaining resilience of coral-dominated reefs (Graham et al., 2015). The mechanisms by which complexity increases resilience are not fully
understood, but may involve processes such as coral recruitment or because complexity
increases cross-scale redundancy of important functional groups such as herbivores (Nash et al., 2015). Despite the increasing importance of quantifying structural complexity for coral
reef management and monitoring (Graham and Nash, 2013), techniques for quantifying structural complexity in marine ecosystems, particularly at small spatial resolutions (1s to 10s of centimetres) are rudimentary, labour-intensive, and/or subjective and are not easily
repeatable (Friedman et al., 2013). Here, we demonstrate the novel insights that can be gained through use of precisely-aligned, multi-temporal 3D image reconstructions to quantify
Accepted
Article
approach provides a framework to link changes in community composition to structural complexity and identify which taxa are most critical to coral reef recovery. The total increase
in complexity observed in our study was small, yet we were able to detect this increase consistently and identify links between bleaching history and changes in complexity.
Attributing these differential responses among quadrats to changes in specific taxa would not be possible with traditional methods of quantifying structural complexity. Combined with information on the vulnerability to disturbances, understanding the contribution of different
taxa to structural complexity across multiple scales will enable better predictions of
ecosystem trajectories, and could potentially provide an ‘early-warning’ system for reefs at
risk of shifting ecological states.
Disturbances such as coral bleaching commonly show high spatial and taxonomic variability
(Baker et al., 2008; Guest et al., 2012; Bridge et al., 2014), but the effects of such
heterogeneity on coral reef recovery and resilience are poorly understood. In the HAI, our counter-intuitive finding that complexity increased at sites where bleaching occurred was
caused by the greater vulnerability of plating taxa (Montipora and tabulate Acropora) than branching Acropora (Bridge et al., 2014). At smaller link sizes (SR2.5), higher abundance of
plating corals reduced complexity, but branching Acropora increased complexity (Fig. 6). Complexity also increased at larger link sizes (SR25), but the change could not be attributed to
a particular taxon. Understanding the relationships between community composition and structural complexity, particularly in the context of taxonomic variability in vulnerability to disturbance, is critical for predicting the responses of reef biodiversity to environmental
Accepted
Article
The abundance of branching corals has been shown to influence the richness and diversity of fish assemblages (e.g. Chabanet et al., 1997), and an increase in branching corals may
mitigate bleaching-related shifts in the fish assemblage in the HAI (Halford and Caley, 2009; Emslie et al., 2014). However, it is important to consider how different coral reef fishes
utilise complexity at different scales, depending on factors such as body size, ontogeny or species identity (e.g. Caley and St John, 1996; Harborne et al., 2011; Wen et al., 2013; Nash et al., 2013; Rogers et al., 2014). For species with known habitat preferences, our method can
be used to identify key habitat areas for different taxa by examining entire image mosaics over multiple spatial scales, enabling rapid assessments of habitat suitability for a wide range
of species at different life history stages (Harborne et al., 2012; Ferrari et al., 2012b). Changes in habitat quality through time can also be quantified through identification of changes in community composition and/or complexity at specific spatial resolutions (Fig. 2).
The use of multiple spatial resolutions also potentially allows for the calculation of scale-invariant complexity indices which may provide good explanations of benthic composition
(Leon et al., 2015). By decoupling changes in community composition from changes in complexity, we were able to identify critical changes in habitat complexity not detectable using traditional metrics such as coral cover or semi-quantitative metrics of complexity
averaged across an entire transect.
Repeated measurements of sessile marine biota at spatially-fixed sample locations (in this case quadrats) yield lower error-variance in estimates of change compared to measurements where sample locations vary in subsequent years, even within the same site (Van der Meer,
1997; Ryan and Heyward, 2003). Furthermore, repeated measures have been used to
disentangle important ecological processes driving underwater ecosystem trajectories, such as
Accepted
Article
our method will provide more accurate values for the change in complexity than other commonly-used methods, such as contour-chain or semi-quantitative visual estimates (e.g.
Wilson et al., 2007) owing to the use of precisely repeated spatial units, which are difficult to achieve using other methods. Repeated surveys of fixed sample locations in sub-tidal habitats
typically require the presence of fixed markers (such as permanent stakes), which can limit the number of samples and spatial scale of data collection, and are also vulnerable to dislodgement from storms. The use of AUVs and the development of post-processing tools
demonstrated here enable high-precision spatially-repeated measurements (±5cm) of key variables (benthic community composition and structural complexity) without the need for
permanent markers. In addition, our method identifies which taxa explain changes in complexity, providing greater insight into mechanisms by which structural complexity is generated and maintained. Although AUVs provide an ideal platform for large-scale repeat
monitoring, photogrammetry-derived DSMs are also possible using manually-operated underwater camera systems (Leon et al., 2015), allowing for the techniques described here to
be potentially used when AUVs are not available.
Importantly, spatially repeated measurements derived from three-dimensional image
reconstructions allow analysis of distribution of changes in these variables rather than just the
change in distribution, and can be measured over a range of small to intermediate spatial scales. Given the importance of both community composition and habitat complexity to biodiversity and ecosystem processes, our method provides an effective means of identifying changes in marine habitats and predicting key habitat changes likely to affect marine
Accepted
Article
Acknowledgements
This project was funded y the reat Barrier Reef oundation’s Resilient oral Reefs
Successfully Adapting to Climate Change research and development program in
collaboration with the Australian Government. Additional support was provided by The ustralian Research ouncil R ) and ustralia’s Integrated Marine O serving ystem
(IMOS), funded by the Department of Innovation, Industry, Science and Research through the National Collaborative Research Infrastructure Scheme and the Education Investment
Fund, and the Marine Biodiversity Hub, a collaborative partnership supported through funding from the Australian overnment’s National Environmental Research Program
(NERP). Vessels to support AUV missions were provided by the University of Western Australia, CSIRO and the Department of Fisheries Western Australia.
Data availability
All imagery collected by the AUV and used in this study are freely available through the Australian Ocean Data Network Portal at https://auv.aodn.org.au/auv/ and the Integrated Marine Observing System Data Portal at http://imos.org.au/auv_data.html.
References
Abdo DA, Bellchambers LM, Evans SN (2012) Turning up the Heat: Increasing Temperature and Coral Bleaching at the High Latitude Coral Reefs of the Houtman Abrolhos Islands.
PLoS ONE 7(8): e43878. doi:10.1371/journal.pone.0043878.
Anderson MJ, Gorley RN, Clarke KR (2008) PERMANOVA+ for PRIMER: Guide to
Accepted
Article
Baker AC, Glynn PW, Riegl B (2008) Climate change and coral reef bleaching: an ecological assessment of long-term impacts, recovery trends and future outlook. Estuarine, Coastal
and Shelf Science 80:435-471.
Bates D, Maechler M, Bolker B (2013) Lme4: Linear mixed-effects models using S4 classes
R package. Available at https://cran.r-project.org/web/packages/lme4/index.html. Berumen ML, Pratchett MS (2006) Recovery without resilience: persistent disturbance and
long-term shifts in the structure of fish and coral communities at Tiahura Reef, Moorea.
Coral Reefs 25:647-653.
Bozec YM, Yakob L, Bejarano S, Mumby PJ (2013) Reciprocal facilitation and non-linearity
maintain habitat engineering on coral reefs. Oikos 122:428-440.
Bridge TCL, Done TJ, Beaman RJ, Friedman A, Williams SB, Pizarro O, Webster JM (2011) Topography, substratum and benthic macrofaunal relationships on a tropical mesophotic
shelf margin, central Great Barrier Reef, Australia. Coral Reefs 30(1):143-153.
Bridge TC, Ferrari R, Bryson M, Hovey R, Figueira WF, Williams SB, Pizarro O, Harborne AR, Byrne M (2014) Variable responses of benthic communities to anomalously warm
sea temperatures on a high-latitude coral reef. PLoS ONE 9(11): e113079.
doi:10.1371/journal.pone.0113079.
Brock JC, Wright CW, Clayton TD, Nayegandhi A (2004) LIDAR optical rugosity of coral reefs in Biscayne National Park, Florida. Coral Reefs 23(1):48-59.
Accepted
Article
Bryson M, Johnson-Roberson M, Pizarro O, Williams S (2013) Automated Registration for Multi-year Robotic Surveys of Marine Benthic Habitats. In IEEE/RSJ International Conference on Intelligent Robots and Systems, November, Tokyo, Japan, pp. 3344-3349. Burns JHR, Delparte D, Gates RD, Takabayashi M (2015) Integrating structure-from-motion
photogrammetry with geospatial software as a novel technique for quantifying 3D
ecological characteristics of coral reefs. PeerJ doi:10.7717/peerj.1077.
Caley MJ, St. John J (1996) Refuge availability structures assemblages of tropical reef fishes.
Journal of Animal Ecology 65:414-428.
Chabanet P, Ralambondrainy H, Amanieu M, Faure G, Galzin R (1997) Relationships
between coral reef substrata and fish. Coral Reefs 16:93-102.
Darling ES, McClanahan TR, Cote IM (2013) Life histories predict coral community
disassembly under multiple stressors. Global Change Biology 19:1930-1940.
Emslie MJ, Cheal AJ, Johns KA (2014) Retention of Habitat Complexity Minimizes Disassembly of Reef Fish Communities following Disturbance: A Large-Scale Natural
Experiment. PLoS ONE 9(8): e105384. doi:10.1371/journal.pone.0105384.
Ferrari R, Gonzalez-Rivero M, Ortiz JC, Mumby PJ (2012a) Interaction of herbivory and
seasonality on the dynamics of Caribbean macroalgae. Coral Reefs 31:683-692.
Ferrari R, Gonzalez-Rivero M, Mumby PJ (2012b) Size matters in competition between corals and macroalgae. Marine Ecology Progress Series, 467:77-88.
Friedman A, Pizarro O, Williams SB, Johnson-Roberson M (2013) Multi-Scale Measures of Rugosity, Slope and Aspect from Benthic Stereo Image Reconstructions. PLoS ONE
Accepted
Article
Graham NAJ, Wilson SK, Jennings S, Polunin NVC, Bijoux JP, Robinson J (2006) Dynamic fragility of oceanic coral reef ecosystems. Proceedings of the National Academy of
Sciences USA 103:8425-8429.
Graham NAJ and Nash KL (2013) The importance of structural complexity in coral reef
ecosystems, Coral Reefs 32:315-326.
Graham NAJ, Jennings S, MacNeil MA, Mouillot D, Wilson SK (2015) Predicting
climate-driven regime shifts versus rebound potential in coral reefs. Nature 518:94-97.
Gratwicke B, Speight MR (2005) The relationship between fish species richness, abundance and habitat complexity in a range of shallow tropical marine habitats. Journal of Fish
Biology 66:650-667.
Guest JR, Baird AH, Maynard JA et al. (2012) Contrasting patterns of coral bleaching susceptibility in 2010 suggest adaptive response to the thermal stress. PLoS ONE 7(3):
e33353. doi:10.1371/journal.pone.0033353.
Halford AR, Caley MJ (2009) Towards an understanding of resilience in isolated coral reefs.
Global Change Biology 15:3031-3045.
Harborne A, Mumby P, Kennedy E, Ferrari R (2011) Biotic and multi-scale abiotic controls of habitat quality: their effect on coral-reef fishes. Marine Ecology Progress Series
437:201-214.
Harborne AR, Mumby PJ, Ferrari R (2012) The effectiveness of different meso-scale rugosity
metrics for predicting intra-habitat variation in coral-reef fish assemblages. Environmental Biology of Fishes 94:431-442.
Accepted
Article
Ecology Monographs 54:187-211.
Johnson-Roberson M, Pizarro O, Williams S, Mahon I (2010) Generation and Visualization
of Large-scale Three-dimensional Reconstructions from Underwater Robotic Surveys. Journal of Field Robotics 27(1):21-51.
Kennedy EV, Perry CT, Halloran PR et al. (2013) Avoiding coral reef functional collapse requires local and global action. Current Biology 23:912–918.
Knudby A, LeDrew E (2007) Measuring Structural Complexity on Coral Reefs. In Diving for Science: Proceedings of the American Academy of Underwater Sciences 26th Symposium
(eds Pollock NW, Godfrey JM), September, Dauphin Island, AL, USA.
Kovalenko KE, Thomaz SM, Warfe DM (2012) Habitat complexity: approaches and future directions. Hydrobiologia 685:1-17.
Leon JX, Roelfsema CM, Saunders MI, Phinn SR (2015) Measuring coral reef terrain
roughness using ‘ tructure-from-Motion’ close-range photogrammetry. Geomorphology 242:21-28.
Luckhurst BE, Luckhurst K (1978) Analysis of the influence of substrate variables on coral reef fish communities. Marine Biology 49:317-323.
Madin JS, Baird AH, Dornelas M, Connolly SR (2014) Mechanical vulnerability explains
size-dependent mortality of reef corals. Ecology letters 17(8):1008-1015.
McClanahan TR, Ateweberhan M, Darling ES, Graham NAJ, Muthiga NA (2014)
Biogeography and Change among Regional Coral Communities across the Western Indian Ocean. PLoS ONE 9(4):e93385. doi:10.1371/journal.pone.0093385.
Accepted
Article
their associations with a tropical reef fish assemblage. Marine Ecology Progress Series
112:87-96.
Nagel er ena I Van der Velde orissena MW Meijera J Van’t Hof T Den Hartog
(2000) Importance of Mangroves, Seagrass Beds and the Shallow Coral Reef as a Nursery for Important Coral Reef Fishes, Using a Visual Census Technique. Estuarine, Coastal
and Shelf Science 51:31-44.
Nash KL, Graham NAJ, Bellwood DR (2013) Fish foraging patterns, vulnerability to fishing,
and implications for the management of ecosystem function across scales. Ecological Applications 23:1632-1644.
Nash KL, Graham NAJ, Jennings S, Wilson SK, Bellwood DR (2015) Herbivore cross-scale redundancy supports response diversity and promotes coral reef resilience. Journal of
Applied Ecology doi: 10.1111/1365-2664.12430.
Oksanen J, Blanchet FG, Kindt R et al. (2015) ‘vegan’ ommunity Ecology R Package. Available at http://cran.r-project.org/web/packages/vegan.
Pearce eng M ) The rise and fall of the ‘‘marine heat wave’’ off Western
Australia during the summer of 2010/11. Journal of Marine Systems 111–112:139–156.
Risk MJ (1972) Fish diversity on a coral reef in the Virgin Islands. Atoll Research Bulletin
193:1-6.
Roff G, Zhao J, Mumby PJ (2015) Decadal-scale rates of reef erosion following El Niño
related mass coral mortality. Global Change Biology doi:10.1111/gcb.13006.
Rogers A, Blanchard JL, Mumby PJ (2014) Vulnerability of Coral Reef Fisheries to a Loss of
Accepted
Article
Ryan DAJ, Heyward A (2003) Improving the precision of longitudinal ecological surveys
using precisely defined observational units. Environmetrics 14:283-293.
Smale DA, Kendrick GA, Harvey ES et al. (2012) Regional-scale benthic monitoring for ecosystem-based fisheries management (EBFM) using an autonomous underwater vehicle
(AUV). ICES Journal of Marine Science 69(6):1108-1118.
Steneck RS, Graham MH, Bourque BJ, Corbett D, Erlandson JM, Estes JA, Tegner MJ (2002) Kelp forest ecosystems: biodiversity, stability, resilience and future.
Environmental Conservation 29(4):436-459.
Tews J, Brose U, Grimm V, Tielborger K, Wichmann MC, Schwager M, Jeltsch F (2004)
Animal species diversity driven by habitat heterogeneity/diversity: the importance of keystone structures. Journal of Biogeography 31:79–92.
Van der Meer J (1997) Sampling design of monitoring programmes for marine benthos: a
comparison between the use of fixed versus randomly selected stations. Journal of Sea Research 37(1):167-179.
Veron JEN (2000) Corals of the world. Australian Institute of Marine Science and CRR Ald
Pty Ltd, Townsville, Australia.
Wang Y, Naumann U, Wright ST, Warton DI (2012) mvabund - an R package for
model-based analysis of multivariate abundance data. Methods in Ecology and Evolution 3:471-474.
Warton DI, Wright TW, Wang Y (2012) Distance-based multivariate analyses confound location and dispersion effects. Methods in Ecology and Evolution 3:89–101.
Accepted
Article
microhabitat associations for three predatory coral reef fishes on the southern Great
Barrier Reef, Australia. Coral Reefs 32:389-398.
Wernberg T, Smale DA, Tuya F et al. (2012) An extreme climatic event alters marine ecosystem structure in a global biodiversity hotspot. Nature Climate Change 3:78–82.
Williams S, Pizarro O, Jakuba M, Mahon I, Ling S, Johnson C (2010) Repeated AUV surveying of urchin barrens in North Eastern Tasmania. In IEEE International
Conference on Robotics and Automation (ICRA), pp. 293–299, May, Anchorage, Alaska. Williams SB, Pizarro O, Jakuba MV et al. (2012) Monitoring of Benthic Reference Sites:
Using an Autonomous Underwater Vehicle. IEEE Robotics and Automation Magazine
19:73–84.
Wilson SK, Graham NAJ, Polunin NVC (2007) Appraisal of visual assessments of habitat
complexity and benthic composition on coral reefs. Marine Biology 151:1069-1076.
Yoerger D, Jakuba M, Bradley A, Bingham B (2007) Techniques for deep sea near bottom survey using an autonomous underwater vehicle, International Journal of Robotics
Research 26:41–54.
Zinke J, Rountrey A, Feng M et al. (2014) Corals record long-term Leeuwin current variability including Ningaloo Nino/Nina since 1795. Nature Communications 5,
doi:10.1038/ncomms4607.
Zuur AF, Ieno EN, Elphick CS (2009) A protocol for data exploration to avoid common
Accepted
Article
Table 1 Explanatory variables tested to explain the change is surface rugosity at two link sizes (2.5 and 25 cm). Plot was also tested as a random effect but not needed.
Explanatory variable Type and levels
Bleaching per quadrat Not totally bleached colonies, totally bleached colonies.
Benthic areal cover in
2010
Branching Acropora spp., tabulate Acropora spp., plating
Montipora spp., complex macroalgae and simple macroalgae Change benthic areal
cover between 2010 and 2013
Accepted
Article
Table 2 Analysis of deviance table for the negative binomial model on the effect of year, bleaching and their interaction on the multivariate abundance of the community composition. P-values calculated using 999 resampling iterations via pit-trap resampling. Values are
deviance, in parentheses p-values and residual degrees of freedom. For the PERMANOVA values are sums of squares, F-statistics, (r-squared, p-values).
Change in benthic community composition Negative binomial GLM
Test statistic =13.71 (p = 0.001)
Non-parametric Multivariate Analyses of Variance (Bray-Curtis)
Bleaching 100.44 (p = 0.001, 120) 1.182, 13.20, (R2 = 0.08, p = 0.001)
Year 43.64 (p = 0.001, 119) 4.48, 32.55 (R2 = 0.19, p = 0.001)
Accepted
[image:29.595.42.503.153.756.2]Article
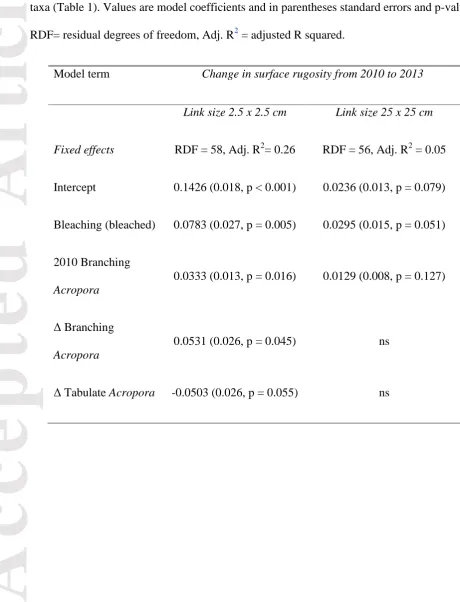
Table 3 Linear model summary table for change in SR2.5 and SR25 as a function of bleaching,
the initial benthic composition and the change in benthic composition of the five dominant
taxa (Table 1). Values are model coefficients and in parentheses standard errors and p-values. RDF= residual degrees of freedom, Adj. R2 = adjusted R squared.
Model term Change in surface rugosity from 2010 to 2013 Link size 2.5 x 2.5 cm Link size 25 x 25 cm Fixed effects RDF = 58, Adj. R2= 0.26 RDF = 56, Adj. R2 = 0.05 Intercept 0.1426 (0.018, p < 0.001) 0.0236 (0.013, p = 0.079)
Bleaching (bleached) 0.0783 (0.027, p = 0.005) 0.0295 (0.015, p = 0.051)
2010 Branching
Acropora
0.0333 (0.013, p = 0.016) 0.0129 (0.008, p = 0.127)
Δ Branching
Acropora
0.0531 (0.026, p = 0.045) ns
Accepted
Accepted
Accepted
Accepted