City, University of London Institutional Repository
Citation
: Sheng, H., Goker, A. S. and He, D. (2001). Web user search pattern analysis for
modelling query topic changes. Paper presented at the User modeling for Context-Aware
Applications Workshop: 8th International Conference on User Modeling, 13 - 17 July 2001,
Sonthofen, Germany.
This is the unspecified version of the paper.
This version of the publication may differ from the final published
version.
Permanent repository link:
http://openaccess.city.ac.uk/610/
Link to published version
:
Copyright and reuse:
City Research Online aims to make research
outputs of City, University of London available to a wider audience.
Copyright and Moral Rights remain with the author(s) and/or copyright
holders. URLs from City Research Online may be freely distributed and
linked to.
City Research Online:
http://openaccess.city.ac.uk/
[email protected]
Web User Search Pattern Analysis for
Modeling Query Topic Changes
Sheng Han, Ayse Goker, and Daqing He
School of Computer and Mathematical Sciences, The Robert Gordon University Aberdeen AB25 1HG, Scotland
{ciesh, asga, dqh}@scms.rgu.ac.uk
Abstract. Web search engine logs are a good source of information for Web
user modeling in which user session analysis is often incurred. However, studies on Web logs assume a user session to cover the complete time period of the data set. In the absence of any further information, we define a user session to be related to the user search topics. Viewing sessions in this way can help overcome problems due to varied approaches in session delimiters. The study in this paper is based on a large corpus of Excite search engine logs. Human expert analysis was performed to identify topic changes. The distribution of topic changes across users is presented. In this paper, we also describe an automatic session detection method on the same logs. For this, we use temporal information in grouping successive user search activities with respect to a user search topic. We then compare these results with human judgements and analyse the errors incurred. These results provide a comparison with other studies on Intranet Web search engine logs.
1. Introduction
The increasing number and size of Web pages have resulted in an important challenge for search engines. On one hand there is the issue of having adequate coverage of a topic, on the other hand there is the need to prioritise and present results that meet the user’s information need without causing an overload. Internet users pose different challenges to ‘traditional’ Information Retrieval System (IRS) users. Typically, they have shorter queries and their searches can potentially cover a wider range of topics due to the variety of online information, services, and products that are accessible. For example, up to date travel, weather and job hunting, are areas where traditional IRSs usually do not provide necessary information.
While there is a growing body of users of Web search engines, not much is known about them for user modeling purposes. Internet search engine logs do not contain much information about the user and his/her information needs and goals. In addition, these logs are typically rather difficult to obtain. These factors contribute to a general lack of qualitative or quantitative studies for this purpose.
the topic changes across users and then focus on automatically determining session delimiters which mark positions of search topic changes.
Previous research shows that nearly 60% of users had conducted more than one search for the same information problem. The process of repeatedly searching over time in relation to a specific, but possibly evolving information problem is defined as the successive search phenomenon [11]. From our perspective, we hypothesise that a group of sequences of activities are related to each other not only through an evolving information need at a deeper, conceptual level but also through close proximity in time. In fact, Maybury uses temporal information for analysing work patterns of Intranet users (i.e. keystrokes, commands, files accessed/downloaded) [9]. He has used this approach to help identify experts in particular tasks as displayed by their online behaviour.
In this paper we will discuss how we used temporal patterns in users’ search activities as a source for identifying groups of related search activities from chronological data. Subsequently, we compare the results of our automatic method with human judgements and report the types of errors that occur. These results provide a comparison with others’ on Intranet Web search engine logs (Reuters Ltd.).
2. Related Work
Although there have not been an abundance of Web user studies, nevertheless they have tended to cover different aspects of the users’ information seeking and retrieval behaviour.
Studies on Web navigation activities based on logs spanning long periods of time (e.g. weeks or more) indicate that it is very likely that users will visit a web site more than once [1]. This is related to the successive search phenomenon, mentioned earlier, in that repeated accesses to a particular web site may be due to searches on a specific or related information problem. Cooley et al. [2] refer to a timeout to divide page accesses of each user into individual sessions. A timeout is the time between two adjacent activities. Catledge and Pitkow [1] focus on user navigation behaviour and refer to timeout in this context (rather than query activities of Web search engines).
Lawrence and Giles [8] reported on the coverage of various Web search engine services whereas Huberman et al. [4] analysed the pattern of Web surfing by users. Silverstein et al. [10] reported statistics over a large corpus ( Altavista) of unprocessed log data. Lau and Horvitz [7] also analysed (Excite) search engine logs with a view to assigning query refinement classes and information goals. Goker and He [3] reported results based on a search engine (Altavista) used within an Intranet.
3. Learning About the User’s Role and Topics
We argue that there are contextual connections between search activities, if we view the information retrieval process as an interactive problem solving task with a goal. A user with an interest in a specific topic can be said to be acting in a particular role. Hence, it is not unreasonable to assume that the activities in the same session are likely to correspond to one role. We define a session to contain data pertaining to one role and our aim is to identify such a session as accurately as possible.
Studies on Web users and their search patterns provide essential information for user modeling tasks when building intelligent, adaptive IRSs. We focus on search engine logs to identify how many users had topic changes, with what frequency this occurred and the accuracy of automatically generated session cuts.
4. The Data
The data collection used in the experiments was based on Excite
(http://www.excite.com) search engine logs. This set of log file contains 51,474
queries (or more precisely query activities, as defined below) belonging to 18109 users. It covers all search on Excite for 30 minutes starting from midnight on 10 th March 1997. Each log contains the following three fields:
• Time of Day , measured in hours, minutes, and seconds from midnight of 9
March 1997. (This is mm:ss format as the duration is less than one hour).
• User Identification, an anonymous user code assigned by the Excite server.
• Query Terms, as entered by the given user.
An example from the log is as follows:
0709 0006D391330D94BE patton electric
In analysing search engine logs, it is important to clarify the relevant concepts below. These will be referred to later in experiments and results.
Query activities: This refers to search related actions which take place during the course of information retrieval such as making a query, subsequently browsing the pages (scrolling up or down, for example) and providing relevance judgements. The logs do not distinguish clearly between a (original) query and any other query activities. For example, if a particular query occurs twice consecutively, it could be because the same query was input twice by the user or that the user browsed after the original query.
(Time) Interval: This is the time difference between two query activities. Intervals occur between two query activities within the same session or they can occur between activities spanning a session boundary.
Inter-session (cross-session) interval: This refers to the time period between query activities over user sessions. Some of this interval will be time spent on wrapping up/completing the previous query and some will be spent on cognitive preparation for the new query. Broadly speaking, the interval can be described as below (in italics).
Initiate/generate a query activity QueryActivityn-1
Time spent completing (cognitively) the QueryActivityn-1
Time spent switching topics
Time spent preparing (cognitively) the new query activity QueryActivityn
Initiate/generate a query activity QueryActivityn
Our aim is to automatically identify these inter-session time intervals. We distinguish the various cognitive stages that can occur during the interval. However, as we do not have enough information about users to identify the duration of these stages, our session cuts are placed just before the first activity of the new session (where QueryActivitynis generated).
Intra-session (within-session) interval: This refers to the time period between user query activities within the same session. We do not want to place cuts for intra-session intervals, as explained above.
Below are sample query activities for one user. A human judgement on the data has identified the first two query activities (“school uniforms”) to belong to one session whereas the third (“probability” displayed in different font) belongs to a new session.
======== user begin ========
0423 4578362633021D50 school uniforms
<intra-session interval>
0800 4578362633021D50 school uniforms
<inter-session (cross-session) interval>
======== user end ========
5. Experiments
The purpose of the experiments was to analyse the data to identify the frequency of topic changes, and compare automatically generated session boundaries with those based on human judgements. Our experiments involved the following two stages:
a) Manually processing the log to identify session cuts based on human judgements.
5.1 Human Knowledge to Define User Sessions
In order to assess the accuracy of our automatically generated session boundaries, we prepared a version of the Excite logs with session cuts based on a human analysis of the queries.
The logs were grouped so that all query activities belonging to one user were sorted chronologically. The sequence of query activities for each user and the query content was examined in order to determine when a search topic change was likely to have occurred. Ideally, this would have been done in consultation with the user and better knowledge of his/her context of information need. In the absence of the user, however, several steps were taken in order to help reduce the possibility of error. The experts performing the human analysis of the successive queries have had previous experience of detecting session boundaries. Additionally, dictionaries and search engines were employed to check on the possible meaning and usage of query terms where necessary, before deciding on a session boundary.
The advantage of preparing this data set was that we were able to establish a
ground truth for the session boundaries which we then used to compare the results of
the automatic method.
The examples below indicate some of the problems that can arise when deciding session boundaries1. The first example shows that there were four occurences of “pepsi” (in upper or lower case) before the query “NBA.COM”. NBA.COM is the official web-site of the (U.S.) National Basketball Association. It is possible, that the user was looking for Pepsi sponsorship information on the NBA page. However, in the absence of any other query terms indicating a stronger link we have assumed that the last query belongs to a new session.
============user begin=============== 1748 237ACEDD326E2B74 pepsi 2138 237ACEDD326E2B74 PEPSI 2200 237ACEDD326E2B74 PEPSI 2421 237ACEDD326E2B74 PEPSI
"!$#%#%&' (&$")!*,+
============user end===============
In the second example, there is a strong indication that the user was interested in purchasing a VCR online – based on the first two queries. It seems the user explored the use of one term (“VCR”) but then decided to supplement this with further
descriptions relating to the information need. The third query (“ Wierd Stuff”) appears to contain a misspelling. The user could have been referring to “wired” or electrical equipment in which case there could be some sort of connection to the previous queries. Alternatively, it could have been a reference to “weird” things, in which case it seems more likely to be a topic change. In the absence of any further information, we assumed this third query to reflect a change in topic. The last query (“Asians AND Animals”) was also considered to belong to a different topic.
============user begin=============== 0538 6257613C3319DD39 VCR
1132 6257613C3319DD39 VCR On-Line Purchase
!-- ./01324658797
:4;=<?> ;=:=@BAC;?>ED=FGD=D?>EHBIJIKD4H LJMONPRQMSLUT?IVLUQNWXPRYM
============user end===============
In making a judgement about a session boundary, we have erred on the side of caution when grouping query activities together. This is because the grouping of unrelated activities into one session is more damaging for our adaptive- IRS component.
5.2 Automatic Generation of Session Cuts
A sequence of query activities is grouped into a session if and only if
• the activities are from the same User-id, and
• the time interval between two adjacent activities is less than or equal to the current threshold.
However, automatically generating session cuts or boundaries can result in errors. We identify two types of errors: Type A and Type B. These are described below.
Type A: A Type A error occurs when related query activities are allocated to different sessions. In other words, separating search activities when they should be kept together results in this type of error.
Below is an example of a Type A error that arises if we choose a threshold of 1 minute. Hence, a session cut would be generated if an interval is greater than the 1 minute threshold. Otherwise, there would be no cuts.
============user begin=============== 1443 F5DBD5F5329A257B stocks 1459 F5DBD5F5329A257B stocks
- - - -- - - -- - - cut with 1 minute interval 1607 F5DBD5F5329A257B stocks
- - - -- - - -- - - cut with 1 minute interval *************************************************cut based on human judgement 1758 F5DBD5F5329A257B arts
============user end================
The time interval between the first two queries is only 16 seconds which is less than 1 minute, therefore, both queries would get bundled together. The interval between the second and third queries is 1 minute 8 seconds. As this is more than 1 minute, a cut would be generated at this point thereby wrongly separating the third occurrence of “stocks” from the previous two.
should be kept separate results in this type of error. We view this type of error to be more damaging to using the results for the purpose of accurately modeling a user.
Below is an example of a Type B error if we initiate a session cut for an 8 minute threshold.
============user begin=============== 1443 F5DBD5F5329A257B stocks 1459 F5DBD5F5329A257B stocks 1607 F5DBD5F5329A257B stocks
*************************************************cut based on human judgement 1758 F5DBD5F5329A257B arts
============user end================
All time intervals were within 8 minutes so the cut would occur by default at the end of the user session. So, for the above example, all queries for that user would have been bundled together and the topic change from “stocks” to “arts” would have been missed.
6. Results
The results can be grouped into two categories: user topic changes and the accuracy
of automatically generated session cuts . Section 6.1 presents details of the users who
had topic changes and the frequency within which this occurred. Section 6.2 presents the results of comparing the automatic method to human judgements and the errors that may be incurred.
6.1 User Topic Changes
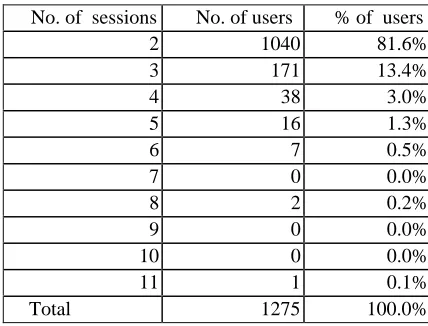
According to our manual analysis of the logs, 7% of users (1275 out of 18109) had a topic change. Most of them (81.6%) had only two distinct sessions -- reflecting seemingly two different topics of search2. Some 13% of users having a context change had three sessions, and only a very small population of users had more than three sessions. However, three or more sessions do not necessarily mean the same number of distinct topics since they can alternate. i.e. one related to topic A the next to topic B and then return to topic A again.
Table 1 and Figure 1 show the number of users with at least one topic change i.e. those having at least two sessions.
No. of sessions No. of users % of users
2 1040 81.6%
3 171 13.4%
4 38 3.0%
5 16 1.3%
6 7 0.5%
7 0 0.0%
8 2 0.2%
9 0 0.0%
10 0 0.0%
11 1 0.1%
Total 1275 100.0%
Table 1. The number and percentage of users with at least two topic groups.
Fig. 1. The distribution of users with two or more session/topic groups.
We looked at the whole data set and the subset containing data for users who had a topic/session change. More specifically, we considered the average number of query activities per session for these two data sets. Some users used only one query in their sessions, others used a number of successive queries. Overall, for the whole log, there were 2.84 queries per user on average (51474/18109). The average number of query activities per user, for the subset of users having a session change, was 5.04
(6427/1275). The average number of query activities per session for these users was 2.22 (6427/2893), based on the fact that there were a total of 2893 sessions involved.
User Topic Groups
0.0% 10.0% 20.0% 30.0% 40.0% 50.0% 60.0% 70.0% 80.0% 90.0% 100.0%
0 1 2 3 4 5 6 7 8 9 10 1112
No. of sessions (topic groups)
Percentageofusers
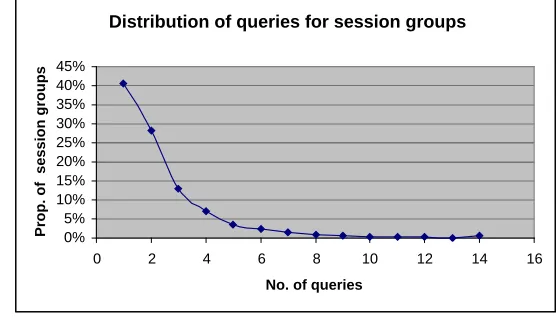
[image:9.595.189.403.159.322.2] [image:9.595.168.419.365.529.2]For those users which had at least one topic change, the average number of sessions was 2.27 (2893/1275). However, these may not necessarily be distinct session or topic groups. Of those users that do have a topic change, most do so once or twice at the most (which accounts for about 70% of changes).
Fig. 2. The distribution of queries for session groups (for users which had a topic change).
6.2 Accuracy of Automatically Generated Session Cuts
Previous research [3] showed that a meaningful session threshold for establishing the session boundaries for the purposes of an adaptive IRS was an 11-15 minute range. This refers to the possible choice of time interval between two query activities. The work was applied to the Reuters Intranet transaction logs from a local version of the Altavista (http://www.altavista.com) search engine.
We have analysed the Excite logs for this purpose and as described in the previous section also had a closer look at users’ topic changes. A small threshold will divide the queries into many groups, while a large threshold will group queries into one session or topic group.
Inter-session Interval Analysis
As mentioned earlier, 1275 users have a session change and totally there are 2893 sessions for these number of users. In order to identify when users with different search topics actually make a shift, we investigate the time intervals between the identified sessions according to the ground-truth. The results are shown in Figure 3.
For example, only 24% (385/1618) of inter-sessions have time intervals of less than or equal to 1 minute. 46% of inter-session intervals are less than or equal to 2 minutes.
Distribution of queries for session groups
0% 5% 10% 15% 20% 25% 30% 35% 40% 45%
0 2 4 6 8 10 12 14 16
No. of queries
[image:10.595.153.432.211.371.2]Fig. 3. Cumulative percentage of inter-session intervals.
Analysis of Type A and Type B errors
Table 2 below shows the number of intra and inter session time intervals for a time span of one minute, according to the ground-truth. Those for 20+ minutes have been grouped together, as previous work indicated the critical point to be within the range of 20 minutes.
Time span, A – B (A>x=<B)
Intra-session Intervals
Inter-session Intervals
0-1 16408 385
1-2 6644 361
2-3 2802 193
3-4 1601 125
4-5 985 97
5-6 698 54
6-7 543 61
7-8 413 47
8-9 352 47
9-10 230 23
10-11 194 31
11-12 166 28
12-13 122 16
13-14 112 18
14-15 95 20
15-16 77 25
16-17 55 20
17-18 63 10
18-19 39 9
19-20 25 10
20-30 123 38
Table 2.The no. of intra and inter session time intervals for time spans until 20mins.
Cumulative percentage of inter-session intervals
0% 20% 40% 60% 80% 100% 120%
0 5 10 15 20 25 30 35
Time interval
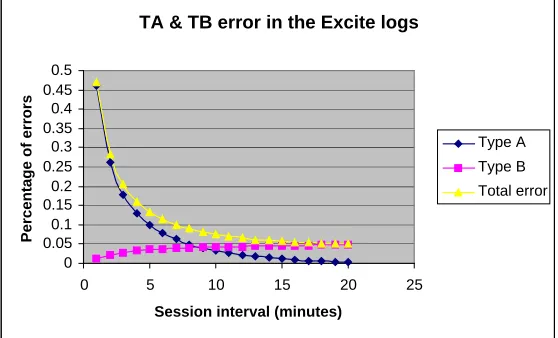
[image:11.595.162.413.124.266.2] [image:11.595.170.425.360.671.2]Figure 4 shows the distribution of the Type A and Type B errors along with their totals for the Excite logs. Figure 5 shows the Type A and Type B errors when giving Type B a higher weight, as we consider this type of error to be more damaging to our application area.
Fig. 4. Type A, Type B and the total errors in the Excite logs.
Fig. 5. The Type A and Type B errors (with Type B having more weight).
According to the above figures, if we consider Type A and Type B to be of equal importance then an interval choice of around 9 minutes is appropriate. If, however, Type B is considered more detrimental to the application (such as in the case of
TA & TB error in the Excite logs
0 0.05 0.1 0.15 0.2 0.25 0.3 0.35 0.4 0.45 0.5
0 5 10 15 20 25
Session interval (minutes)
Percentageoferrors
Type A
Type B
Total error
TA & TB errors with TB having more weight
0 0.05 0.1 0.15 0.2 0.25 0.3 0.35 0.4 0.45 0.5
0 5 10 15 20 25
session interval (minutes)
pecentageoferrors
TA
[image:12.595.152.431.213.382.2] [image:12.595.153.426.433.603.2]applying the results to model users for adaptive information retrieval) then an interval choice of approximately 6 minutes seems more appropriate in this case.
These values are a few minutes less than those found for an Intranet search engine log. This could be due to the difference in the user population or due to the limited time span of the Excite logs. More experiments on Internet search engine logs, preferably with wider time spans, need to be done before more general conclusions can be made. Also, different sources of evidence need to be combined in order to give a more accurately identify session cuts. Currently, we are looking into two further sources of evidence: query search patterns, and query term clustering information.
Conclusion and Future Work
We have presented analyses of a large set of Web search engine log information capturing the search activities of users. We described some key concepts in observing the activities and the time gaps between them with illustrative examples. We then explored the frequency of user topic changes and their distribution. This was followed by an automatic method for determining session cuts when there is a change in search topic. The method used temporal information about user search activities and was later compared to human interpretations of search actions. The results will be used to feed into a learner for an adaptive Web-based IRS.
The strength of the study is based on real Web users’ searches. On the other hand, a weakness is that the Excite logs cover a short time span. This is only a “snap-shot” of server search logs and may not adequately represent users’ behaviour over a longer term.
Our ongoing work focuses on a means of combining evidence from a variety of sources about user search activities in order to further reduce error rates in the session cut method.
References
[1] Catledge L. and Pitkow J.: Characterizing Browsing Strategies in the World-Wide Web. In
3rdInternational World-Wide Web Conference (1995)
http://www.igd.fhg.de/archive/1995_www95/papers/
[2] Cooley R., Mobasher B., and Srivastava J. Data Preparation for Mining World Wide Web Browsing Patterns. Knowledge and Information Systems, 1:5-32, 1999.
[3] Goker A. and He D.: Analysing Web search logs to determine session boundaries for user-oriented learning. Adaptive Hypermedia and Adaptive Web-Based Systems International
Conference (AH2000) . Trento, Italy, 2000. pp. 319-322. In Lecture Notes in Computer
Science 1892. Eds: P. Brusilovsky, O. Stock, and C. Strapparava. Springer-Verlag, 2000. [4] Huberman B.A., Pirolli P., Pitkow J.E., and Lukose R.M. Strong regularities in World
Wide Web surfing. Science, 280 (5360), (1998) 95-97.
[6] Jansen B.J., Spink A., and Saracevic T.: Real life, real users, and real needs: a study and analysis of user queries on the web. Information Processing and Management 36 (2000) 207-227.
[7] Lau T., and Horvitz E.: Patterns of Search: Analyzing and Modeling Web Query Refinement. Proceedings of the Seventh International Conference on User Modelling (UM99), Banff, Canada, June 1999.
[8] Lawrence S., and Giles C.L. Searching the World Wide Web. Science, 280 (5360), (1998) 98-100.
[9] Maybury M. Adaptive Multimedia Information Access. Invited talk: Adaptive Hypermedia and Adaptive Web-Based Systems International Conference (AH2000) . Trento, Italy, 2000.
[10] Silverstein C., Henzinger M., Marais H., and Moricz M. Analysis of a Very Large AltaVista Query Log. Technical Report 1998-014, Digital Systems Research Center, Palo Alto, CA., 1998.