Int. J. Electrochem. Sci., 13 (2018) 785 – 796, doi: 10.20964/2018.01.84
International Journal of
ELECTROCHEMICAL
SCIENCE
www.electrochemsci.orgSimultaneously Detection of Pb
2+and Hg
2+Using
Electrochemically Reduced Graphene Oxide
Suiping Wang1,2,*, Shaolan Zhai1, Yafei Li1, Caitong Zhang1, Zheng Han1, Renfu Peng1, Xu Wang1, Zhengming Lin1, Lizhong Lin3, Yejia Liu3, Xiaodi Mei3, Jian Zhang1,*
1
Hunan College Key Laboratory of Heavy Metal Pollution Control, College of Chemical Engineering, Xiangtan University, Xiangtan 411105, China
2
Collaborative Innovation Center for Efficient and Health Production of Fisheries in Hunan Province, College of Life and Environmental Sciences, Hunan University of Arts and Science, Changde 415000, China
3
Hunan Jinjian Cereals Industry Co ,. Ltd., Changde 415000
*
E-mail: [email protected]
Received: 16 October 2017 / Accepted: 25 November 2017 / Published: 16 December 2017
In this work, graphene oxide (GO) was electrochemically reduced on the surface of glassy carbon electrodes (GCE) to fabricate a sensitive sensor for rapidly simultaneous determination of lead(II) and mercury (II) in water. The electrochemically reduced grahene oxide (ERGO) modified GCE exhibited enhanced analytical performance toward Pb2 +and Hg2+ because of the remarkable surface area, fantastic electrical conductivity and great adsorptive capability of ERGO. The peak currents at about -0.18 V for Cu2+ and 0.08 V for Hg2+ were measured. The concentration of GO, deposition potential and accumulation time was investigated. Under optimum conditions, the limit of detection (LOD) for the ERGO modified GCE (ERGO/GCE) toward Pb2 +and Hg2 + is 0.2 ng/mL and 1 ng/mL respectively, and the linear range of Pb2 +and Hg2 + is 1~1000 ng/mL and 1~1000 ng/mL. The ERGO modified electrode exhibited great repeatability and reproducibility, making it applicable for the fast simultaneous detection of lead (II) and mercury (II) in actual samples.
Keywords: Electrochemically reduced graphene oxide; Pb(II); Hg(II); square wave voltammetry
1. INTRODUCTION
activities of respiratory system, nervous system, urinary system at a certain concentration [3]. Monitoring and measuring mercury and lead is therefore of great importance.
Numerous methods have been developed to detect Hg2+ and Pb2+, such as good anti-interference but time-consuming of atomic absorption spectroscopy (AAS) [4,5], novel but high cost of inductively coupled plasma optical emission spectrometry (ICP-OES) [6], low LOD but complex operating of atomic emission spectroscopy (AES) [7], and highly sensitive but time-consuming of inductively coupled plasma atomic mass spectrometry (ICP-MS) [8]. Compared with these different methods, ASV has many advantages such as low cost of the instruments, time-saving processing of samples, easy to operate and so on [9-11]. ASV has been proved to be a fast and efficient technology for the detection of the lead (II) and mercury (II) [12]. Its sensitivity is attributed to a pre-accumulation process in which metal ions in solution are reduced by a controlled potential and the reduced metal is coated onto the GCE. After the accumulation, the reduced metal is stripped anodically and the peak current is appeared. Therefore, heavy metal ions can be quantitatively analyzed by the height of the peak current [13].
Graphene is a 2D crystalline sheet of carbon atoms with unique physical natures. For example, graphene has extraordinary electrical conductivity, unexceptionable mechanical strength, strong adsorptive capability, huge surface to volume ratio, and favorable biocompatibility [14, 15]. Because of its unique nanostructure and excellent properties, explosion interests are generated in many fields including photocatalysts, energy storage and biosensors using graphene as the basic building block [16]. Graphene has the characteristics of large adsorption capacity and high adsorption efficiency. Graphene sheet is composed of countless single surface atoms, so the graphene layer would be very sensitive if molecule interaction or electron transfer occurs [17, 18]. Khomyakov et al evidenced that the modified electrode is very sensitive to the electron transfer between graphene and metal ions [19]. There are many methods for the synthesis of graphene, such as mechanical exfoliation of graphite[20], epitaxial growth [21], and chemical reduction of GO [22]. Among these methods, the mechanical stripping method is low yield and high cost; the application of epitaxial growth is limited because it requires high temperature or ultra-high vacuum conditions [23]; the chemical reduction of GO is carried out with excessive reducing agents such as sulfur-containing compounds [24], NaBH4 [25],
hydrazine [26], L-ascorbic [27] and hydrohalic acids [28], which would contaminate the product, and the oxygenic groups can’t be completely removed by chemical treatment, which could degrade the conductivity of the product and further limit the application. Recently, electrochemical reduction of GO to graphene has aroused great concern because of its fast and environmental nature. ERGO is a promising material in super-capacitors, batteries, biosensors and other fields [29, 30].
2. EXPERIMENTAL
2.1. Reagents and apparatus
Graphite (SP), potassium chloride (AR), potassium permanganate (AR), hydrogen peroxide (30%, AR), and sodium nitrate (AR) were purchased from Sinopharm Chemical Reagent Co., Ltd. (China). Ethanol (AR), sulfuric acid (98%, AR) and hydrochloric acid (37%, AR) were purchased from Zhuzhou Star Glass Co. Ltd. The stock standard solutions of 1mg/ml of lead (ІΙ) and mercury (ІΙ) was provided by National Analysis and Testing Center for Nonferrous Metals and Electronic Materials. Analytical-grade HCl (0.1 M) were used to adjust the pH value of the 0.1 M KCl. All reagents are of analytical-grade and need no further treatment. The deionized water (18.2 MΩ cm) was used to prepare all solutions.
A CHI 660D electrochemical workstation (Shanghai CH Instruments Co., China) was used for all electrochemical measurements with a conventional three-electrode system, containing a working GCE, a saturated calomel reference electrode (SCE) and a platinum counter electrode. All potentials throughout experiments were versus SCE. Scanning electron microscopy (SEM) analysis was carried out on a JSM-6610LV microscope (JEOL, Ltd., Japan).
2.2. Preparation of GO
GO was synthesized from graphite powder following the modified Hummers method [31, 32]. The graphite powder (0.5 g) and NaNO3 (0.5g) was put into concentrated H2SO4 (23 mL), under
stirring in an ice water bath. Next, KMnO4 (3 g) was gently added to the solution with stirring and
cooling. The mixture was raised to a 35±5°C and magnetically stirred for about 1 h. Next, deionized water (40mL) was added, and the suspension was stirred for another 30 min at 90±5 ° C. Then, deionized water (100 mL) was added, whereafter, H2O2 (3 mL) was slowly added. The reaction was
terminated with the suspension color changed from dark-brown to yellow. The mixture solution was then filtered and washed with a large amount of deionized water (100 mL) to remove metal ions. The paste collected from the filter paper was dispersed in deionized water by magnetic stirring. The resulting dispersion was repeatedly centrifuged at 1000 rpm until there is no sediment. The supernatant was centrifuged at 8000 rpm for 15 minutes (more than twice) to remove unexfoliated GO. The final precipitates was dried in vacuum at 50 °C over 24 h and redispersed in water to obtain a solution of exfoliated GO.
2.3. Fabrication of the ERGO/GCE
temperature. To get the ERGO/GCE, the air-dried GO/GCE was immersed in 0.5 M NaCl solution and scanned at a potential of -1.3 V for 300 s using the method of chronoamperometry [23,28].
2.4. Electrochemical measurement
Pband Hgwere firstly accumulated at -1.0 V for 240 s for the reduction of Pb2+ and Hg2+ in 0.1 M KCl (pH = 3.0). Then, the electrodeposited metal was stripped anodically at the following conditions: frequency, 15 Hz; amplitude, 25 mV; potential range, -1.0 to 0.5 V; increment potential, 4 mV.
3. RESULT AND DISCUSSION
3.1. Characterization of ERGO
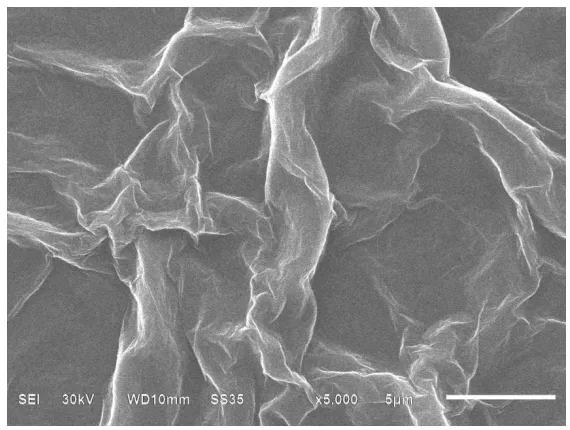
[image:4.596.155.440.389.604.2]The morphology and structure of the ERGO were characterized by SEM. In figure 1, we can see that the ERGO exhibits a distinct flaky morphology with slight wrinkles on the surface, as described previously [33].
Figure 1.SEM image of ERGO
3.2. Electrochemistry characterization of the ERGO/GCE
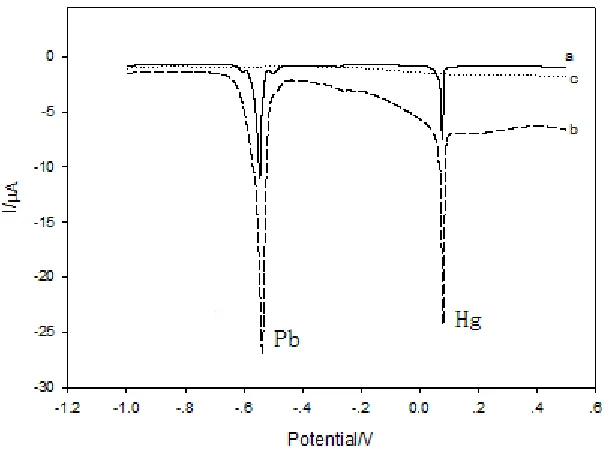
Figure 2 shows the SWASV map of bare GCE (a) and ERGO/GCE (b) in 0.1 M KCl (pH = 3) containing 1 μg/mL Pb2+
dissolution peak of lead and mercury. Compared with the bare GCE, the stripping peak current has a noticeable increase at ERGO/GCE. The ERGO modified electrode (b) has remarkable improved stripping peak of lead and mercury, indicating that high sensitivity toward Pb2+ and Hg2+can be obtained on the ERGO/GCE. The main reason is due to ERGO increasing the active sites of the electrode surface, promoting the rate of electron-transfer, and thus improving the electrochemical performance of the GCE.
Figure 2. SWASV responses of bare GCE (a), and ERGO/GCE (b) containing 1 μg/mL Pb2+ and 1 μg/mL Hg2+
and the blank experiment of ERGO/GCE (c). The accumulation process was performed under the potential of -1.0 V with a preconcentration time of 240 s. SWASV was performed in 0.1 M KCl (pH = 3.0) at the following conditions: voltage range, -1.0 to 0.5 V; frequency, 15 Hz; amplitude, 25 mV; increment potential, 4 mV.
3.3. Optimization of the electrochemical measurement
The concentration of GO, deposition potential and accumulation time are the key factors of SWASV analysis. Here, the concentration of GO, the deposition potential and accumulation time were optimized by respectively detecting the solution containing 1 μg/mL Pb2 +
and 1 μg/mL Hg2 +.
As can be seen in figure 3, the stripping peak current gradually increased when the concentration of GO increased from 0.05 mg/mL to 0.1 mg/mL. Then, the peak current quickly decreased as the concentration of GO increased to 0.5 mg/mL. It may be attributed to the thick film of graphene hampering the electrical conductivity. Thus, the concentration of GO at 0.1 mg/ml is considered to be the optimal concentration of GO for the determination of Pb2+ and Hg2+.
[image:5.596.143.447.190.416.2]
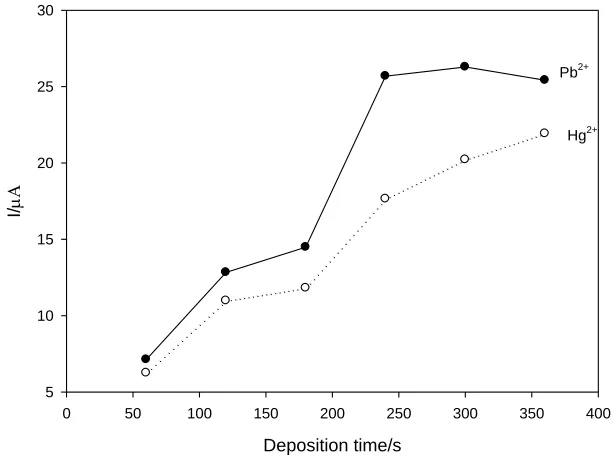
accumulation time and then increases relatively slow over 240 s. To shorten the analysis time, 240 s was chosen as the optimal accumulation time.
Graphene concentration mg/mL
0.0 .1 .2 .3 .4 .5 .6
I/
0 2 4 6 8 10 12 14 16
Pb2+
[image:6.596.154.440.125.340.2]Hg2+
Figure 3. Effect of the concentration of GO on the stripping peak current response of Pb2+ and Hg2+. The concentration of Pb2+and Hg2+ is 1 μg/mL.
Deposition time/s
0 50 100 150 200 250 300 350 400
I/
5 10 15 20 25 30
Pb2+
Hg2+
Figure 4. Effect of accumulation time on the stripping peak current response of Pb2+ and Hg2+. The concentration of Pb2 +and Hg2 + is 1 μg/mL.
[image:6.596.145.451.414.643.2]
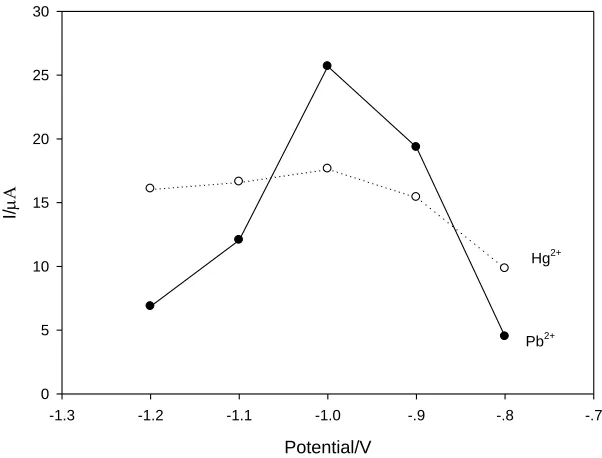
relatively steady plateau when the deposition potential increases from −1.0 V to −1.2 V. Therefore, an optimum deposition potential of −1.0 V is selected for all the subsequent work.
Potential/V
-1.3 -1.2 -1.1 -1.0 -.9 -.8 -.7
I/
0 5 10 15 20 25 30
Pb2+
[image:7.596.139.440.119.348.2]Hg2+
Figure 5. Effect of deposition potential on the stripping peak current response of Pb2+ and Hg2+. The concentration of Pb2 + and Hg2 + is 1 μg/mL.
3.4. Analytical performance of the ERGO modified electrode
Under the optimal operating conditions, the ERGO/GCE was applied for the detection of Pb2 + and Hg2 + using SWASV. The plot of stripping peak currents versus the Pb2+ concentrations is shown in fig. 6a. The linear response range of the ERGO/GCE to Pb2 + is from 1 ng/mL to 1 μg/mL. A LOD of 0.2 ng/mL was obtained (S/N=3).
Concentration of Pb2+/(g/mL)
0.0 .2 .4 .6 .8 1.0 1.2
I/
0 5 10 15 20 25 30
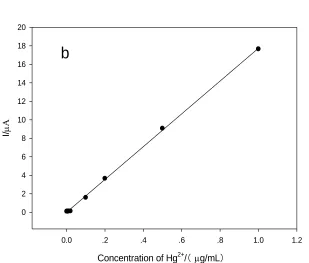
Concentration of Hg2+/(g/mL)
0.0 .2 .4 .6 .8 1.0 1.2
I/
0 2 4 6 8 10 12 14 16 18 20
[image:8.596.143.452.73.336.2]b
Figure 6. The calibration curve of stripping peak current versus the concentration of Pb2+ (a) and Hg2+ (b) under the optimal conditions (concentration of GO: 0.1 mg/mL; deposition potential: −1.0 V; accumulation time: 240s).
The linear equations is y=25.4x+0.03. The linear correlation coefficient is 0.9992. The map of stripping peak currents versus the Hg2+ concentrations is shown in fig. 6b. The calibration curve showed that the linear response range of the ERGO/GCE to Hg2+ is from 1 ng/mL to 1 μg/mL. The LOD of 1 ng/mL was obtained (S/N=3). The linear equations is y=17.864x-0.1009. The linear correlation coefficient is 0.9984.
The influence effect of other heavy metal ions Cd2+, As3+ and Cu2+ on the determination of Pb2
+
and Hg2 + was investigated. SWASV responses of 1 μg/mL Pb2 + and 1 μg/mL Hg2+ in the presence of 1 μg/mL Cd2+
, As3+ or Cu2+ were investigated on the ERGO/GCE in 0.1 M KCl (pH = 3) after preconcentration at -1.0 V for 300 s. We find that Cd2+, As3+ and Cu2+ will produce interference for the detection of Pb2+ and Hg2+. This question will be further studied in our future work.
In order to investigate the reproducibility of the sensor, six ERGO modified GCE were used to measure 1 μg/mL Pb2 +
and Hg2 +, the relative standard deviations (RSD) were 4.14% and 4.94% (n = 6), demonstrating that the sensor has a good reproducibility.
In order to investigate the repeatability of the sensor, the same ERGO modified GCE was used to measure 1 μg/mL Pb2 +
3.5. Analysis of real sample
[image:9.596.37.563.222.311.2]For the purpose of testing the practical use of the electrode, we have carried out the recovery experiments of the real water samples (tap water, water of Huamei Lake). The known amount of Pb2 + and Hg2 +were added in real water samples. The results are shown in table 1. The recoveries obtained are from 91% to 101%, which reveals that the proposed sensor has good practicability.
Table 1. The recovery experiments of spiked samples
Real Sample Ion found(μg/mL
)
added(
μg/mL) Total(μg/mL)
Recovery(%
)
Tap water Hg
2 +
0 1.00 0.92 92
Pb2 + 0 1.00 1.01 101
Lake of huamei Hg
2 +
0 1.00 0.91 91
Pb2 + 0 1.00 0.93 93
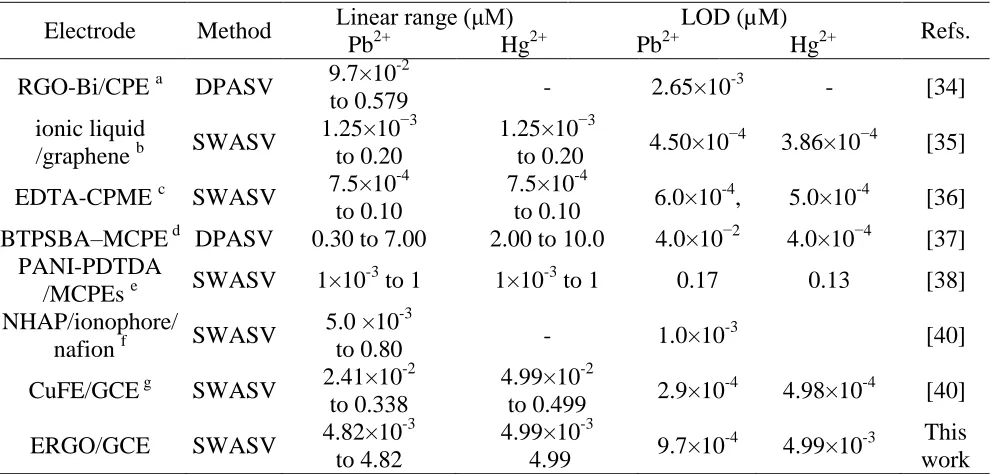
Table 2. Comparison of the different modified electrodes for the determination of Hg2+ and Pb2+.
Electrode Method Linear range (μM) LOD (µM) Refs.
Pb2+ Hg2+ Pb2+ Hg2+ RGO-Bi/CPE a DPASV 9.7×10
-2
to 0.579 - 2.65×10
-3
- [34]
ionic liquid
/graphene b SWASV
1.25×10⁻³ to 0.20
1.25×10⁻³
to 0.20 4.50×10
−4
3.86×10⁻⁴ [35] EDTA-CPME c SWASV 7.5×10
-4
to 0.10
7.5×10⁻⁴
to 0.10 6.0×10
-4
, 5.0×10⁻⁴ [36] BTPSBA–MCPE d DPASV 0.30 to 7.00 2.00 to 10.0 4.0×10⁻² 4.0×10⁻⁴ [37]
PANI-PDTDA
/MCPEs e SWASV 1×10
-3
to 1 1×10⁻³ to 1 0.17 0.13 [38]
NHAP/ionophore/
nafion f SWASV
5.0 ×10⁻³
to 0.80 - 1.0×10
-3
[40] CuFE/GCE g SWASV 2.41×10
-2
to 0.338
4.99×10⁻²
to 0.499 2.9×10
-4
4.98×10⁻⁴ [40]
ERGO/GCE SWASV 4.82×10
-3
to 4.82
4.99×10⁻³
4.99 9.7×10
-4
4.99×10⁻³ This work
a
Composites of bismuth and reduced graphene oxide modified carbon paste electrode
b
graphene, 1-n-octylpyridinum hexafluorophosphate (OPFP), and [2,4-Cl2C6H3C(O)CHPPh3]
(L) modified electrode
c
EDTA bonded conducting polymer modified electrode
d
organofunctionalised SBA-15 silica modified carbon paste electrode
e
polyaniline-poly(2,2′-dithiodianiline) (PANI-PDTDA) modified carbon paste sensor
f
nanosized hydroxyapatite, ionophore and nafion modified electrode
g
[image:9.596.53.550.369.606.2]
Graphene-based material is a promising material for the detection of heavy metals. Chemical synthesis of graphene and graphene composites were used to detect heavy metal ions in most of the previous literatures [34, 35]. For instance, Sahoo et al. reported a Cd2+, Pb2+, Zn2+ and Cu2+ sensor based on chemistry reduced graphene oxide-Bi nanocomposites. Li et al. reported a Pb2+ and Cd2+ sensor based on chemistry reduced graphene-nafion composites. In our study, electrochemical reduction graphene oxide instead of graphene composite is used. Compared with chemical synthesis methods, electrochemical method reducing graphene oxide offers several advantages, including green, efficient, inexpensive, and rapid. Furthermore, we compared the linear range and LOD of the proposed sensor with the previously reported graphene-based lead sensors. For example, the linear range is much wider and the LOD is much lower than the Pb2+ sensor based on chemistry reduced graphene oxide-Bi nanocomposites [34]. Although the LOD of Hg2+ on ERGO/GCE are a little higher than that of the ionic liquid/graphene [35], but a lower LOD for Pb2+ can be obtained. Compared with the aforementioned sensors, the present ERGO modified GCE owns a superior comprehensive performance in detection range and LOD. The wider linear range and lower LOD may be due to the huge specific surface area, strong adsorption ability and excellent catalytic of ERGO.
Table 2 shows the comparison of the proposed sensor in this work with the other previously reported Pb2+ and Hg2+ sensors [34-40]. As can be seen, the developed method in this work shows a relatively wide linear range and a low LOD.
4. CONCLUSIONS
In summary, the electrochemical method was used to directly reduce GO, which is fast, clean, and nondestructive and the ERGO/GCE have been successfully prepared for rapidly simultaneous determination of Pb2 +and Hg2 +. The ERGO exhibits strong adsorptive capability, huge specific surface area and good conductivity, which can significantly enhance the electrochemical performance of the sensor toward Pb2+and Hg2+. The prepared sensor exhibits outstanding detection sensitivity with the LOD of 0.2 ng/mL for Pb2+and 1 ng/mL for Hg2+. The ERGO/GCE also showed excellent stability and favorable reusability. The proposed electrode will provide qualitative and quantitative detection of heavy metal ions in environmental, industrial, biological, agricultural and medical samples.
ACKNOWLEDGEMENTS
References
1. G. Aragay, J. Pons and A. Merkoci, Chem. Rev., 111 (2011) 3433. 2. S. K. Hall, Environ. Sci. Technol., 6 (1972) 30.
3. X. Cheng, J. Li, X. Li, D. Zhang, H. Zhang, A. Zhang, H. Huang and J. Lian, J. Mater. Chem., 22 (2012) 24102.
4. D. I. Bannon and J. J. Chisolm, Clin. Chem., 47 (2001) 1703. 5. P. Pohl, Trac-trend Anal. Chem., 28 (2009) 117.
6. T. M. Mendes, S. N. Baccan and S. Cadore, J. Brazil. Chem. Soc., 17 (2006) 168.
7. E. Pehlivan, G. Arslan, F. Gode, T. Altun and M. Musa Özcan, Grasas Aceites, 59 (2008) 239. 8. H. Cheng, C. Wu, J. Liu and Z. Xu, Rsc Adv., 5(2015) 19082.
9. J. Gong, T. Zhou, D. Song and L. Zhang, Sensor Actuat. B: chem., 150 (2010) 491. 10.S. Xiong, B. Yang, D. Cai, G. Qiu and Z. Wu, Electrochim. Acta, 185 (2015) 52.
11.Y. F. Sun, W.K. Chen, W. J. Li, T. J. Jiang, J. H. Liu and Z. G. Liu, J. Electroanal. Chem., 97 (2014) 714
12.P. Brezonik, P. A. Brauner and W. Stumm, Water Res., 10 (1976) 605. 13.W. D. Ellis, J. Chem. Educ., 50 (1973) 131.
14.A. A. Balandin, Nat. Mater., 10 (2011) 569.
15.M. F. Craciun, S. Russo, M. Yamamoto and S. Tarucha, Nano. Today, 6 (2011) 42. 16.M. J. Allen, V. C. Tung and R. B. Kaner, Chem. Rev., 110 (2009) 132.
17.A. Rochefort and J. D. Wuest, Langmuir, 25 (2008) 210.
18.L. L. Luo, X. X. Gu, J. Wu, S. X. Zhong and J. R. Adv. Mater. Res., 550 (2012) 2121.
19.P. A. Khomyakov, G. Giovannetti, P. C. Rusu, G. Brocks, J. van den Brink and P. J. Kelly, Phys. Rev. B, 79 (2009) 195425.
20.Y. Hernandez, V. Nicolosi, M. Lotya, F. M. Blighe, Z. Sun, S. De and J. J. Boland, Nat. nanotechnol., 3(2008) 563.
21.H. Chen, W. Zhu and Z. Zhang, Phys. Rev. Lett., 104 (2010) 186101.
22.S. Stankovich, D. A. Dikin, G. H. Dommett, K. M. Kohlhaas, E. J. Zimney, E. A. Stach, R. D. Piner, S. T. Nguyen and R. S. Ruoff, Nature, 442 (2006) 282.
23.Z.Wang, X. Zhou, J. Zhang, F. Boey and H. Zhang, J. Phys. Chem .C,113 (2009) 14071. 24.W. Chen, L. Yan and P. R. Bangal, J. Phy. Chem. C, 114 (2010) 19885.
25.M. Kim, Y. Hwang and J. Kim, J. Power Sources, 239 (2013)225.
26.S. Park, J. An, J. R. Potts, A. Velamakanni, S. Murali and R. S. Ruoff, (2011). Carbon, 49 (9), 3019.
27.J. Zhang, H. Yang, G. Shen, P. Cheng, J. Zhang and S. Guo, Chem. Commun., 46 (2010) 1112. 28.S. Pei, J. Zhao, J. Du, Ren and H. M. Cheng, Carbon, 48 (2010) 4466.
29.A. Al Nafiey, A. Addad, B. Sieber, G. Chastanet, A. Barras, S. Szunerits and R. Boukherroub, Chem. Eng. J. 322 (2017) 375.
30.Z. Tian, H. Wang, X. Tian, W. Huang and C. Xiao, Compos. Part A-Appl. S. 94(2017) 41. 31.W. S. Hummers Jr and R. E. Offeman, J. Am. Chem. Soc., 80 (1958) 1339.
32.L. J. Cote, F. Kim and J. Huang, J. Am .Chem .Soc., 131 (2008) 1043. 33.A. K. Geim, science, 324 (2009) 1530.
34.P. Sahoo, B. Panigrahy, S. Sahoo, A. K. Satpati, D. Li and D. Bahadur, Biosens. Bioelectron.,43 (2013) 293.
35.H. Bagheri, A. Afkhami, H. Khoshsafar, M. Rezaei, S. J. Sabounchei and M. Sarlakifar, Anal. Chim. Acta, 870 (2015) 56.
36.M. A. Rahman, M. S. Won and Y. B. Shim, Anal. Chem., 75 (2003) 1123.
40.V. Jovanovski, N. Hrastnik and S. Hočevar, Electrochem. Commun., 57 (2015) 1.