Int. J. Electrochem. Sci., 12 (2017) 11006 – 11016, doi: 10.20964/2017.10.53
International Journal of
ELECTROCHEMICAL
SCIENCE
www.electrochemsci.org
Short Communication
Effect of SiC Particles on the Corrosion Behaviour of 6.5%
SiC
p/Al-Cu-Mg-Zn Composites
Xiaohong Wang*, Zhengwei Peng, Lai Ma, Yuanhua Lin**, GaoxuLi, Wang Hailun
College of Materials Science and Engineering, Southwest Petroleum University, Chengdu 610500, China
*
E-mail: [email protected] **
E-mail: [email protected]
Received: 3 May 2017 / Accepted: 8 August 2017 / Published: 12 October 2017
This study investigated the microstructure and phase composition of 6.5% SiCp/Al-Cu-Mg-Zn composites and Al-Cu-Mg-Zn alloy and measured their corrosion rates, pitting densities and maximum pit depths in 3.5 wt.% NaCl solution. Additionally, the effect of SiC particles on the microstructure and corrosion behaviour of Al-Cu-Mg-Zn alloy is discussed in detail. The results showed that the corrosion rate of 6.5% SiCp/Al-Cu-Mg-Zn composites was less than that of Al-Cu-Mg-Zn in 3.5 wt.% NaCl solution at 20 ℃, 60 ℃ and 90 ℃. The pitting density of 6.5% SiCp/Al-Cu-Mg-Zn composites was less than that of Al-Cu-Mg-Zn alloy, and the maximum pit depth of 6.5% SiCp/Al-Cu-Mg-Zn composites (approximately 360 μm in 3.5 wt.% NaCl solution at 120 ℃) was smaller than that of Al-Cu-Mg-Zn alloy. The pitting power of the 6.5% SiCp/Al-Cu-Mg-Zn composites was less than that of Al-Cu-Mg-Zn alloy because precipitated S(Al2CuMg) and T(AlZnMgCu) were inhibited, and θ(CuAl2) was refined due to the addition of SiC.
Keywords: SiC Particles, Corrosion Behaviour, Drilling Pipe, Aluminium matrix composite 1. INTRODUCTION
With the development of drilling technology, deep well, super-deep well, sour oil and gas well techniques have become increasingly important in petroleum engineering. Aluminium alloys are the most promising alternative to steel in these drilling techniques because they are lightweight and have good corrosion resistance in acidic media. However, poor wear resistance and low strength hamper the applications of aluminium alloys [1]. Babu et al. [2] and Ko et al. [3] have found that adding SiC particulates to aluminium alloys can greatly increase strength and wear resistance.
and SiC is another hot research topic in Al-based composites reinforced with SiC. Pai et al. [8] noted that the Si concentration in the matrix increases due to the interfacial reaction. The work of Park et al. [9] showed that the SiC reinforcements in the composites have poor corrosion resistance in aqueous media due to the instability of Al4C3 in such environments. In most of the reported studies, the corrosion behaviour of Al-based composites reinforced with SiC was not based on the condition of the drilling and did not consider the effect of the pre-treated SiC on the interfacial reaction.
SiC particulate-reinforced aluminium matrix composites used for drilling pipes have been manufactured by a novel processing route in our laboratory. A previous study on these composites showed that the wear rate of sliding wear and dynamic load impact was reduced by 80% and 17.6% respectively, compared with those of matrix alloy [10]. To further examine the usability of these composites for drilling pipe, the present study investigated the corrosion resistance of the aluminium matrix composites under the working conditions of the drill pipe based on the ISO 15546:2011 standard. This research increases the understanding of the corrosion mechanism of the composites, which allows for the optimization of the composite’s composition and manufacturing process.
2. EXPERIMENTAL 2.1 Materials
The materials used in this experiment were 6.5% SiCP/Al-Cu-Mg-Zn composites manufactured by a novel process and Al-Cu-Mg-Zn alloy. The chemical compositions are shown in table 1 [11-12].
Table 1. The composition of 6.5% SiCp/Al-Cu-Mg-Zn composites and Al-Cu-Mg-Zn alloy manufactured by vacuum-cast (wt.%)
Material Cu Mg Zn Fe Mn Cr Ca Zr Si Al
Composites 2.04 1.07 0.52 0.22 0.15 0.08 0.08 0.06 6.05 Balance Al-Cu-Mg-Zn 2.43 1.18 0.64 0.20 0.19 0.05 0.11 0.11 0.28 Balance
2.2 Methods 2.2.1 Weight Loss
The corrosion behaviours of 6.5% SiCp/Al-Cu-Mg-Zn composites and Al-Cu-Mg-Zn alloy (30 mm x 10 mm x 3 mm) were evaluated by immersing the samples in 3.5% NaCl solution at 20 ℃, 60 ℃, and 90 ℃ for 72 h. The weight loss rates of the two different materials were calculated from the weight loss per unit time and per unit area.
2.2.2 Electrochemical Method
electrode. A platinum electrode was used as the auxiliary electrode, and a calomel electrode was used as the reference electrode. The electrochemical tests were conducted using a PGSTA T302 electrochemical workstation at the scan rate of 1 mV/s from -1200 mV to -300 mV.
2.3 Pitting Corrosion
The pitting corrosion behaviours of 6.5% SiCp/Al-Cu-Mg-Zn composites and Al-Cu-Mg-Zn alloy (30 mm x 10 mm x 3 mm) were evaluated by immersing the samples in 3.5% NaCl solution at 120 ℃ for 216 h.
2.4 Stress Corrosion Crack
The stress corrosions of 6.5% SiCp/Al-Cu-Mg-Zn composites and Al-Cu-Mg-Zn alloy were carried out according to GB/T 15970.2-2000. All the specimens were made from sheet metal at 0° in the extruded direction, and the sample size was 100 mm x 20 mm x 3 mm. Prior to the stress corrosion crack (SCC) tests, all of the specimens were polished using successive grades of emery paper from 240 mesh to 2000 mesh. Each sample was preloaded up to 100% of the ultimate tensile static strength by means of the device, which was packed by the insulation in order to avoid galvanic corrosion. Then, it was immersed in a 3.5% NaCl solution at 90 °C for 50 days.
2.5 Surface Studies 2.5.1 Optical Microscope
The surface morphologies and pitting densities of the pitting corrosion specimens were examined using an XJG-05 optical microscope (OM).
2.5.2 Camera
The surface morphologies of the stress corrosion crack specimens were examined using a Canon 700D camera.
2.5.2 X-ray
The pitting corrosion extents of 6.5% SiCp/Al-Cu-Mg-Zn composites and Al-Cu-Mg-Zn alloy were characterized by the maximal depth of the pits, which were evaluated by an X-ray CT (Nikon Metrology XT H225 in University of Leicester). The resolution of each CT image was 1918 x 861 x 1384, and the pixel length was 12.7 µm. The X-ray tube voltage, current and exposure time were 190 kV, 105 µA and 1415 ms, respectively.
2.5.3 Scanning Electron Microscopy
The microstructures and corroded surfaces of these test samples were analysed using a TESCAN VEGA II and ZEISS scanning electron microscope (SEM) with an Oxford INCA Energy 350 energy dispersive X-ray spectrometer (EDS).
3. RESULTS AND DISCUSSION 3.1 Corrosion rate
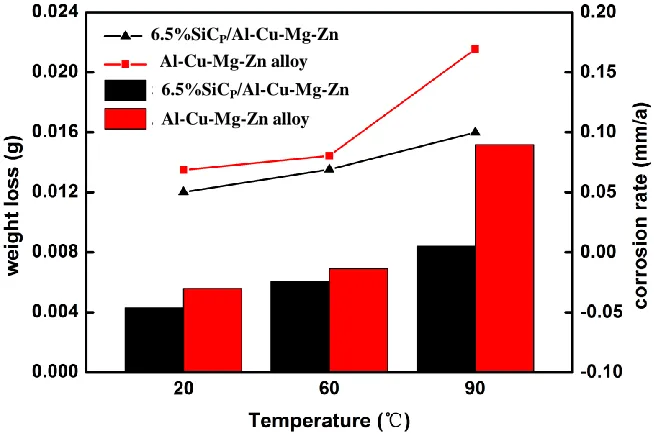
Fig. 1 shows the mass loss and corrosion rates of 6.5% SiCP/Mg composites and Al-Cu-Mg alloy immersed in 3.5 wt.% NaCl solution at different temperatures for 72 h. It can be seen that the mass loss and corrosion rates of the two materials increase with an increase of temperature. The mass loss and corrosion rate of 6.5% SiCP/Al-Cu-Mg composites are lower than those of Al-Cu-Mg alloy at the same solution temperature. When the temperature reached 90 ℃, the mass loss and corrosion rate of 6.5% SiCP/Al-Cu-Mg composites decreased by 75% compared with that of Al-Cu-Mg-Zn alloy.
Figure 1. Comparison of mass loss and corrosion rate of 6.5 wt.% SiCp/Zn and Al-Cu-Mg-Zn after immersion in 3.5 wt.% NaCl solution for 72 hours (Bar graph for mass loss, broken line graph for corrosion rate)
3.2 The pitting corrosion behaviour
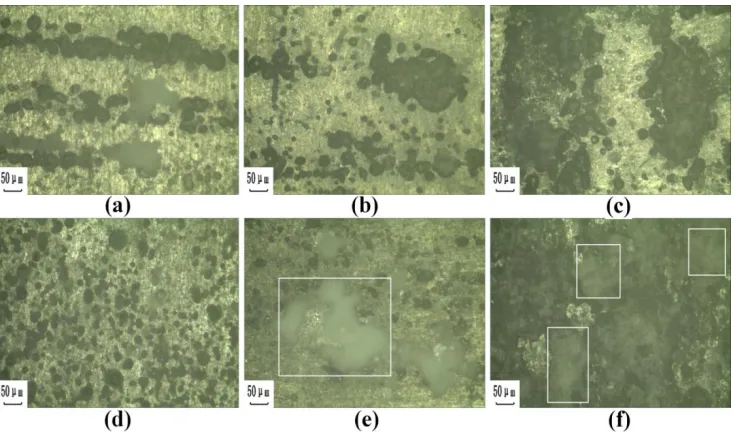
Fig. 2 shows the surface morphologies of 6.5% SiCP/Zn composites and Al-Cu-Mg-Zn alloy immersed in 3.5 wt.% NaCl solution at 120 ℃. The pitting corrosion of the two materials is apparent, and the pitting density increases with an increase in the immersion time. For the same
Al-Cu-Mg-Zn alloy 6.5%SiCP/Al-Cu-Mg-Zn
6.5%SiCP/Al-Cu-Mg-Zn
Al-Cu-Mg-Zn alloy
[image:4.596.135.462.378.595.2]
immersion time, the pitting density of the composites is lower than that of the Al-Cu-Mg-Zn alloy. The Al-Cu-Mg-Zn alloy has a local fuzzy region after immersion of 144 h, indicating that there are deep pits in the local area. When the immersion time is 216 h, the local fuzzy region of Al-Cu-Mg-Zn alloy is further increased. The depth of the pits in the Al-Cu-Mg-Zn alloy is clearly deeper than that of the 6.5% SiCP/Al-Cu-Mg-Zn composites. There are still no blurred areas in the composites at 216 h, indicating that the depth of pits of 6.5% SiCP/Al-Cu-Mg-Zn composites is shallow.
Figure 2. Surface morphology of 6.5% SiCp/Al-Cu-Mg-Zn composites and Al-Cu-Mg-Zn alloy in 3.5 wt.% NaCl solution at 120 ℃ (6.5% SiCp/Al-Cu-Mg-Zn composites: (a) 72 h (b) 144 h (c) 216 h; Al-Cu-Mg-Zn alloy: (d) 72 h (e) 144 h (f) 216 h)
Figure 3. Maximum pitting depths of 6.5% SiCp/Al-Cu-Mg-Zn composites and Al-Cu-Mg-Zn alloy after immersion in 3.5 wt.% NaCl solution at 120 °C
Fig. 3 shows the maximum pitting depths of the two materials immersed in solution of 3.5 wt.% NaCl at 120 ℃ for 72 h, 144 h, and 216 h when tested in X-ray CT scanners. It can be seen from
6.5% SiCP/Al-Cu-Mg-Zn
[image:5.596.116.483.198.414.2] [image:5.596.169.426.497.673.2]
Fig. 3 that the maximum pitting depths of the two materials increase with increasing immersion time. Under the three different immersion times, the maximum pit depth of the Al-Cu-Mg-Zn alloy is deeper than that of 6.5% SiCP/Al-Cu-Mg-Zn composites. When the immersion time is 216 h, the maximum pit depth of 6.5% SiCP/Mg-Zn composites is approximately 360 μm shallower than that of Al-Cu-Mg-Zn alloy. Therefore, the pitting corrosion resistance of 6.5% SiCP/Al-Cu-Al-Cu-Mg-Zn composites in 3.5 wt.% NaCl solution at 120 ℃ is better than that of Al-Cu-Mg-Zn alloy.
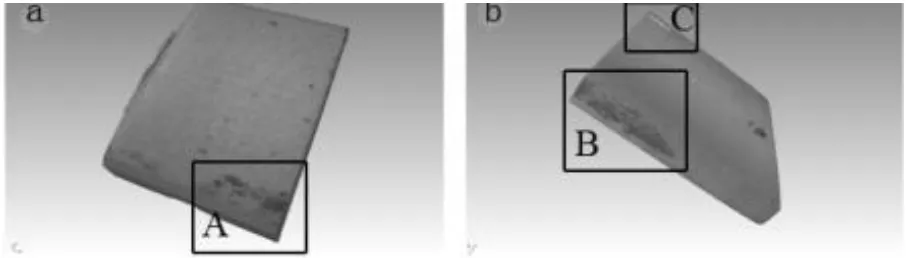
Fig. 4 shows the 3D morphologies of 6.5% SiCp/Al-Cu-Mg-Zn composites and Al-Cu-Mg-Zn alloy after immersion in 3.5% NaCl solution at 120 °C for 216 h. Two very deep pitting corrosion pits can be seen in the Al-Cu-Mg-Zn alloy, as shown in Fig. 4b (part B and C). Fig. 4 is further evidence that the pitting corrosion of the Al-Cu-Mg-Zn alloy is more serious than the 6.5% SiCp/Al-Cu-Mg-Zn composites.
Figure 4. Images of 6.5% SiCp/Al-Cu-Mg-Zn composites and Al-Cu-Mg-Zn alloy immersed in 3.5% NaCl solution at 120 °C for 216 h by CT; a 6.5% SiCp/Zn composites; b Al-Cu-Mg-Zn alloy
The effect of SiC on the Al-Cu-Mg-Zn alloy pitting corrosion is very complicated and controversial. One researcher noted that the pitting is often found along the extrusion texture and that adding SiC will weaken the texture of Al-Cu-Mg-Zn alloy [13]. That is why the 6.5% SiCp/Al-Cu-Mg-Zn composites have a smaller pitting density and shallower pitting in comparison to the Al-Cu-Mg-SiCp/Al-Cu-Mg-Zn alloy.
3.3 The stress corrosion
[image:6.596.72.525.284.413.2]
Figure 5. Stress corrosion images of the 6.5% SiCp/Al-Cu-Mg-Zn composites and Al-Cu-Mg-Zn alloy after 50 days of immersion in the 3.5 wt.% NaCl solution at 90 °C, showing metal breaking apart in the Al-Cu-Mg-Zn alloy; a 6.5% SiCp/Al-Cu-Mg-Zn composites; b Al-Cu-Mg-Zn alloy
3.4 Potentiodynamic polarization curve
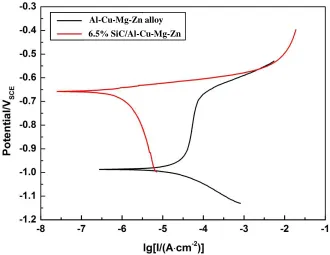
Figure 6. Polarization curves of 6.5% SiCP/Al-Cu-Mg-Zn composites and Al-Cu-Mg-Zn alloy in 3.5% NaCl solution
Typical polarization curves of the 6.5% SiCP/Al-Cu-Mg-Zn composites and Al-Cu-Mg-Zn alloy in 3.5% NaCl solution at pH 7 are shown in Fig. 6. It is evident that adding SiC particles can have a marked impact on the electrochemical response. It is clearly seen that for the Al-Cu-Mg-Zn alloy sample, the measured Ecorr and icorr are -0.98 V and 30 µA/cm2, respectively. When the SiC particles were added to the Al-Cu-Mg-Zn alloy, the Ecorr value increased to -0.65 V and the icorr
[image:7.596.131.461.347.602.2]
value decreased to 1 µA/cm2
. Therefore, the 6.5% SiCP/Al-Cu-Mg-Zn sample has better corrosion resistance than the matrix alloy.
The 6.5% SiCP/Cu-Mg-Zn composites have higher Ecorr and lower icorr values than the Al-Cu-Mg-Zn alloy, which means the 6.5% SiCP/Al-Al-Cu-Mg-Zn composites have better corrosion resistance than the Al-Cu-Mg-Zn alloy. This is in agreement with the results of Candan et al. [16] and Zakaria [17]. According to another report, the SiC particulates are functioning like ceramics and are hardly affected by the NaCl aqueous medium [18], which will prevent corrosion development [19]. 3.5 Effect of SiC on precipitation behaviour of precipitated phase of 6.5% SiCp/Al-Cu-Mg-Zn composites
Figure 7. XRD results of 6.5% SiCp/Al-Cu-Mg-Zn composites and Al-Cu-Mg-Zn aluminium alloy. a 6.5% SiCp / Al-Cu-Mg-Zn composites, b Al-Cu-Mg-Zn alloy
Figure 8. Microstructures of 6.5% SiCP/Al-Cu-Mg-Zn composites and Al-Cu-Mg-Zn alloy scanned by backscatter a 6.5% SiCp/Al-Cu-Mg-Zn composites, b Al-Cu-Mg-Zn alloy
[image:8.596.93.506.252.407.2] [image:8.596.86.513.464.661.2]
formula (1) continues to react with Mg in the alloy melt to produce MgO; the reaction is shown in formula (2). MgAl2O4 is produced as shown in formula (3) by the Al2O3 generated in formula (1) and MgO produced in formula (2), which further promotes the reactions of (1) and (2). This results in increased [Si] and decreased [Mg] in the aluminium alloy. This can be confirmed by Fig. 7. It can be seen that the [Si] and Cu/Mg content all increase around SiC particles due to the reaction processes of formula (1) - (3). According to Mitlin [12], when the [Si] in the aluminium alloy reaches 0.5 wt.% or when Cu/Mg ratio is greater than 8 [20-21], the precipitation of the S" phase is inhabited and the θ' phase is promoted. The Si phase can be the core of the heterogeneous nucleation of the θ' phase, so the number of θ' phase in the 6.5% SiCp/Al-Cu-Mg-Zn increases and the size decreases [12, 22-23]. Under the dual effect of the increase of Si content in the micro-area and Cu/Mg ratio, the main strengthening phase is the fine and dispersed θ phase in 6.5% SiCp/Al-Cu-Mg-Zn composites as shown in Fig. 8.
3SiO2 + 4[Al] = 2Al2O3 + 3[Si] (1) 3[Mg] + Al2O3 = 3MgO + 2[Al] (2) MgO + Al2O3 = 2MgAl2O4 (3)
3.6 Effect of SiC on Corrosion Behaviour of 6.5% SiCp/Al-Cu-Mg-Zn Composites
The effect of SiC particles on the pitting behaviour of 6.5% SiCp/Al-Cu-Mg-Zn composites can be discussed from two aspects. On the one hand, a layer of SiO2 formed on the surface of SiC particles after high-temperature oxidation treatment prevents galvanic corrosion between Al/SiO2(SiC) because the SiO2 does not conduct. This means that, theoretically, the corrosion resistance of the composite material will not be effected by the addition of SiC. On the other hand, the main phases of 6.5% SiCP/Al-Cu-Mg-Zn composites are α-Al, SiC and θ (CuAl2) phase as shown in Fig. 8. The self-corrosion potential of θ (CuAl2) phase in 3.5 wt.% NaCl solution is -0.70 V ~ -0.64 V, which is approximately 1 V higher than α-Al [24-25], so the pitting of the composites in the 3.5 wt.% NaCl solution is driven by the potential difference between the θ (CuAl2) phase and the α-Al, and the α-Al around the θ (CuAl2) phase is continuously corroded. The size of θ (CuAl2) phase in the composite is refined by the addition of SiC particles, so the maximum pitting depth of 6.5% SiCP/Al-Cu-Mg-Zn composites in 3.5 wt.% NaCl solution is shallower than that of Al-Cu-Mg-Zn alloy.
[image:10.596.92.511.188.369.2]
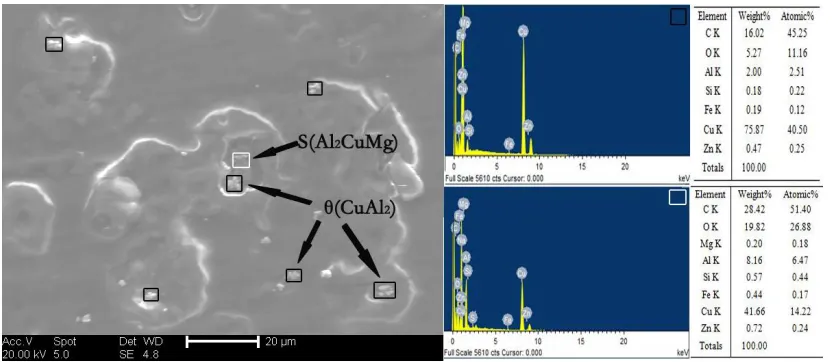
Fig. 9 shows the results of scanning electron microscopy (SEM) and micro-zone energy spectrum analysis of the Al-Cu-Mg-Zn alloy upon removal of the corrosion product film after immersion for 216 h in the solution of 3.5 wt.% NaCl. In Fig. 9, the white box indicates S (Al2CuMg) phase, and the black boxes indicate θ (CuAl2) phases. This clearly shows that the pitting appears around the θ (CuAl2) phases and S (Al2CuMg) phase.
Figure 9. Pitting morphology and energy spectrum analysis of Al-Cu-Mg-Zn alloy after immersion of 216 h in 3.5 wt.% NaCl solution at 120 ℃
4. CONCLUSIONS
(1) The corrosion rate of 6.5% SiCP/Al-Cu-Mg-Zn composites in 3.5 wt.% NaCl solution at 20
℃, 60 ℃, and 90 ℃ is lower than that of Al-Cu-Mg-Zn alloy.
(2) The pitting density of 6.5% SiCP/Al-Cu-Mg-Zn composites in a solution of 3.5 wt.% NaCl at 120 ℃ is less than that of Al-Cu-Mg-Zn alloy, and the maximum pitting depth of 6.5% SiCP/Al-Cu-Mg-Zn composites in the solution of 3.5 wt.% NaCl at 120 ℃ is 360 μm shallower than that of Al-Cu-Mg-Zn Alloy.
(3) The stress corrosion sensitivity of 6.5% SiCP/Zn is lower than that of Al-Cu-Mg-Zn alloy, and the surface of the composites can be maintained complete after stress corrosion experiment.
(4) The reaction between the SiO2 layer on the surface of SiC and Al in the alloy melt improves the Cu/Mg ratio around the SiC particles. This allows for the inhibition of the precipitation of S (Al2CuMg) phase and T (AlZnMgCu) phase and refinement of the θ (CuAl2) phase, so the main phases of 6.5% SiCP/Al-Cu-Mg-Zn composites are SiC, α-Al and the fine dispersion θ (CuAl2).
ACKNOWLEDGEMENTS
References
1. X. H. Wang, J. Guo and J. Yan, Transactions of Materials and Heat Treatment, 34 (2013)1. (In Chinese)
2. K.V. Babu, J.W. Jappes and T. Rajan, Mater.Des. Appl., 10 (2014) 1
3. B. C. KO, G. S. Park and Y. C. Yoo., Mater. Process. Technol., 95 (1999) 210 4. B. R. Bhat, Y. Mahajan and Y. Prasad, Metall Mater Trans A, 31 (2000) 1 5. M. R. Selvan, S. Ramanathan, Int. J. Adv. Manuf., 67 (2013) 5-8
6. Y. Li, K. T. Ramesh, Acta Mater., 46 (1998) 16
7. M. Moazami-Goudarzi, F. Akhlaghi, Tribol. Int., 102 (2016) 28
8. B. C. Pai, K. R. Ravi and R. M. Pillai, T. Indian. Metals., 62 (2009) 4-5 9. J. K. Park, J. P. Lucas, Script. Mater. 37 (1997) 511
10.X. H. Wang, J. Guo and Y.H. Lin. Surf. Interface Anal., 48 (2016)853 11.X. H. Wang, J. Guo and L. Lian, Mater. Sci. Forum, 816 (2015) 118
12.D. Mitlin, J. W. Morris and V. Radmilovic, Metall. Mater. Trans A, 31 (2000) 2697 13.C. L. He, B. Zhang, L. J. Shang, et al., Journal of Northeastern University, 24 (2003) 5 14.Y. C. Hua, Y. J. Song, M. J. Tu, Journal of Chinese Society for Corrosion and Protection, 16
(1996) 2
15.N. J. H. Holroyed, G. M. Scamans, ASTM STP 821, Philadelphia: ASTM, 1984 16.S. Candan, Mater. Lett., 58 (2004) 3601
17.H. M. Zakaria, Ain Shams Engineering Journal, 5 (2014) 831
18.F. Lu, Z. H. Tang, X. Y. Zhang, et al., Journal of Aeronautical Materials, 24 (2004) 1 19.C. G. Cordovilla, E. Louis, J Mater Sci, 19 (1984) 279.
20.S. P. Ringer, G. C. Quan, T. Sakurai. Mat Sci Eng A, 250 (1998) 120 21.D. H. Xiao, B.Y. Huang, China Foundry, 56 (2008) 1200 (In Chinese) 22.I. C. Barlow, W. M. Rainforth and H. Jones. J Mater Sci, 35 (2000) 1413
23.S. Y. Wang, Z.G. Chen and S.C. Li, T Nonferr Metal Soc 19 (2009) 1902 (In Chinese) 24.J. F. Li, Z. Q. Zi and J. Na. Mater Chem Phys, 91 (2005) 325