i
University of Southern Queensland
Faculty of Health Engineering & Sciences
MUSIC Model Accuracy in
Predicting Stormwater Quality
A dissertation submitted by
Wade Daniel Fletcher
in fulfilment of the requirements of
ENG4111 and ENG4112 Research Project
towards the degree of
Bachelor of Engineering (Civil Engineering)
ii
ABSTRACT
This dissertation investigates the use of stormwater treatment devices for urban catchments within Australia. The primary goal of the dissertation is to assess the accuracy of MUSIC modelling of stormwater pollutant generation and pollutant reduction to assess the effectiveness of the devices it is used to design.
A bio-filtration and detention basin with a moderately sized urban catchment was selected as the test site. The inlet into the existing basin was sampled over 6 months, during several storms, with flow depths measured and water samples taken at 6 minute intervals. These water samples were then analysed at a local laboratory and the results compared to the MUSIC model that was set up to replicate the basin catchment. These samples and discharges were then compared against the results of a MUSIC model of the site catchment. A pollutant trap was constructed at the basin inlet to collect gross pollutants to check the accuracy of the gross pollutants generation within MUSIC. Given the limitations in time and funding it was not possible to provide a definitive answer as to the accuracy of flow, pollutant generation and pollutant reduction predictions by MUSIC. The level of modelled gross pollutants was reasonably accurate in relation to the volumes that were collected on site. On average the mass of the gross pollutants were 35% less than what was predicted by the MUSIC model but this was to be expected as not all the sediment or organics were captured.
Sampled inflow TSS and TP pollutant levels were generally below the modelled values. Inflow TN values were the least accurate of all the pollutants especially after periods of prolonged rain where the modelled TN concentrations were well above what was sampled.
On average sampled TN and TP inflow concentrations were 61% and 48% lower respectively than the modelled concentrations. The average sampled concentration of inflow TSS was 56% lower than the corresponding concentration modelled by MUSIC. It should be noted that the storm events that were sampled were smaller than an average storm. Previous research also found that there was a tendency by the MUSIC software to overestimate the pollutant concentrations for smaller storms.
iii
pollutant generation and pollutant reduction it is recommended that more detailed research is undertaken over an extended period.
The setup of the bio-filtration basin was not considered to be adequate enough to provide for an accurate assessment of the modelled pollutant reduction. Results of the sampled outflow show a minimal reduction in pollutants and the condition of the samples basin should be kept in mind.
iv
University of Southern Queensland
Faculty of Health Engineering & Sciences
ENG4111 & ENG4112 Research Project
LIMITATIONS OF USE
The Council of the University of Southern Queensland, its Faculty of Health, Engineering and Surveying, and the staff of the University of Southern Queensland, do not accept any responsibility for the truth, accuracy or completeness of material contained within or associated with this dissertation.
Persons using all or any part of this material do so at their own risk, and not at the risk of the Council of the University of Southern Queensland, its Faculty of Health, Engineering and Surveying or the staff of the University of Southern Queensland.
This dissertation reports an educational exercise and has no purpose or validity beyond this exercise. The sole purpose of the course pair entitled “Research Project” is to contribute to the overall education within the student’s chosen degree program. This document, the associated hardware, software, drawings, and other material set out in the associated appendices should not be used for any other purpose: if they are so used, it is entirely at the risk of the user.
v
CANDIDATES CERTIFICATION
I certify that the ideas, designs and experimental work, results, analyses and conclusions set out in this dissertation are entirely my own effort, except where otherwise indicated and acknowledged.
I further certify that the work is original and has not being previously submitted for assessment in any other course or institution, except where specifically stated.
Mr Wade Daniel Fletcher
Student Number: 0050044296
_____________________________________ Signature 13th October 2013
vi
ACKNOWLEDGEMENTS
I would like to acknowledge all those who have made it possible for me to complete this research project. In particular I would like to acknowledge Dr Ian Brodie, of the University of Southern Queensland for his supervision and guidance throughout this project.
I would also like to express my gratitude to those who have provided financial assistance to make this project possible. Thank you to Lismore City Council and Mr Nick Stephens for providing funding for the testing of stormwater samples. Thank you to Environmental Analysis Laboratory and Mr Graham Lancaster for also providing discounted rates for the testing of stormwater samples. Thank you to eWater for the provision of a licensed copy of MUSIC modelling software.
Appreciation is also due to my business partner, Mr Jakob Pfaeffli of CivilTech Consulting Engineers, for his knowledge and expertise in engineering matters particularly relating to stormwater modelling and treatment.
Most importantly, thank you to my wife for her support and encouragement & understanding throughout this research project and over the past 9 years of part time study and full time work. Without this help and encouragement, I doubt I would have made it this far.
W
ADEF
LETCHER University of Southern Queenslandvii
TABLE OF CONTENTS
ABSTRACT ... ii
LIMITATIONS OF USE ... iv
CANDIDATES CERTIFICATION ... v
ACKNOWLEDGEMENTS ... vi
TABLE OF CONTENTS ... vii
LIST OF FIGURES ... ix
LIST OF TABLES & GRAPHS ... x
NOMENCLATURE AND ACRONYMS ... xii
CHAPTER 1 - INTRODUCTION ... 1
1.1 Aims and specific objectives ... 1
1.2 Background information ... 3
1.3 Assessment of consequential effects, implications & ethics ... 3
1.4 Project methodology & justification ... 5
1.5 Resource planning ... 13
1.6 Project timeline ... 15
CHAPTER 2 – LITERATURE REVIEW ... 16
2.1 Introduction ... 16
2.2 Existing research into MUSIC modelling accuracy ... 16
2.3 Stormwater sampling methodology ... 18
2.4 Soil filter media in bio-filtration systems ... 20
2.5 Leaching, plant species and other considerations ... 20
2.6 Gross pollutant research and testing methodology ... 21
2.7 Literature review conclusion ... 22
CHAPTER 3 – STORMWATER MODELLING ... 23
3.1 The subject site ... 23
3.2 Stormwater treatment objectives ... 23
3.3 Weather data ... 25
3.4 MUSIC modelling setup ... 30
3.5 Effects of individual MUSIC parameters on a model ... 35
CHAPTER 4 – SAMPLING RESULTS & COMPARISONS ... 41
viii
4.2 Stormwater quality sampling results ... 43
4.3 Stormwater quality comparisons ... 45
4.4 Stormwater flow volumes ... 52
CHAPTER 5 – ADDITIONAL SAMPLING RESULTS ... 53
5.1 Alternate stormwater treatment devices ... 53
CHAPTER 6 – RESEARCH FINDING & DISCUSSION ... 58
6.1 Research findings & discussion ... 58
6.2 MUSIC source node pollutant generation accuracy ... 58
6.3 MUSIC treatment node accuracy ... 61
CHAPTER 7 – RESEARCH CONCLUSIONS ... 64
7.1 Achievement of Project Objectives ... 64
7.2 Further Work ... 66
REFERENCES ... 67
APPENDIX A – Project Specification ... 70
APPENDIX B – Project Timeline ... 71
APPENDIX C – Raw Sampling Results ... 72
ix
LIST OF FIGURES
Figure 1.1: Basin locality plan ... 6
Plate 1.1: Existing overgrown headwall, Waratah Way basin ... 7
Plate 1.2: Constructed GPT and cleaned out headwall, Waratah Way basin ... 8
Figure 1.2: Basin layout plan ... 9
Figure 1.3: Basin typical section ... 9
Figure 1.4 : Basin catchment plan & 1m contours ... 10
Figure 3.1: Evapro-transpiration rates ... 29
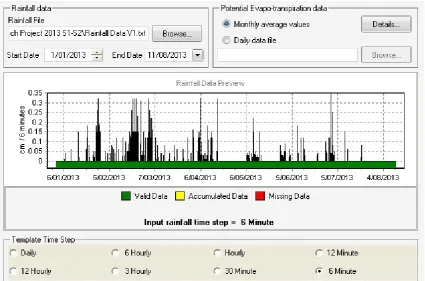
Figure 3.2: MUSIC meteorological template builder ... 30
Figure 3.3: MUSIC modelling schematic of subject site ... 32
Figure 5.1: Gasworks Channel locality plan ... 54
Figure 5.2: Just StreetMinor basin locality plan ... 55
x
LIST OF TABLES & GRAPHS
Graph 3.1: Daily rainfall measured onsite ... 27
Table 3.2: Source Node - Mean annual load comparison ... 31
Graph 3.2: Effect of basin storage volume on stormwater treatment. ... 36
Graph 3.3: Effect of filter area on stormwater treatment. ... 37
Table 3.3: Hydraulic conductivity vs median particle size (MUSIC) ... 38
Graph 3.4: Impact of hydraulic conductivity on stormwater treatment. ... 38
Graph 3.5: Effect of filter depth on stormwater treatment. ... 39
Table 4.1: Modelled TSS results (mg/L) ... 41
Table 4.2: Modelled TN results (mg/L) ... 42
Table 4.3: Modelled TP results (mg/L) ... 42
Table 4.4: Modelled GP wet weight over sampling collection periods (kg) ... 43
Graph 4.1: Daily & cumulative modelling results ... 43
Table 4.5: Sampled TSS results (mg/L) ... 44
Table 4.6: Sampled TN results (mg/L) ... 44
Table 4.7: Sampled TP results (mg/L) ... 44
Table 4.8: Sampled GP results wet weight (kg) ... 45
Table 4.9: TSS comparison of modelled and sampled concentrations (mg/L) ... 45
Graph 4.2: Storm 1 TSS comparison of modelled & sampled concentrations (mg/L) . 46
Graph 4.3: Storm 2 TSS comparison of modelled & sampled concentrations (mg/L) . 46
xi
Table 4.10: TN comparison of modelled and sampled concentrations (mg/L) ... 47
Graph 4.5: Storm 1 TN comparison of modelled & sampled concentrations (mg/L) ... 48
Graph 4.6: Storm 2 TN comparison of modelled & sampled concentrations (mg/L) ... 48
Graph 4.7: Storm 3 TN comparison of modelled & sampled concentrations (mg/L) ... 49
Table 4.11: TP comparison of modelled and sampled concentrations (mg/L) ... 49
Graph 4.8: Storm 1 TP comparison of modelled & sampled concentrations (mg/L) .... 50
Graph 4.9: Storm 2 TP comparison of modelled & sampled concentrations (mg/L) .... 51
Graph 4.10: Storm 3 TP comparison of modelled & sampled concentrations (mg/L) .. 51
Table 4.12: GP comparison of modelled and sampled weights (kg) ... 51
Table 6.1: Accuracy of TSS concentration in inflow - sampled & modelled (mg/L) .... 59
Table 6.2: Accuracy of TN concentration in inflow - sampled & modelled (mg/L) ... 59
Table 6.3: Accuracy of TP concentration in inflow - sampled & modelled (mg/L) ... 60
Table 6.4: Accuracy of GP weights in inflow - sampled & modelled (kg) ... 61
Table 6.5: Accuracy of TSS concentration in outflow - sampled & modelled (mg/L) .. 62
Table 6.6: Accuracy of TN concentration in outflow - sampled & modelled (mg/L) ... 62
xii
NOMENCLATURE AND ACRONYMS
The following abbreviations have been used throughout the text and bibliography: ARI Average Recurrence Interval
BASIX Building Sustainability Index (NSW) BOM Bureau of Meteorology
DCP Development Control Plan
EAL Environmental Analysis Laboratory EPA Environmental Protection Authority FAWB Facility for Advancing Water Biofiltration GP Gross Pollutants
GPT Gross Pollutant Trap
ha Hectare
LCC Lismore City Council mg/L Milligrams per litre. mm/hr Millimetres per hour.
MUSIC Model for Urban Stormwater Improvement Conceptualisation NRLG Northern Rivers Local Government
NSW New South Wales ppm Parts per million
QLD Queensland
TN Total Nitrogen TP Total Phosphorous TSS Total Suspended Solids
1
CHAPTER 1 - INTRODUCTION
Water is one of the most important substances on earth. All plants and animals must have water to survive. If there was no water there would be no life on earth. "
(Department of Health, 2013)
1.1
Aims and specific objectives
The importance of water has been well known for thousands of years. Without it human life would cease to exist. However, over the past century there has been a substantial increase in human population, an increase in pollutant generation which is often coupled with an increase in clean water demand and a decrease in rainfall and runoff.
In the past few decades there has been a substantial push to reverse this worsening of stormwater quality by seeking to return the runoff flows to near pre urban development conditions. The main goals are to reduce the stormwater volumes to pre development levels and reduce specific pollutant loads to a level that is not so detrimental to the aquatic life of our creeks, rivers and oceans.
Perhaps one of the most common and effective ways to treat stormwater runoff from residential, commercial, industrial or even agricultural land is by the use of a bio-filtration or bio-retention basin.
Simply put, a bio-filtration basin is a stormwater detention basin with a filter media layer in the base to filter sediment and pollutants from stormwater before discharging it downstream. These basins are typically planted with suitable species of sedges and grasses which aid in the removal of pollutants such as phosphorous and nitrogen. The basin typically also has a series of mid-flow pipes and a spillway which aid in reducing the peak flow volume discharging from the site which in turn reduces erosion and pollution problems downstream.
In the past decade there has been a significant push within cities to reduce the impact of stormwater by reducing the volume and pollutants discharging from a development. This understanding of the importance of stormwater treatment has filtered down to regional councils and is slowly being implemented by smaller rural councils.
2
Water. Lismore City Councils stormwater guidelines are primarily controlled by their DCP Ch22 Water Sensitive Design (Lismore City Council DCP)Additional information on stormwater detention, rainfall data and general stormwater design is provided in the Northern Rivers - Local Government Development Design Specification, D5 Stormwater Drainage Design (Lismore City Council NRLG) which is co-written by Lismore City Council. While there are generally adequate stormwater management plans in place there seems to be a lack of knowledge of the modelling process and a lack of research into accuracy of stormwater pollutant modelling software such as the Model for Urban Stormwater Improvement Conceptualisation or MUSIC. MUSIC modelling is the main software used by local councils in assessing stormwater pollutant levels for Development Applications and Construction Certificates.
This research project sought to provide a clearer understanding of the accuracy of stormwater modelling on stormwater pollutants and stormwater flow volumes. The primary objectives of this research project were to:
Model a developed catchment and bio-retention basin for inflow and outflow pollutant levels and compare them with laboratory analysed stormwater samples for accuracy.
Measure the stormwater volumes generated by the catchment and to compare them for accuracy against the flow volumes generated by MUSIC.
Capture and measure gross pollutants and compare the volume with the MUSIC model volumes.
Secondary objectives of the research were to assess the effects of a bio-filtration basin on stormwater flows and to review the importance of the first flush in stormwater management plans. However, due to time constraints during the research project these objectives were not assessed.
3
1.2 Background
information
Prior to commencing the field work and modelling of the proposed stormwater treatment device a literature review will be undertaken to identify existing studies, their results, research contradictions and any gaps in available research and knowledge. The literature review will also increasing the authors general understanding of the topic and terminology and allow the author to avoid common mistakes and provide suitable methodology for any field or laboratory work.
The reasons for conducting a literature review include:
Identifying existing research into MUSIC modelling accuracy;
Identify current stormwater treatment devices and their treatment effectiveness; Determining the best methodology for water sampling and collection and
measuring of gross pollutants;
Providing an understanding of the extent of research into stormwater treatment and the accuracy of MUSIC modelling;
Allowing common research and field work mistakes to be avoided.
The literature review is detailed in Chapter 2 of this report and will be updated throughout the course of this research project.
1.3
Assessment of consequential effects, implications & ethics
A key consideration of all research or projects should be to "Identify sustainability, safety and ethical issues" that are associated with that project.
1.3.1 Safety
Safety not only relates to the person conducting research but also members of the public that may be affected by it. Specific safety concerns relating to the field work for this project have been addressed in the risk assessment in section 1.5. Most safety concerns can be substantially reduced by adequate use of PPE and the application of common sense.
4
works by a letter one week prior to commencement. Ultimately, it is hoped, the recommendations and conclusions of this research paper may lead to improved stormwater treatment devices and cleaner, safer water ways for all.
1.3.2 Ethical responsibility
The Code of Ethics set forth by the Institution of Engineers (EA 2010), Australia, outlines the following key principals:
to demonstrate integrity by being honest and trust worthy and to respect the dignity of all persons;
to practice competently by maintaining skills and knowledge;
to exercise leadership, support diversity and to uphold the reputation of the practice of engineering;
and finally to promote sustainability, engage with the community and to consider the needs of future generations.
Throughout this project all of these key principals were adhered to. All results and interpretation of data were objective and fair with the primary aims being the promotion of sustainable processes to increase my engineering skills and knowledge.
1.3.3 Sustainability
The main purpose of good stormwater management practices is the sustainability of our river systems, habitat, water source and ultimately human life. By better understanding the impact of human development and the effectiveness of stormwater treatment devices such as bio-retention basins we can provide for a more sustainable way of life.
5
1.4
Project methodology & justification
The primary tasks for this research project are listed in the Project Specification attached in Appendix A. As mentioned in Section 1 the aims and objectives of this research project were to:
Model a developed catchment and bio-retention basin for inflow and outflow pollutant levels and compare them with laboratory analysed stormwater samples for accuracy.
Measure the stormwater volumes generated by the catchment and to compare them for accuracy against the flow volumes generated by MUSIC.
Capture and measure gross pollutants and compare the volume with the MUSIC model volumes.
The proposed research project was first discussed with several USQ staff members and possible problems were resolved and improvements made to the tasks and methodology. In late 2012, with the basic project outline selected, sponsorship was sought from local councils, water testing labs and local businesses to provide funding for the testing of stormwater samples. As mentioned, funding has been provided by LCC and discounted testing by Environmental Analysis Laboratory (EAL).
The next step in the research project was to select a suitable site to monitor the full range of pollutants and flows. LCC provided a full register of stormwater treatment devices under their control including wetlands, grassed swales, bio-filtration and rains gardens. A ranking matrix was set up to select the most suitable site from these devices. The selection process will look at the location of the device, treatment potential, safety, proximity to BOM rainfall stations, ability to measure pollutants and flow, catchment suitability and available engineering details and models.
This matrix selection process assessed the following sites: (Refer Appendix D)
A series of bio-filtration basins and swales located at the Goonellabah Sports and Aquatic Centre.
6
A midsized bio-filtration basin located at the end of Waratah Way, Goonellabah. This basin catchment was well established with only 2 buildings under construction. The basin has been operational for over 10 years.
A series of rainwater gardens in the Lismore CBD which treated commercial runoff through bio-filtration.
A bio-filtration basin located at Nesbitt Park.
A vegetated swale known as Gasworks channel located in downtown Lismore.
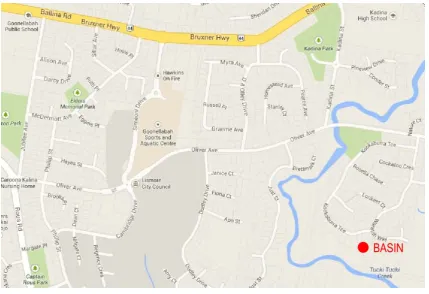
The site that was chosen for testing was the bio-filtration basin at Waratah Way (refer Figure 1.1). The basin is easy to access and located close to the authors place of work, is safe for testing and had little impact on the general public, has a single inflow and outflow point and was able to be modified to collect and measure gross pollutants. On the downside the basin was overgrown, had a large build-up of sediment especially at the headwall inlet and was mainly grassed as opposed to being vegetated with suitable plant species (refer Plate 1). While not the perfect site the selection matrix showed that this was the most suitable of the sites available within Lismore City Council.
[image:18.595.114.544.407.701.2]7
Plate 1.1: Existing overgrown headwall, Waratah Way basin
With the site chosen, testing equipment was organised through EAL in order to be prepared to sample during subsequent rainfall events. The site was cleared of any rubbish, sediment cleared from headwalls and neighbours were advised of the pending work.
8
Plate 1.2: Constructed GPT and cleaned out headwall, Waratah Way basin
9
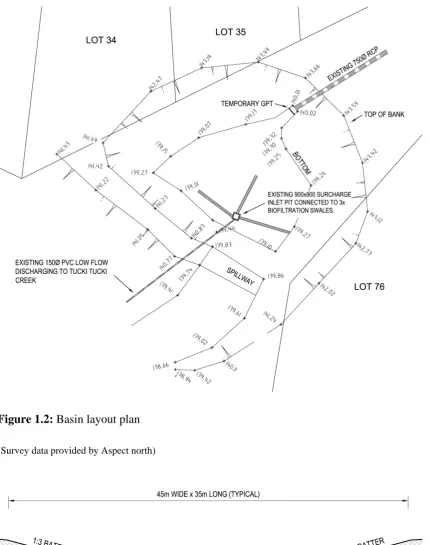
Figure 1.2: Basin layout plan (Survey data provided by Aspect north)
Figure 1.3: Basin typical section
[image:21.595.116.545.66.612.2]10
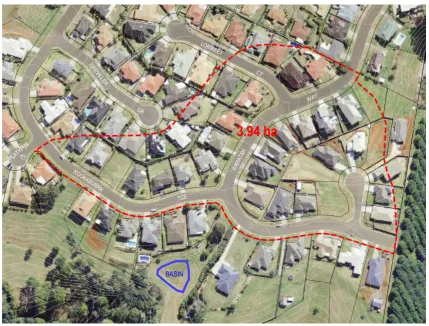
[image:22.595.113.543.183.509.2]Tucki Creek before flowing to the Wilson and Richmond Rivers. The catchment and bio-filtration basin was investigated and modelled with MUSIC 5 to determine the pollutant levels generated for Total Nitrogen (TN), Total Phosphorous (TP), Total Suspended Solids (TSS) and Gross Pollutants (GP) as well as the stormwater flows. The model also provides a reduction rate for pollutants and out flows.
Figure 1.4 : Basin catchment plan & 1m contours
(Aerial photo sourced from NSW Sixviewer site, 1m existing contours extracted from Lismore City
Councils GIS database)
11
Total Phosphorous (TP) is defined as "the sum of reactive, condensed and organic phosphorous" (ASA analytics Phosphorous). As TP is a nutrient responsible for plant growth its impact on water quality is the same as TN. Excessive TP in a water system causes algae blooms which ultimately decay and deplete the dissolved oxygen in water. The removal of TP and TN nutrients is best done with wetlands of biofiltration basins. Total Suspended Solids (TSS) refers to matter that is suspended or dissolved in water (Boulder Council). While TSS solids can be captured with a 0.45 micron filter paper, the total dissolved solids (TDS) cannot. However TDS are mainly salts which are typically low in stormwater samples. The combined TSS + TDS gives the total solids found in a water sample. TSS affects the specific conductance and turbidity of water. TSS can be effectively removed with sediment basins, wetlands, bio-filtration basins and even grassed swales and buffer strips.
Gross Pollutants (GP) are defined as large debris from urban catchments that includes plastic bottles, organics such as leaves and lawn clippings, coarse sediment, cigarette butts, metal cans and domestic plastics (Gosford GPT). While gross pollutants can be captured by basins and wetlands they tend to be flushed through the system and into creeks and rivers during large rainfall events. Gross pollutants are relatively easy to remove with end of line GPTs or pit based GPTs but require regular maintenance and the removal of gross pollutants to remain operational.
The actual methodology of sampling the stormwater was done in the following steps: Rainfall intensity was measured and recorded at the site every 6 or 12 minutes
for the duration of the event. If rainfall last longer than 2 hours the sampling was generally stopped due to time and financial constraints.
Samples of stormwater were taken at the inlet headwall and outlet headwall typically every 12 minutes. The procedure for sampling was discussed with EAL and is outlined in Section 2.3 of this report.
12
Additional grab sampling of other treatment devices within Lismore was also carried out. This sampling consisted of a single inflow and outflow sample. Collecting these samples for other devices such as wetlands, vegetated swales and rain gardens was done to provide important data to LCC on the effectiveness of different stormwater treatment devices. This will hopefully help in the further development of their stormwater management guidelines.
A total of 4 storms were measured and sampled, three of these were samples for the biofiltration basin at Waratah Way (Refer Appendix C). These samples were stored in a fridge and transported to EAL for testing within the allocated time limit of 48 hours. The BOM was not able to provide up to date 6 minute rainfall data to use with the MUSIC model. As such a 6 minute rainfall intensity hydrograph was manually created for the model. This was done by recording the actual rainfall depths on the site every day. Details of the type of rain and when it fell were noted. The BOM provides 30 minute weather information including rainfall intensities at the Lismore Airport which remain online for 4 days. As the airport is several kilometres from the subject treatment basin the intensities were scaled up or down to match the daily rainfall levels being recorded on site. Existing daily rainfall data from Elders weather and the BOM web sites was used to create "lead in" rainfall data prior to the sampling dates to allow an accurate "warm up" period for the model to run. This warm up period ensures that the MUSIC model is functioning correctly at the time of the sampled events and not simply represented as a dry basin within the model.
13
was done at the start of a rain event to ensure that the first flush pollutants were captured.
The MUSIC model was then run and pollutant loadings determined for each measured storm by way of the time series graph function. The accuracy of the pollutant generation and pollutant reduction for all pollutants was then able to be analysed. TN, TP and TSS were reported in mg/L by EAL while gross pollutants were measured in kg. The source loads, residual loads and reductions were then used to determine the accuracy of the treatment train effectiveness function within MUSIC 5. Additional detail on the setup of the MUSIC model is provided in section 3.
The source nodes that were used for the MUSIC model were supplied by the Tweed Shire Council (TSC SW Quality). The Tweed Source node will be compared with the default MUSIC source nodes and source nodes from Brisbane City Council (BSC Modelling Guidelines). The accuracy of each individual parameter in the source nodes will not be tested as it is beyond the scope of this project.
1.5 Resource
planning
All projects require certain levels of resources which may include staff and personnel, technical support or equipment suppliers. The resource requirements for this research project are listed below.
1.5.1 Staff and personnel requirements
Personnel involved in this research included but were not limited to:
Wade Fletcher - As the author of this research project I was responsible for the project performance and completion of the required tasks. This was achieved by following the project timeline and keeping close communication with my course supervisor and support staff.
14
Anton Nguyen - Was the primary contact within LCC. Anton provided access to council’s records, stormwater treatment devices, equipment and services. Communication with LCC took place either by phone or email with a log being kept of all communications.
Graham Lancaster - Was the primary contact at EAL. Graham was responsible for the testing of stormwater samples and the provision of testing equipment and bottles for the project. Communication with Graham was carried out via email. 1.5.2 Equipment and technological support
A range of equipment and technological support was required to complete this research project. LCC provided access to stormwater treatment devices, old engineering details and models as well as equipment for sampling. EAL was supplied stormwater collection bottles for testing of TN, TP and TSS. The Bureau of Meteorology website was used as access to 30 minute rainfall intensities (BOM Lismore Airport) which was used to build a custom 6 minute rainfall data intensity table. Access to MUSIC software has be provided by eWater through USQ at the start of the project. At the start of the second semester the MUSIC licence was changed to VPN based licence. This licence was not able to be accessed properly so a copy of MUSIC was purchased by the author.
1.5.3 Financial backing
Lismore City Council agreed to fund the cost of the stormwater testing by EAL. The cost was subject to the number of tests performed and originally estimated to be 40 to 60 tests at $50 each equating to $2000 to $3000. The final number of samples tested did not reach this amount primarily due to the weather and lack of rainfall.
Environmental Analysis Laboratory (EAL) agreed to sponsor the research project by way of substantially reduced water testing rates.
15
A range of alternate sampling sites, research funding and stormwater testing facilities were investigated in case there were interruptions to the proposed agreements. The most critical item for the success of the project was the rainfall. While there was heavy rainfall in January, February and early March prior to the commencement of sampling there was minimal rainfall for the rest of March and into April. Heavier rainfall that fell from April to June tended to be over several days as opposed to isolated events. Rainfall over several days wasn't considered suitable for sampling as the pollutant levels would be significantly reduced due to the "first flush" effect. As such the number of samples taken was about half what was originally envisaged.
1.6 Project
timeline
16
CHAPTER 2 – LITERATURE REVIEW
2.1 Introduction
A literature review is essential to helping a researcher identify existing studies, their results, research contradictions and any gaps in available research. A literature review also helps in increasing a researchers general understanding of a topic and terminology, allows the researcher to avoid common mistakes and provide suitable methodology for any field or laboratory work.
Completing a literature review will help determine the extent of existing research into stormwater modelling accuracy, show existing results or lack of data, provide information on stormwater sampling methodology as well as provide background knowledge on this subject.
Bio-filtration devices are one of the most popular treatment devices because of their flexibility in size, location and appearance and their pollutant reduction performance (Hatt et. al 2008). Bio-filtration can be used as rain gardens, roadside buffer strips or designed to treat residential, industrial or even agricultural catchments. Bio-filtration also improves water runoff quality by planted filtration media as well as fine filtration, extended detention and biological uptake (Melbourne Water, 2005).
2.2
Existing research into MUSIC modelling accuracy
A report by Dotto, Deletic and Fletcher analysed the accuracy of the MUSIC model in relation to flow and pollutant generation. The primary aim of their research was too "increase our understanding of the uncertainties of the parameters in models that are currently being used for assessment of stormwater quantity and quality." More specifically they were seeking to find a relationship between "model uncertainty and the data availability for calibration and validation".
17
6 months. The sampling being done by this research project is not adequate to supplement the sampling by Dotto as it is over a short time period, has a small number of samples and does not sample all events. It should, however, confirm the general results as discussed by Dotto.
In relation to pollutant modelling by MUSIC, Dotto found varying levels of accuracy with a larger number of rainfall events and higher volumes producing better results. They recommended that "further work is necessary to evaluate the impact of data on calibration and validation in the case of water quality models."
Dotto also found that of the 13 calibration parameters in MUSIC the results were only sensitive to two parameters being Effective Impervious Area (EIA) and routing parameter K. It was suggested that the other 11 be fixed as default. No recommendations were made in relation to the pollutant generation parameters. The current version of MUSIC still has 13 flow calibration parameters available. The scope of this research project did not allow for further investigation of these parameters.
It should be noted that at the time of this research the latest version of MUSIC was version 3 which has since had substantial updates made to calculation methods. The current version of MUSIC is 5.1 which will be used for modelling in this research.
Research by Bratieres et.al. (2008) noted that despite the popularity of bio-filters worldwide there was "only limited data available on their performance in pollutant removal". He also noted that most field and laboratory studies showed poor TN removal, moderate to good TP removal while TSS removal was consistently higher than 90%.
18
Imteaz et. al (2012) found that MUSIC predictions for TSS and TP concentrations in Brisbane were very close to the sampled levels. However, they found that MUSIC overestimated the flow reductions and the TN removal efficiency. In Melbourne they found that general flow and TSS reductions were fairly accurate but TP and TN reductions did not match the model. Reasons given for these discrepancies and differences between locations included nutrient leaching and the different rainfall levels for the different seasons. Flow estimation by MUSIC was found to be fairly accurate but it was recommended that additional sampling and research be conducted.
Research into the effectiveness of biofilters by Bratieres (2008) showed a mean TN removal of 46% and an average removal of 80% of TP. FAWB (2008) found that correctly designed and maintained biofiltration basins should be able to remove up to 50% of TN, 80% of TP and 90% of TSS.
2.3
Stormwater sampling methodology
The methodology used by Dotto, Deletic and Fletcher involved 1 minute rainfall logging over a 2 year period with discrete sampling during rainfall events of TSS, TP and TN pollutants at two sites around Melbourne. Between 10 and 24 pollutant samples were per event with between 27 and 50 events being sampled at their primary site. No collection or testing of gross pollutants were undertaken for this research.
The research conducted by FAWB at the Monash University (Bratieres et.al. in 2008) involved 125 bio-filtration columns set up to analyse the influence of vegetation type, filter type and depth, filter area and pollutant inflow levels. Inflow and outflow samples were collected and tested for TN, TP and TSS along with other pollutants and heavy metals. While useful as background information these results do not assess the effectiveness of a "real world" catchment and treatment basin.
19
calculated by MUSIC compared with the inflow and outflow concentrations as sampled and measured in the field.
The most detailed information on water monitoring and sampling was found in the Monitoring and Sampling Manual 2009 published by the QLD Department of Environment and Heritage Protection (QLD EH&P 2009). The key components of stormwater sampling that are outlined in the Monitoring and Sampling Manual 2009 includes:
Understanding that sound sampling design is essential. This includes understanding that water quality varies with time and location.
The sampling method can depend on the purpose and objectives of water samples.
The system that is to be sampled will also determine the best approach to sampling design and a good understanding of the ecosystem will help.
What, where, when and how to sample stormwater.
Sampling can be done by using a sampling pole and bottle or an auto sampler. Field equipment that is recommended for stormwater sampling includes sample
carrier boxes, marking pens, camera, labels, sample bottle and a method of keeping samples cool.
Surface water should be collected using gloves, bottles should be labelled prior to collection, and samples should be taken in the centre of the channel with the mouth of the bottle 10cm below the surface.
Avoid scraping the sides of drains or disturbing sediment.
Avoid contamination of samples by not smoking, not over filling bottles or rinsing bottles.
Each sample should be named, include the date, time & location.
20
2.4
Soil filter media in bio-filtration systems
The Facility for Advancing Water Bio-filtration (FAWB) provided guidelines for soil filter media within bio-retention systems in March 2008. The recommended filter media profile was 400-600mm deep with a 100mm thick transition layer and a drainage layer with 50mm under pipe coverage. Based on a temperate climate it was suggested that a typical bio-retention basin should be 2% of the catchment area with infiltration ranging from 100-300mm/hr to sustain plant life. It was suggested that the filter media was to consist of material ranging from silt or fine sand and gravel up to course gravel. The majority of the media (50-90%) was to be fine to course sand. These parameters were consistent with bio-filtration parameters specified in other research papers by Bratieres et. al. 2008 and Hatt et. al. 2008.
It was noted by FAWB (June 2008) that the hydraulic conductivity of media started at the design rate, decreased over the first 6 months before increasing back to the design rate over the next 12 months. This reduction was due to media compaction and clogging prior to the root system gaining full depth and size to improve infiltration rates.
Research by Hatt et. al. (2008) indicates the importance of the infiltration rate of the bio-filtration media. It was noted that "higher infiltration rates may lead to higher effluent concentrations" and that higher hydraulic capacity can enable either higher annual flows to be treated or smaller sized treatment devices to be used but that "there appears to be a trade-off between hydraulic capacity and pollutant removal". The actual media to be selected will always depend on the treatment objectives and the space available for treatment.
2.5
Leaching, plant species and other considerations
21
FAWB (June 2008) noted that most soils will naturally leach nitrogen and that the "extent of leaching is influenced by the presence of organic matter". They also noted that "there is a strong correlation between the number of dry days prior to a storm event and leaching of nitrogen from soil filter media". It was suggested that filter media that is low in nutrients should be used and that leaching is influenced by the presence of organic material. The possibility of leaching is noted and will be considered when assessing the stormwater sampling results for this research project.
Research into the ideal plant species was conducted by FAWB (June 2008). They found that of the 5 plant species they tested Carex appressa was the best for the removal of TP and TN nutrients. It was suggested that this was because of the rapidly spreading roots. Other plant species that had high nutrient removal rates included Melaleuca ericifolia, Juncus amabilis and Juncus flavidis while Dianella was found to be poor at nutrient uptake and removal. These findings were backed up by field scale research by Hatt et. al. (2008) which showed that Carex appressa had better Nitrogen uptake than Dianella. The subject site at Waratah way does not contain any of these recognised plant species and is typically grassed with Kikuyu grass.
Taebi et. al. (2004) researched the effects of the first flush of a storm upon the pollution load of urban stormwater runoff. They found that the effects of the first flush were the most noticeable for TSS while discharge loads of TN were approximately uniform. Taebi did not monitor levels of TP or gross pollutants but it is likely that TP levels would be uniform while gross pollutants would likely be increased during the first flush period. Taebi also found that the first flush load of TSS "increases, when the intensity and duration of a rainfall event increases". Taebi developed an equation which predicts the total load of TSS transported with the first 20% of runoff with respect to total depth of rainfall and total time of rainfall duration.
2.6
Gross pollutant research and testing methodology
22
implementation of minimal monitoring will be sufficient with the following Level 1 minimal monitoring methodology to be adopted for the sampling of gross pollutants.
Measure and record rainfall
Record interval between collection events
Record weight of 3 categories of gross pollutants
2.7
Literature review conclusion
The literature review demonstrates the increasing emphasis on stormwater management over the past decade. Existing research provides adequate information on the effectiveness of stormwater treatment including bio-filtration basins as well as the importance of parameters such as filter media type and plant species.
However, there does appear to be a shortage of research into the accuracy of stormwater pollutant modelling especially with the latest version of MUSIC. Given that MUSIC is the main stormwater pollutant modelling within Australia it would be valuable to understand how the pollutant load generation and pollutant reduction of a MUSIC model compare with the pollutant loads and reductions of a functioning catchment and treatment basin.
In the research papers into the accuracy of MUSIC modelling by Imteaz et. al (2012) and Dotto et al (2008) no research was done into the gross pollutant generation by catchments. I was unable to find any other research into the accuracy of the gross pollutant loads generated by MUSIC. As part of this research project I will compare the model against the actual levels of gross pollutants generated by the chosen catchment to gain a better idea of the accuracy of MUSICS gross pollutant load. However, because this research project is only partly focused on gross pollutants and is limited to one catchment further research into this area is recommended.
23
CHAPTER 3 – STORMWATER MODELLING
3.1
The subject site
The stormwater sampling location is located at the end of Waratah Way, Goonellabah NSW. The basin catchment is 3.94 hectares and drains into Tucki Tucki Creek before flowing to the Wilson and Richmond Rivers. The basin is in land zoned Residential under the Lismore Local Environmental Plan (LEP) 2012. The catchment is entirely urban development consisting typically of brick and tile houses on 600 to 900 square metre blocks. At the commencement of sampling in March there were 3 houses within the catchment that were under construction. These houses were complete by the end of the sampling period in early August. The 3 construction sites were monitored throughout sampling to assess the impact on water quality particularly in relation to sediment. All builders employed adequate sediment fence, shake down grids and pit inlet filters and the impact upon the results was considered to be minimal.
3.2
Stormwater treatment objectives
Water Sensitive Urban Design (WSUD) assesses the impact of the stormwater runoff from an urban development and seeks to implement design measures to reduce the impact of stormwater intensification and the increase of pollutants. Stormwater intensification occurs because of the increase of impervious surfaces such as roads, buildings and driveways. The increase in pollutants comes from the increased ability for pollutants to wash of instead of being absorbed by grass and vegetation as well as an increase in human and animal activity.
Melbourne Water (Melbourne Water bio-retention) outlines three key principles involved in the WSUD approach. These are:
The protection of waterways and associated ecosystems;
24
Providing addition amenities to the local communities while reducing the cost associated cost to the developer. This can be done by using existing gullies and creeks as well as reducing the required size of storm water pipes and pits.
The specific stormwater treatment objectives for Lismore City Council are outlined in their DCP Ch22 Water Sensitive Design. The objectives of DCP Ch22 for developments larger than 2500m² relate to the reduction of reticulated water usage, stormwater quality and stormwater quantity.
The required reduction of reticulated water usage for a residential development is set at 40%. The intent of this is to increase the reuse of reticulated water and therefore decrease the need to upgrade the bulk water network. This is in line with the requirements by BASIX whereby each house that is constructed in NSW is required to be designed to achieve a 40% reduction of water usage. This is done through the use of rainwater storage tanks, low flow taps and fittings and low water use lawns and gardens. Due to the requirements of BASIX the reduction of reticulated water usage does not need to be considered with the design of a subdivision.
25
The performance criteria for SW quality by LCC are located in Chapter 22.4 Table 1 Total Suspended Solids must have a 75% reduction of mean annual loads
compared to the base line. Base line data is taken as the average pollutant generation over the 10 year period as modelled from the supplied rainfall data. Total Phosphorous must have a 65% reduction of mean annual loads compared
to the base line.
Total Nitrogen must have a 40% reduction of mean annual loads compared to the base line.
Gross Pollutants must have a 75% reduction of mean annual loads compared to the base line.
Pollutant levels and reduction effectiveness are typically measured by MUSIC in kg per hectare per year averaged over the 10 years of rainfall data. To gather this sort of data would cover a long period of time and cost a substantial amount of money. Neither of these were available for this research project. The sampling and modelling for this research project was therefore assessed at an instantaneous point and measured in mg/L. This is further discussed in Chapter 4.1.
3.3 Weather
data
The weather data that is inputted into a MUSIC model is the rainfall every 6 minutes and the evapro-transpiration data.
3.3.1 Rainfall data
MUSIC requires 6 minute time step rainfall data which is collected and supplied at numerous locations around Australia by the BOM. MUSIC 5 provides free access to pluviograph rainfall data from 1600 sites across Australia for licensed users (eWater pluviograph). The sites that are closest to Goonellabah are the Lismore Airport and the Alstonville Tropical Fruit Research station. The Lismore Airport site was used because it was closer and the BOM website provided 30 minute weather data for this location.
26
The BOM was not able to provide current 6 minute rainfall data. For the purpose of this research project it was important to get accurate rainfall data for the duration of the storm being sampled and for the preceding day. The best way to achieve this was by using the following combined data for a period from 1st of January 2013 to 11th of August 2013:
The rainfall data from the 1st of January to the 6th of April was sourced from the BOM daily rainfall records for the Lismore Airport (BOM Lismore Daily). These rainfall figures where manually divided into 6 minute rainfall values using a text editor to create a txt file acceptable to MUSIC. Actual 6 minute rainfall figures for years prior to 2010 where reviewed to achieve a similar type of rainfall pattern. Isolated rainfall events were assumed to be more intense storms while rainfall events that spanned several days were assumed to have lower intensity rain periods. Testing of the rainfall data showed that there was very little impact in relation to the intensity of the rainfall in the “warm up” period. The more important factor was the amount of rain that fell but even the impact of this was only minor on the end results.
The rainfall data from the 7th of April to the 7th of May was sourced from the BOM 30 minute rainfall records for the Lismore Airport (BOM Lismore Airport). This data was only for 4 days so regular collection of this data was required. During this period the daily rainfall figures at Waratah Way were collected. This enabled the 30 minute rainfall values to be scaled to match what was measured on site. This was done because the Lismore Airport weather station is located 7.5km from the site. While steady rainfall was similar there were cases where there was considerable difference in the rainfall of storms recorded at Waratah Way. Once the 30 minute rainfall data was scaled it was then manually divided into 5 varying amounts based on a typical hyetograph profile to achieve 6 minute rainfall data formatted for MUSIC.
27
The Lismore Airport weather station came back online on the 3rd of June and 30 minute rainfall records were collected and edited as discussed above. The collection of this rainfall data continued until the 11th of August
The combination of theses 3 sources of daily rainfall data is shown in Figure 3.2.
Graph 3.1: Daily rainfall measured onsite
Stormwater samples of the biofiltration basin inflow and outflow were taken for three main events (Refer Appendix C). These events were:
Event 1:
Date: 24.03.2013
Sampling Times: 6:00pm to 6:30pm Inflow Samples: 1, 2 and 3
Outflow Samples: 1A, 2A and 3A Maximum Intensity: 1.5 mm/6 min Storm Duration: 24 minutes Total Rainfall: 2.5 mm Event 2:
Date: 12.04.2013
Sampling Time: 9:30am to 9:48am
0 5 10 15 20 25 30 35 40 45 50
25/03/2013 25/04/2013 25/05/2013 25/06/2013 25/07/2013
Daily
Rainfall
(mm)
Date measured
28 Inflow Samples 1A and 2A
Outflow Samples 1B and 2B Maximum Intensity: 1 mm/6 min Storm Duration: 54 minutes Total Rainfall: 6.5 mm
Event 3:
Date: 13.04.2013
Sampling Time: 9:36am to 10:12am Inflow Samples 1A and 2A
Outflow Samples 2A and 2B Maximum Intensity: 1.7 mm/6 min Storm Duration: 1:40 hours Total Rainfall: 12 mm
Event 3 was sampled 1 day after sampling of event 2 was undertaken. This enabled the research to see the pollutant levels that are generated by a secondary rainfall event on a “clean” catchment. Samples J1 and J2 relate to the inflow and outflow of the minor bio-filtration basin located at Just Street. The results of this additional treatment device are discussed in Chapter 5. The raw results of these samples are attached in Appendix C. Detailed comparison of these sampling results and the MUSIC model is discussed in Chapter 4.
An additional storm was sampled at a vegetated swale in Lismore known as Gasworks Channel and the major bio-filtration basin at Just Street. This was done to compare the effectiveness of different types of treatment devices. The sampling and results of these additional types of treatment devices is discussed in Chapter 5.
Event 4:
Date: 20.07.2013
Time: 12:30pm
29 3.3.2 Evapro-transpiration data
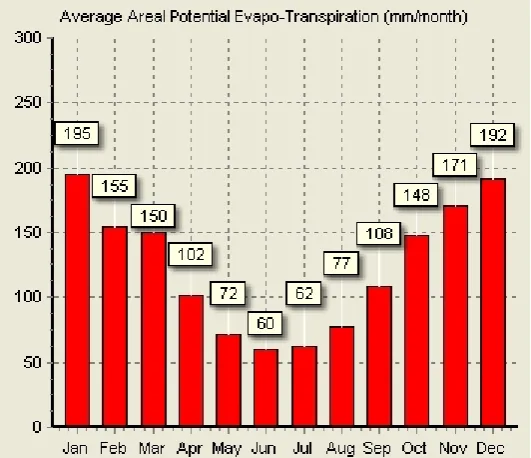
[image:41.595.115.381.250.479.2]Monthly Average Areal Potential Evapro-Transpiration figures measure the amount of water removed by a vegetated area by the process of both evaporation and transpiration which is the uptake of water by vegetation (BOM Evapro-transpiration). These figures are provided by the BOM for South Grafton and Tweed which are located 100km to the north and south of Lismore respectively. To get evapro-transpiration data suitable for the Lismore region an average of the BOM supplied data for South Grafton and Tweed was calculated. The figures used for this MUSIC model are as follows:
Figure 3.1: Evapro-transpiration rates
30
Figure 3.2: MUSIC meteorological template builder
3.4 MUSIC
modelling
setup
The setup of a MUSIC model typically involves a series of source nodes connecting to a treatment train. Normally the existing and proposed site conditions are modelled to gain an indication of the increase of stormwater pollutants relating to a proposed development. From this a treatment train can be designed and adjusted until it complies with the relevant stormwater quality targets.
31 3.4.1 Source node parameters
Source nodes are used to define the different types of land use including urban, agricultural and forest. Each source node calculates different levels of pollutant concentrations depending upon the intensity of the rainfall data file and other parameters. The parameters which are normally adjusted in a source node are the catchment area and the fraction impervious. It is possible to adjust the rainfall runoff parameters, pervious area properties, ground water properties and the base flow parameters for each pollutant but this normally requires substantial field testing.
MUSIC provides default source nodes for urban, agricultural and forest but many metropolitan councils often develop their own source nodes based on their climate, soil and runoff conditions. Lismore Council has adopted the use of the Tweed source nodes for their catchments. Table 3.2 below shows the differences in mean annual pollutant loads between the default, Brisbane and Tweed source nodes with a 3.94ha catchment using the rainfall data measured on site.
Flow (ML/yr) TSS (kg/yr) TP (kg/yr) TN (kg/yr) GP (kg/yr)
Default MUSIC Urban
Source Node 67.7 12500 26.5 190 1300
Brisbane Urban
Source Node 67.4 13000 25.6 138 1290
Tweed Urban
[image:43.595.114.477.405.513.2]Source Node 67.9 7020 17 105 1310
Table 3.2: Source Node - Mean annual load comparison
32
minimal and were ignored. No agricultural or forest source nodes are required for this model.
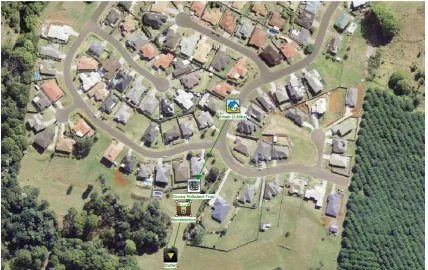
Figure 3.3: MUSIC modelling schematic of subject site 3.4.2 Gross pollutant trap parameters
A gross pollutant trap (GPT) is typically the first treatment node at the start of a treatment train. GPTs are designed to capture larger pollutants such as plastics, metals, organics and sediment. The most common gross pollutants in an urban catchment include plastic bottles, organics such as leaves and lawn clippings, cigarette butts, metal cans and domestic plastics (Gosford SC GPT). Gross pollutant traps can either be pit filter baskets or end of line treatment devices. End of line treatment devices such as ski jumps or Ecosol NetTech GPTs are often favoured because they provide a single maintenance point. For GPTs to be effective they must be emptied at regular intervals.
[image:44.595.114.543.133.403.2]33
next major rainfall event. The existing headwall had a significant build-up of sediment and grass up to 300mm deep. This sediment and grass had to be removed from the headwall and downstream channel before a temporary GPT could be constructed as discussed in section 1.4
As this device was custom made the MUSIC model GPT node was created using the default parameters for reduction of pollutant concentrations.
3.4.3 Bio retention basin parameters
A bio-retention basin is designed to reduce the flow velocities discharging downstream and to improve the quality of the water runoff (Melbourne Water WSUD). Bio-retention basins are especially effective in removing nitrogen and phosphorous using uptake through specifically chosen plants and sedges.
Bio-retention basins are divided into 7 main categories including inlet properties, storage properties, filter and media properties, infiltration properties, lining properties, vegetation properties and outlet properties.
Works as executed survey, shown in Figure 1.2, was obtained from old Aspect North data bases for the purpose of calculating areas and volumes of the basin. This survey was completed in 2002 but is still accurate for the purposes of this research. The top of the basin is typically 30m long and 28m wide with an 11m wide spillway at RL139.85. There is a 900 x 900 surcharge inlet pit located at the end of the basin which is connected to 3 bio-filtration trenches typically 10m long and 0.45m wide. The pit discharges through a low flow 150mm uPVC pipe.
The following bio-retention basin properties were used to create the bio-retention treatment node in MUSIC.
Inlet Properties
Low Flow By-Pass 0.0 m³/s
34
There is no low flow system included in the design of this basin. The grassed spillway is designed to act as the high flow bypass with an estimation made of its capacity from the survey levels.
Storage
Extended Detention Depth 0.66 m
Surface Area 587 m
The surface area and storage volume of the basin were calculated with CivilCAD. As the storage is the critical factor in pollutant reduction the depth was adjusted to give the correct storage volume of 387 m³.
Filter and Media Properties
Filter Area 11.7 m
Unlined Filter Media Perimeter 52 m
Saturated Hydraulic Conductivity 500 mm/hour
Filter Depth 0.6 m
TN Content of Filter Media 800 (mg/kg)
Orthophosphate Content of Filter Media 80 (mg/kg)
Filter area, perimeter and filter depth were calculated from the provided survey data. The saturated hydraulic conductivity was calculated manually using a clear tube and watch. The results of this sample varied from 380mm/hr to 650mm/hr at different locations with an average value being adopted. This value correlated with the MUSIC default for course sand. Default media values for TN and Orthophosphate were adopted. These values are in the middle of the typical range.
Infiltration Properties
Exfiltration rate 36 mm/hr
The exfiltration rate is adopted from the MUSIC recommended value for clayey sand.
Infiltration Properties
35 Vegetation Properties
The latest release of MUSIC allows the used to specify if the basin is vegetated with effective nutrient removal plants, vegetated with ineffective nutrient removal plants or unvegetated. The basin is currently vegetated with grass which isn't considered effective at removing TP and TN nutrients.
Outlet Properties
Overflow Weir Width 11 m
An underdrain is present.
No submerged zone with carbon is present.
3.5
Effects of individual MUSIC parameters on a model
To better understand the effect of the parameters of a bio-retention treatment node a range of parameters were adjusted manually from low to high values and the results were graphed. This procedure was not applied to the parameters of the source nodes but only the critical parameters of the bio-retention treatment node. The parameters that were assessed were the basin storage, the filter area, the hydraulic conductivity and the filter depth. Typically only one parameter was adjusted at a time to provide for consistent results from which to assess the parameters effect. The model for checking the parameters was not based on Waratah Way but was a bio-retention basin from another site which had more typical filter to catchment areas.
The bio-retention basin was 1000m² in area with a storage depth of 1m. The filter media had an area of 100m², a depth of 0.6m and a hydraulic conductivity of 100 mm/hr. The Tweed urban residential catchment node had an area of 5.86ha and was 40% impervious. 10 years of 6 minute rainfall data from Alstonville weather station was used to run the model.
3.5.1 Basin Storage Volume
36
Graph 3.2: Effect of basin storage volume on stormwater treatment.
As can be seen above, the greater the volume of a detention basin the greater the removal percentage of TSS, TN & TP. Initially the reductions are most noticeable but as the basin gets larger the increases get smaller which is to be expected. As a bio-retention basin gets larger it is able to contain and treat larger and larger events. The ultimate basin size would contain and treat all events but this would obviously come at a considerable cost and require a large area of land and is not required under WSUD practices.
3.5.2 Filter Area
The filter area depends on the amount of land available and the volumes of water to be treated. To assess the effect of the filter area on pollutant reduction percentages the area was adjusted from 10m² to 150m² in increments of 10m². The effect on the pollutant reduction percentage with an increasing filter area is shown below in Graph 3.3.
0 10 20 30 40 50 60 70 80 90 100 0
0.1 0.2 0.3 0.4 0.5 0.6 0.7 0.8 0.9 1 1.1 1.2 1.3 1.4 1.5
P o llut an t R e duction (%) Basin Depth (m)
Effect of Storage Volume
37
Graph 3.3 shows a relatively linear increase in pollutant reduction of TSS and TP as the filter area increases. However TN reductions are the highest with a small filter area which rapidly drops before levelling out and then increasing later on. This model behaviour was not expected and further investigation into this could be warranted.
Graph 3.3: Effect of filter area on stormwater treatment. 3.5.3 Hydraulic Conductivity and Particle Size
Hydraulic conductivity is the ability of soil to transmit water when submitted to a hydraulic gradient (Web EAD). The hydraulic conductivity of media is directly linked to the size of the particle.
0 10 20 30 40 50 60 70 80 90 100
0 10 20 30 40 50 60 70 80 90
100 110 120 130 140 150
P o llut an t R e duction (%) Filter Area (m²)
Effect of Filter Area
38
Soil Type Median Particle
Size (mm)
Saturated Hydraulic Conductivity
(mm/hr) (m/s)
Gravel 2 36000 1 x 10⁻²
Coarse sand 1 3600 1 x 10⁻³
Sand 0.7 360 1 x 10¹⁰
Sandy loam 0.45 180 5 x 10⁻⁵
[image:50.595.115.539.409.715.2]Sandy clay 0.01 36 1 x 10⁻⁵
Table 3.3: Hydraulic conductivity vs median particle size (MUSIC)
To assess the effect of the saturated hydraulic conductivity on pollutant reduction percentages the conductivity was adjusted from 25 mm/hr to 375 mm/hr in increments of 25mm/hr. The median particle size was adjusted as per Table 3.3 to give a representative result of the effects of filter media ranging from sandy clay to sandy loan and onto sand. The effect on the pollutants with an increasing saturated hydraulic conductivity and particle size is shown below in Graph 3.4.
Graph 3.4: Impact of hydraulic conductivity on stormwater treatment.
0 10 20 30 40 50 60 70 80 90 100
0 25 50 75
100 125 150 175 200 225 250 275 300 325 350 375
P o llut an t R e duction (%) Hydraulic Conductivity (mm/hr)
Effect of Hydraulic Conductivity
39
The effects of the conductivity and particle size parameters vary for all three pollutants. TN reduction is best achieved with a low level of hydraulic conductivity. This is most likely due to extended detention times allowing for nutrient uptake by the plants within the basin. TP reduction gradually increases up to a hydraulic conductivity rate of 250 mm/hr but starts to decline after this. TSS reduction gradually increases up to a hydraulic conductivity rate of 1100 mm/hr (not shown in this graph) but starts to decline after this. The coarser the filter particle size the larger the volume of water that can be treated for TSS. However, as demonstrated by the MUSIC model, once the hydraulic conductivity passes 1100 mm/hr (the equivalent of sand) the effectiveness of the removal of TSS is reduced.
3.5.4 Filter Depth
To assess the effect of the filter depth on pollutant reduction percentages the depth was adjusted from 0.1m to 1.5m in increments of 0.1m. The effect on the pollutants with an increasing filter depth is shown below in Graph 3.5.
Graph 3.5: Effect of filter depth on stormwater treatment.
0 10 20 30 40 50 60 70 80 90 100 0
0.1 0.2 0.3 0.4 0.5 0.6 0.7 0.8 0.9 1 1.1 1.2 1.3 1.4 1.5
P o llut an t R e duction (%) Filter Depth (m)
Effect of Filter Depth
40
Graph 3.5 shows little impact on the reduction of TSS as the filter depth increases. The impact on TP removal increases rapidly at first before slowing up and levelling out once the filter depth was above 0.6m. The impact on TN removal also increases rapidly at first before slowing up and levelling out once the filter depth was above 0.8m.
From this brief study of the four major parameters the following is suggested as a preliminary guide for the design of a bio-retention basin but ultimately each basin needs to be designed to suit each individual site and the required objectives.
The hydraulic conductivity should generally range from 150 mm/hr to 300 mm/hr. This can be reduced to aid the removal of TN but this may need to be accompanied with an increased basin size for the removal of TSS.
Ideally the minimum filter depth should be 0.6m however once the depth gets above 0.9m deep the increase in pollutant reduction is minimal.
The filter area needs to be sized to suit the catchment and target objectives. The MUSIC model shows that larger filter areas may be less effective in removing TN which should be investigated further.
The larger the basin volume the greater the removal of all three pollutants will be and the greater storage there is available for sediments.
41
CHAPTER 4 –
SAMPLING RESULTS & COMPARISONS
4.1 MUSIC
modelling
results
As mentioned, pollutant levels and reduction effectiveness are typically measured in kg per hectare per year averaged over the 10 years of rainfall data. To gather this sort of data would cover a long period of time and cost a substantial amount of money. Neither of these were available for this research project.
MUSIC software allows the user to review instantaneous pollutant levels for a 6 minute period. This is done using the "time series graph" function within MUSIC. Pollutant levels for each 6 minute period is shown in milligrams per litre (mg/L) which is equivalent to parts per million (ppm). By measuring the rainfall exactly in 6 minute blocks and noting the exact time that each sample it was hoped that there would be a correlation between the modelling results and the stormwater samples.
Individual rainfall events are detailed in section 3.3.1. The following tables refer to the rainfall event and the sample. For example, event 1-S2 refers to the first storm and the second sample taken during that storm.
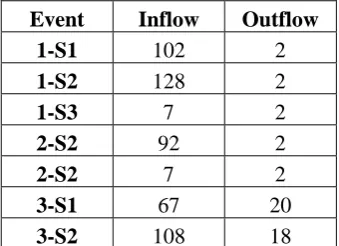
4.1.1 Total Suspended Solids modelling results
The individual inflow and outflow modelled results for the Total Suspended Solids is shown below in mg/L.
Event Inflow Outflow
1-S1 102 2
1-S2 128 2
1-S3 7 2
2-S2 92 2
2-S2 7 2
3-S1 67 20
[image:53.595.112.282.544.667.2]3-S2 108 18
42 4.1.2 Total Nitrogen modelling results
The individual inflow and outflow modelled results for the Total Nitrogen is shown below in mg/L.
Event Inflow Outflow
1-S1 102 2
1-S2 128 2
1-S3 7 2
2-S2 92 2
2-S2 7 2
3-S1 67 20
[image:54.595.112.285.157.288.2]3-S2 108 18
Table 4.2: Modelled TN results (mg/L) 4.1.3 Total Phosphorous modelling results
The individual inflow and outflow modelled results for the Total Phosphorous is shown below in mg/L.
Event Inflow Outflow
1-S1 0.23 0.46
1-S2 0.42 0.46
1-S3 0.08 0.46
2-S2 0.07 0.46
2-S2 0.03 0.46
3-S