Laboratory surface astrochemistry experiments
V. L. Frankland,a)A. Rosu-Finsen,b)J. Lasne,c)M. P. Collings, and M. R. S. McCoustra Institute of Chemical Sciences, Heriot-Watt University, Edinburgh EH14 4AS, United Kingdom
(Received 17 February 2015; accepted 17 April 2015; published online 7 May 2015)
Although several research groups have studied the formation of H2on interstellar dust grains using surface science techniques, few have explored the formation of more complex molecules. A small number of these reactions produce molecules that remain on the surface of interstellar dust grains and, over time, lead to the formation of icy mantles. The most abundant of these species within the ice is H2O and is of particular interest as the observed molecular abundance cannot be accounted for using gas-phase chemistry alone. This article provides a brief introduction to the astronomical implications and motivations behind this research and the requirement for a new dual atomic beam ultrahigh vacuum (UHV) system. Further details of the apparatus design, characterisation, and calibration of the system are provided along with preliminary data from atomic O and O2 beam dosing on bare silica substrate and subsequent temperature programmed desorption measurements. The results obtained in this ongoing research may enable more chemically accurate surface formation mechanisms to be deduced for this and other species before simulating the kinetic data under interstellar conditions. C 2015 AIP Publishing LLC.[http://dx.doi.org/10.1063/1.4919657]
I. INTRODUCTION
The vast gulfs of spaces lying between the stars, known as the interstellar medium (ISM), have been identified to contain over 200 different molecular species through a combination of radio, microwave, infrared, and ultraviolet observations.1 The only way these species could exist in the ISM is through chemistry. Knowledge of the chemical processes occurring in the ISM is of particular interest to astronomers and astrophysicists researching the gravitational collapse of gas clouds triggering star formation and astrobiologists searching for the origins of life.
By mass, the ISM consists of 99% gas, mostly hydrogen, and 1% dust.2 Evidence for dust grains includes interstellar reddening3and interstellar extinction curves4which deduced that the radius of the grains ranged from 5 to 250 nm5 with a mean radius of 100 nm. Chemical composition data were obtained from the Infrared Space Observatory (ISO)6 revealing the dust grains had an ISM environment dependence. Under interstellar dense molecular cloud environments, the astronomical observation revealed icy mantles coating the grains of which the dominant species was H2O.7In interstellar diffuse clouds, these grain surfaces were mostly bare6,8–10 suggesting that the icy mantles do not form until the diffuse cloud has collapsed in on itself resulting in a dense molecular cloud. Although H2O can be formed in the gas-phase and condense onto the dust grain surface, the observed molecular abundance cannot be matched through gas-phase chemistry
a)Current address: Department of Chemistry, University of Leeds, Leeds
LS2 9JT, United Kingdom.
b)Author to whom correspondence should be addressed. Electronic mail:
c)Current address: Laboratoire Interuniversitaire des Systèmes
Atmo-sphériques (LISA), CNRS UMR 7583, Université Paris-Est Créteil, Uni-versité Paris Diderot, Faculté des Sciences et Technologie, 61 avenue du Général de Gaulle, 94010 Créteil Cedex, France.
alone. This implies that an alternate more efficient mechanism is required.
The hypothesis that the dust grains themselves could provide a surface for adsorbed species to react on was made in 1963.11 Reactions could occur through the Langmuir-Hinshelwood, Eley-Rideal, or Harris-Kasemo surface mecha-nisms.12Over the past two decades, the dust grain chemistry model has been demonstrated to lead to the efficient formation of H2, both from bare and water ice covered substrates, by several research groups using both experimental13–16and computational17–21techniques.
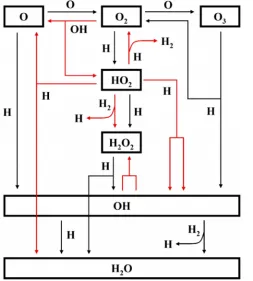
The current H2O surface formation mechanism is shown in Figure1.22 Parts of this mechanism have been explored by several research groups, for example, Refs. 23–28 and references within. The formation of O2and O3from O atoms, requisite prior knowledge as seen in Figure1, can also be explored by surface science methods. The results would be of particular interest to those studying the observed decrease of oxygen in the ISM from diffuse ([O]=3×10⁻⁴
)29 to dense molecular clouds([O2]=3−10×10−8).30,31As dense molecular clouds are formed from the gravitational collapse of diffuse clouds, this apparent reduction in the total oxygen abundance is unclear even when the observed abundances of all the gaseous O-bearing species are considered.32A possible location for the missing oxygen is in the chemistry occurring on the interstellar dust grains and their icy mantles. Purely looking at the physical process of O2 thermally desorbing from a dust grain analogue in a simulated molecular cloud environment, Collingset al.have estimated the lifetime of O2 adsorbed on a grain to be at least 23 Myr.33As the atomic O abundance becomes negligible under dense molecular cloud environments, most of the O reactions expected to have occurred on dust grains under diffuse cloud environments. These can be investigated using dust grain analogue surfaces in a new dual atomic beam UHV apparatus that we have constructed.
FIG. 1. Schematic diagram showing the surface formation mechanisms of water.
This paper describes the new apparatus, its character-isation, and calibration in Sec. II. Preliminary temperature programmed desorption (TPD) results are discussed in Sec.III
with the conclusions and implications in Sec.IV.
II. APPARATUS AND EXPERIMENTAL METHOD
A. Overview
The schematic diagrams for the new dual atomic beam system are displayed in Figure 2. The experiments are performed in the ultrahigh vacuum (UHV) scattering chamber, known as the ICE RIG, which has been described in detail elsewhere.34 Although some changes have been made, the scattering chamber remains a chamber with a base pressure of 2.0×10⁻¹⁰millibars pumped by a 6 in. diffusion pump.
The sample is an oxygen free high conductivity copper block front-coated with an amorphous silica layer deposited by electron beam evaporation using the same method as described by Throweret al.35This is mounted on the end of a closed cycle helium cooled cold finger enabling a base temper-ature typically between 15 and 20 K to be obtained. The heater system for the sample has been replaced with a cartridge heater (Heatwave Labs, Inc.) situated behind the sample. The surface and cold finger temperatures are monitored using KP-type (Au-Chromel) thermocouples connected to IJ-6 temperature controllers. The scattering chamber is equipped with a pulse counting quadrupole mass spectrometer (QMS, Hiden Analyt-ical Ltd., HAL301), residual gas analyser mass spectrometer (RGA, SRS 200), quartz crystal microgravimetry (QCM, Oxford Applied Research), and reflection-adsorption infrared spectroscopy (RAIRS, Varian 670-IR FTIR spectrometer)
FIG. 2. Schematic layout of the dual atomic beam system. (a) is when the QMS is in position 1 and (b) is for position 2.
apparatus. Gases and liquids can be background dosed into the chamber using the original differentially pumped glass gas handling lines.
Another modification to the scattering chamber is that the QMS can be mounted in one of two positions (see Figure2). With the QMS situated in position 2, molecular beam modulation spectrometry (MBMS) analysis can be performed allowing the identity and intensity of gaseous species during the beam irradiation part of an experiment to be obtained. Although most of these species would be from the beam or background contaminants, other species may be detected that were formed through surface reactions and desorbed upon formation. As a consequence, this technique would provide more detailed kinetic data of the processes occurring on the surface which would otherwise be missed using other analytical techniques. TPD analysis can be performed using the QMS in either position.
[image:2.594.44.297.60.341.2]powered plasma source (Oxford Scientific, RF OSPrey) and a fibre optic spectrometer (Ocean Optics, USB4000). Details of each of the calibration experiments are discussed in Subsections II B–II E. The beam chambers are each fitted with custom built chopper apparatus.
Overall, the addition of the two atomic beam lines and the modifications to the original UHV chamber enables a greater range of experiments and analytical techniques to be performed. This includes: atomic, radical, and molecular beam irradiations (either singular or twin); background deposition (either to form a single film or as a layered film with other species background, atomic or molecular beam dosed); and MBMS analysis. To illustrate the new capability, examples of molecular beam dosed O2 temperature desorp-tion experiments and reacdesorp-tions of O with O2 are shown in Sec.III.
B. Atomic O plasma
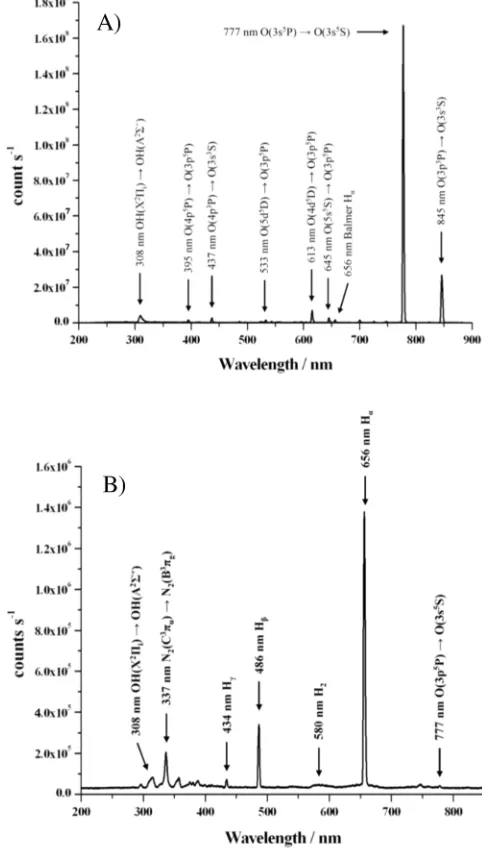
Characteristic spectra of atomic oxygen plasmas were obtained with a RF power of 150 W and a plasma source cham-ber pressure of 2.0×10⁻² millibars. The plasma spectrum obtained is displayed in Figure3with the O(3p5P)→ O(3s5S) transition at 777 nm being the dominant peak observed. Other weaker O transitions were detected at 848, 645, 616, 533, 437, and 395 nm (see Table Ifor the assigned transitions). The dissociation of O2 cannot occur directly from the O2 ground state (X3Σ−
g) as this is spin forbidden36nor from the two lowest molecular excited (a1∆gandb1Σ+g) as these have similar potential energy curves to O2(X3Σ−g).32The first dissociation region occurs with electron energies of approximately 6 eV from thec1Σ−
u,A′
3∆
u, and A3Σ+umolecular excitation states37
forming both O atoms in their3P ground state.
At electron energies of around 8 eV, excitation into the higher molecular excited states, such as O2 B3Σ−
u
, leads to the formation of an O(3P
)and an O atom in the first excited state 1D. Further increase in electron energy results in the formation of O atoms in the second lowest excited state, O(1S
). Control of the electron energies was required as the majority of the O atoms in the ISM are believed to be in their ground state. Additionally, O(1D
)reacts rapidly, unlike O(3P
)which could result in the observed species being formed in the surface science experiments that would not occur under ISM conditions. However, the amount of O(1D
) present is difficult to determine as the electric dipole transition from the singlet to the triplet state is forbidden. O(1D
)can decay through the weak magnetic dipole transitions at 630.0 and 636.4 nm38 but neither of these peaks was observed in Figure 3(a). A second complication is the long radiative lifetime of O(1D
)in the gas-phase (148 s),37which with rapid solid state collisional deactivation increases the difficulty of observing this transition. The presence of O(1D) atoms can be confirmed through the collisional deactivation emission peaks.
Radiative deactivation from O(1S
[image:3.594.306.547.63.490.2])is spin forbidden but can decay either through the electric quadrupole transition to the first excited state at 557.7 nm38 (see Table I) or to the ground state through the magnetic dipole transition at 297.2 nm.38Neither of these peaks is observed in Figure3(a),
FIG. 3. Example spectra of an atomic O (a) and H (b) plasmas using the dual atomic beam system.
but both these transitions are weak, restricting the observation of these emission peaks. To determine if O atoms in the excited states were formed in the plasma, emission peaks relating to the decay transitions of O+ and O2+ ions were considered. These occur at considerably higher electron energies which, if present, would conclude that O atoms in their excited states were being formed, rather than only the desired ground state. Two possible O+formation reaction examples are displayed in Eqs. (1) and (2). The first reaction forms the O+ in the ground state and an O(3S
) atom with electron energies around 28 eV. O(3S) decays to the ground state producing emission peaks at 130.2, 130.5, and 130.6 nm,38 which all lie outside the detection range of the spectrometer used. At even higher electron energies, the formation of O(3P
) with an O+ in the second excited state 2P occurs. The O+ ion decays first to O+(2D
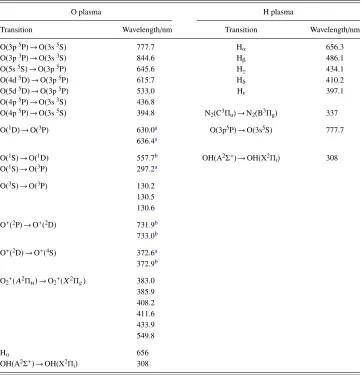
TABLE I. Optical transitions monitored in the atomic O (left) and atomic H (right) plasmas.
O plasma H plasma
Transition Wavelength/nm Transition Wavelength/nm
O(3p5P)→O(3s5S) 777.7 H
α 656.3
O(3p3P)→O(3s3S) 844.6 H
β 486.1
O(5s5S)→O(3p5P) 645.6 H
γ 434.1
O(4d5D)→O(3p5P) 615.7 H
δ 410.2
O(5d5D)→O(3p5P) 533.0 H
ε 397.1
O(4p5P)→O(3s3S) 436.8
O(4p5P)→O(3s5S) 394.8 N
2(C3Πu)→N2(B3Πg) 337
O(1D)→O(3P) 630.0a O(3p5P)→O(3s5S) 777.7
636.4a
O(1S)→O(1D) 557.7b OH(A2Σ+)→OH(X2Π
i) 308
O(1S)→O(3P) 297.2a
O(3S)→O(3P) 130.2
130.5 130.6
O+(2P)→O+(2D) 731.9b 733.0b
O+(2D)→O+(4S) 372.6a 372.9b
O2+(A2Πu)→O2+(X2Πg) 383.0 385.9 408.2 411.6 433.9 549.8
Hα 656
OH(A2Σ+)→OH(X2Π
i) 308
aDecays through magnetic dipole transition. bDecays through electric quadrupole transition.
emission peaks were observed in Figure 3(a). Excitation of the O2molecule into the excited molecular states above the ionization limit would result in the formation of O2+ ions. The first excited to ground state O2+(A2Πu)→ O2+(X2Πg) fluorescence transition occurs as a broad emission band with peaks at 383.0, 385.9, 408.2, 411.6, 433.9, and 549.8 nm.39 These peaks were also not observed in the plasma spectrum overall implying that the vast majority of the O2 molecules were dissociating into O(3P
)atoms, which is ideal for mimicking the surface formation of H2O in the ISM,
O2(X3Σ−g)+e−→ O(3S
)+O+(4S
)+2e−, (1)
O2(X3Σ−g)+e−→ O(3P
)+O+(2P
)+2e−. (2) Other emission peaks were observed in the atomic O plasma spectrum including the Balmer Hαat 656 nm and the broad
OH(A2Σ+)→ OH(X2Πi) transition (308 nm). The presence of both these peaks suggests that other chemical reactions were occurring in the plasma. Although the presence of these additional species is undesirable, the knowledge of them can be taken into account with the analysis of future O beam irradiation experiments. The dominant collision routes in a glow discharge plasma are between ion-neutral and neutral-neutral species as the gas is only weakly ionized.40 The
dominant species in the plasma chamber, when the beam was not in operation, was H2, which is known to react rapidly with O(1D
) atoms (see Eqs. (3)–(5)) but not with O(3P
).41Collisional deactivation of O (1D
)could result in the formation of OH.42 However, the plasma analysis described above suggests that this was unlikely to be the case. OH could also be formed through reactions of H with O or O2 (Eqs.(6)–(11)), but H2dissociation requires electron energies of 9 eV or higher40which would be high enough to form O
(1D ) atoms, making this mechanism also unlikely. OH formation through H2O dissociation was also considered. Unlike most other species, H2O directly ionizes or dissociates when raised into its excited molecular states43 resulting in the neutral molecule having no electronic emission. Hypothetical energy level diagrams have been used to describe the dissociation of H2O through the H2O− ion44 leading to the formation of H atoms in the Balmer range but only when the electron energy is approximately 15.2 eV or higher,45 which is inconsistent with the above analysis of the atomic O plasma in this study. A fourth OH formation mechanism is shown in Eqs.(12)–(14)
and involves O atoms in their ground state reacting with the background concentration of H2O. Relaxation of the OH radical into the ground state would result in the observed OH(A2Σ+
)→ (X2Π
OH is formed, the radical can be re-excited through electron collisions into the first excited state before decaying back to the ground state through the same transition. The amount of OH being formed can be minimized by baking the UHV apparatus for longer,
O(1D)+H2→ H2+O(3P), (3) O(1D)+H2→ H+OH, (4) O(1D
)+H2+M→ H2O+M, (5)
H2+e−→ 2H+e−, (6)
H+O→ OH, (7)
H+O2+M→ HO2+M, (8) H+HO2→ H2+O2, (9) H+HO2→ 2OH, (10) H+HO2→ H2O+O, (11) O(3P
)+H2O→ 2OH(A2Σ+), (12) OH+O→ O2+H, (13) 2OH→ H2O+O. (14) Further characterisation analysis of the atomic O plasma was performed by monitoring the plasma spectra over a range of RF powers and plasma chamber pressures. The results are dis-played in Figure4for the emission peak transitions: O(1S
)→ O(3P
) at 297 nm (panel (a)); OH(X2Π)→ OH(A2Σ+) at 308 nm (panel (b)); O(1S
)→ O(1D
)at 557 nm (panel (c)); O(1D
)→ O(3P
) at 630 (panel (d)) and 636 nm (panel (e)); Balmer Hα at 656 nm (panel (f)); the O(1D) collisional
deactivation reaction through O2(b1Σ)→ O2(X3Σ−g) at 761 nm (panel (g)); and the O(3p5P
)→ O(3s5S
)at 777 nm (panel (h)). The three transitions that were most affected by the RF power were the OH, H, and O peaks at 308, 656, and 777 nm, respectively. The O (777 nm) transition had the largest intensity with the peak maximum lying close to 2.0×10⁻² millibars in the source chamber (the same plasma source chamber pressure as used in the above analysis) indicating that this was the dominant radiative decay species in the plasma. The other two peaks also increased in intensity with increasing RF power. As these are contaminant species, these emission peaks need to be minimised with respect to the O (777 nm) peak. This is particularly critical for the H (656 nm) transition as the peak intensities increases non-linearly with respect to increasing RF power above 150 W.
The O(1S
)→ O(1D
) and both the O(1D
)→ O(3P ) tran-sitions exhibited negligible difference with RF power and plasma chamber pressure implying that these transitions were below the detection limit of the spectrometer. A similar pattern was observed for the O(1S
)→ O(3P
)and O2(b1Σ )→ O2(X3Σ−
g)transitions below 150 W. However, when the RF power was increased, a small peak was observed just above the noise level, implying that under these plasma conditions O atoms were also being formed in their excited states. As a consequence, this observation placed a maximum on the RF power setting ensuring that the vast majority of the O atoms in the beam were in their ground state. However, these findings do suggest that the apparatus can be controlled to form excited O atoms which may be of use in future comparison atomic beam irradiation experiments or for exploring the H2O surface
mechanism under different ISM conditions. For example, recent experiments exploring the affect of UV protons and electron irradiation of icy mantles revealed that O atoms were also formed in their excited states. As a consequence, more complex species were deduced to be forming in the ice films.36,46–49
C. Atomic H plasma
The atomic H plasma was analyzed using the same procedure as for the atomic O plasma (see Figure3(b)). This plasma is considerably more difficult to form. The secondary gas technique overcomes this problem by creating an atomic plasma using another gas which is easier to strike and forms high concentrations of free electrons. In this study, N2was used. The free electrons formed from the atomic plasma enabled an atomic H plasma to be formed when H2was leaked into the chamber. Once the H plasma is ignited and stable, the supply to the secondary gas was terminated.
Dissociation of the H2 molecule occurs through the repulsive triplet state with electron energies around 9 eV to form two H atoms in the ground state (see Eq. (15)). At electron energies of approximately 15.4 eV, the stable H2+ion is formed (Eq.(16)). Recombination of the H2molecule can occur only in the presence of a third-body (denoted as “M” in Eq.(17)) otherwise the transition is spin forbidden,
H2(X1Σ+g)+e−→ H2(b3Σu+)+e
−→ 2H
(12S1/2)+e−, (15) H2(X1Σ+g)+e−→ H2++2e−, (16) H+H+M→ H2+M. (17) The atomic H emission peaks of interest in this study were from the Balmer series (listed in TableI). The first three of these transitions, HαHβ, and Hγ, were observed in Figure3(b)
as well as a weak broad H2peak at 580 nm suggesting that the vast majority of the H2molecules had dissociated. This was in good agreement with the results from another similar RF powered plasma source which quoted a dissociation fraction of 90%.50The detection of emission peaks from other species in Figure 3(b) implies that other chemical reactions were occurring in this plasma too. Remnants of the secondary gas used to form the atomic H plasma were detected by the decay transition shown in Eq.(18)at 337 nm. Although the presence of N2in the atomic H beam is unlikely to affect the H2O surface formation experiments, another gas (for example argon) will have to be used for the future planned interstellar dust grain surface chemistry experiments of H and N,
N2(C3Πu)→ N2(B3Πg). (18) The observed 308 and 777 nm peaks were assigned to the OH(A2Σ+)→ OH(X2Π
i)and O(3p5P)→ O(3s5S)transitions, respectively. In the above atomic O plasma analysis, the dominant formation route of the OH radical was concluded to be through the reaction of O(3P
FIG. 4. Plots of peak intensity against plasma chamber pressure at RF power of: 80 (black); 100 (red); 120 (blue); 150 (magenta); 170 (gold); 190 (dark red); and 210 W (green).
deactivation of O(1D
)or through the reactions of O2with H. An alternative formation route of OH would be through the dissociation of H2O which could occur as the electron energies required to form an atomic H plasma are higher than those needed for an atomic O plasma. The O atoms could be formed through the dissociation of the background concentration of O2and through the reaction of OH with H. The concentration
of the OH and O species would be limited by the destruction reactions displayed in Eqs.(7),(13), and(14).
D. O2molecular beam flux
The O2 molecular beam flux, Fbeam, was determined
the sample and QCM positioned out-of-line of the beam and with the gate valve between the atomic beam and the scattering chambers and with the gate valve between the scattering chamber and the pumping system throttled to reducing the pumping speed. The molecular beam was formed by leaking O2through the RF powered plasma source (with no RF power) and the species monitored by the QMS. After a short delay, the gate valve between the atomic beam and scattering chamber was opened for approximately 20 s and then closed. This procedure was repeated five times for each plasma chamber pressure.
Logarithm plots of pressure against time were constructed and lines of best fit applied to the linear pump-down regions where the gradient is the negative value of the pumping coefficient for the gas,Cm, and the intercept is the logarithm
value of the initial pressure, P0. Fbeam for each plasma
chamber pressure was deduced using Eq.(19)whereVsyst em
is the volume of the system;kBis Boltzmann’s constant;T is
temperature of the gas; and Abeamis the cross-sectional area
of the beam,
Fbeam=Fout=
Vsyst emCmP0
kBT Abeam
. (19)
Stable atomic O plasmas in this system form at 2.0 ×10⁻²millibars, calibratingF
beamas 2.3±0.4×10¹⁴
mole-cules cm−2 s−1. By knowing the O:O
2 dissociation fraction (calculated indirectly in SubsectionII E), the atomic O beam flux was determined as 3.0±0.8×10¹⁴atoms cm−2s−1. The same procedure will be used in the near future to determine
Fbeamfor the H and H2beam.
E. O:O2dissociation fraction
The atomic O beam dissociation fraction was determined indirectly by monitoring the mass 16 and 32 signals using the RGA set off-axis from the atomic and molecular oxygen beams. A baseline of the background gases in the scattering chamber was obtained before introducing the atomic O beam by opening the gate valve separating the atomic beam and scattering chambers. Once the mass signals were stable for a few minutes, the RF power was terminated changing the atomic O beam into the O2 molecular beam until the mass signals were stable again. This procedure was repeated over a range of plasma chamber pressures. The results obtained calibrated the O:O2dissociation fraction as 32%±9% which is in good agreement with other atomic O beams formed by RF13 or microwave (MW23). However, this method of determining the O:O2dissociation fraction does not take into account the small contribution from CO or CO2formed by the reaction of O with C or from the recombination of O2on the chamber walls.
III. RESULTS AND DISCUSSION
To illustrate the capabilities of the newly added beam sources, experiments using O2and O atom beams have been carried out.
A. O2on SiO2
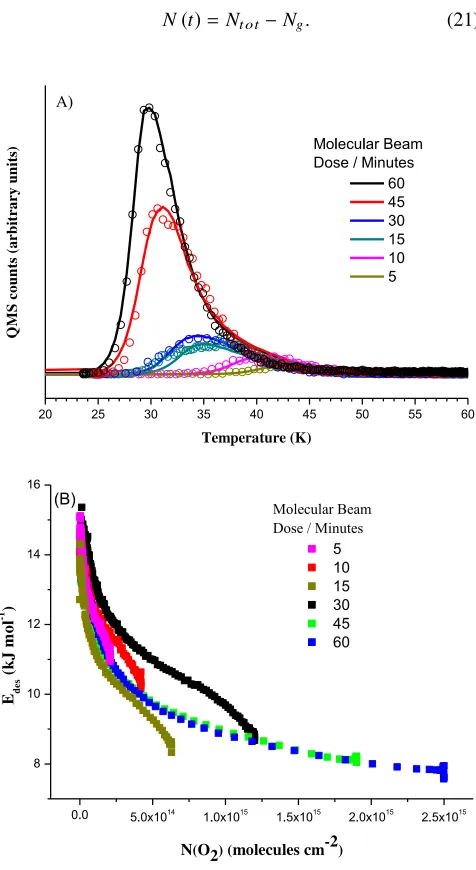
These experiments were performed by molecular beam dosing of O2onto the amorphous silica sample. TPD analysis is then carried out with a heating ramp of 0.1 K s−1 to a final temperature of 180 K while the QMS detects the desorbed species. The open symbols in Figure5(a)represent the experimental TPD data for molecular beam dosed O2on SiO2.
Nt ot for the molecular beam data is calculated using
Eq.(20),
Nt ot=Fbeamtir rα, (20)
where Fbeam is the O2 molecular beam flux, tir r is the
irradiation time in seconds, and α is the accommodation coefficient estimated from the O2molecular beam flux cali-bration experiments as 3.0×10−3.51N(t), the total gas-phase concentration, can then be found through Eq.(21), whereNg is the number of molecules in the gas-phase at a given time,
[image:7.594.311.549.285.720.2]N(t)=Nt ot−Ng. (21)
FIG. 5. Panel (a) is of the TPD traces of O2sub-monolayer desorption from
TABLE II. Ede srange for molecular beam dose times of sub-monolayer coverages O2from amorphous silica.
Beam dose/min Ede s/kJ mol−1
5 11.4–15.1
10 10.5–14.7
15 9.2–14.8
30 9.0–15.0
45 8.2–13.5
60 7.9–13.4
Direct inversion of the Polanyi-Wigner equation leads to en-ergy of desorption,Ede s(Eq.(22)). Here,kBis the Boltzmann
constant,dN/dtis the change in surface concentration,νis the pre-exponential factor andnis the order of desorption,
Ede s=−kBln(dN/dt/υN(t)n). (22)
Plots of Ede s against N(t)are constructed for each O2
sub-monolayer molecular beam dosing coverage (Figure5(b)) and a polynomial curve is fitted to obtain theEde sfunction. The
Ede srange for each O2dose is displayed in TableII.
The kinetic modelling technique used is based on the Fortran 90 program previously constructed by Thrower
et al.35 to fit benzene desorption peaks. The experimental time and surface temperature data are taken as an input and the program coding altered for each Ede s function to
calculate the desorption rate of O2 through the Polanyi-Wigner equation. The output data contain the original input data along with the calculated O2 desorption rate and value of Ede s at each simulated time point. The simulations are
displayed in Figure 5(a) (solid lines) and agree well with the experimental data (open symbols). This indicates that desorption of sub-monolayer coverages of O2 follows first order kinetics and are not affected by the porosity of the silica film. The values obtained and seen in TableIIare consistent with sub-monolayer coverages of O2 when background dosed.33
B. O on SiO2
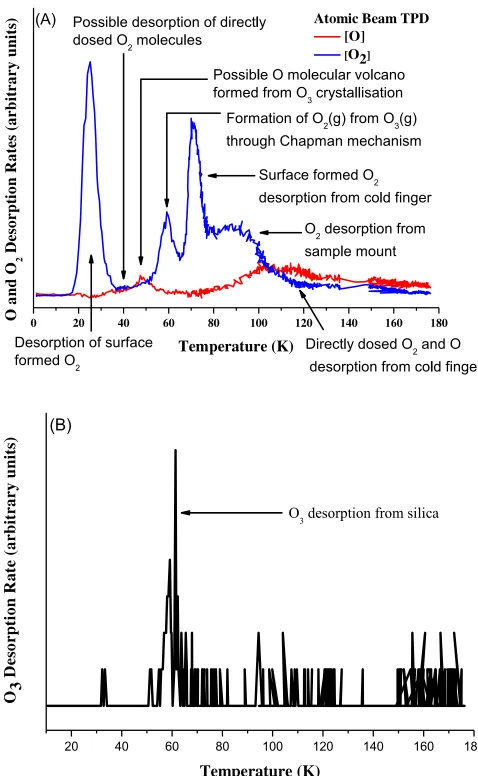
[image:8.594.43.287.82.176.2]A preliminary 30 min atomic O beam irradiation on bare silica TPD was performed. The TPD traces for O, O2, and O3 are displayed in Figure 6. The first sets of peaks to be assigned were those where the species were desorbing from other surrounding surfaces, such as the sample mount and cold finger. The lowest surface temperature O2 desorption peak (from amorphous silica) was compared with a corresponding 30 min O2molecular beam dose on bare silica TPD experiment (see Figure7) and revealed the O2desorption peak in the atomic O beam experiment had shifted to a lower temperature of approximately 12 K. The intensity of this peak suggested that the O atoms diffused across the surface at around 20 K and reacted together. The energy released in forming the O=O bond (approximately 580 kJ mol−137) resulted in these molecules desorbing upon formation. A second O2 desorption peak was just visible above the noise and could correspond to desorption of non-dissociated O2 molecules in the atomic O beam. However, further atomic O
FIG. 6. The top panel (a), shows the O atomic beam irradiation of amorphous silica and the subsequent TPD of O (red trace) atoms, O2(blue trace). The
bottom panel is of the same experiment but only measuring the mass of O3
(black trace) as it desorbs.
beam dose on bare silica TPD experiments performed over a range of irradiation times is required before this can be concluded.
[image:8.594.308.549.562.734.2]Another desorption peak to consider occurred at approx-imately 52 K and was only observed for O. The origin of this peak was unclear as all the O and O2species were expected to have desorbed from the silica surface before this temperature. One possible suggestion is that these O atoms became trapped during the formation of amorphous O3and were released as an atomic volcano when the O3molecules crystallised at around 47 K.48 This peak also implies that O
3 was formed on the surface and was observed desorbing at approximately 66 K. The O3desorption peak was accompanied by an O2desorption feature which was unexpected as the peak was too large to originate from trapped O2molecules. One possible suggestion was that a large proportion of the O3molecules reacted with O atoms trapped deep in the O3ice to form two O2molecules as shown in reaction Eq.(23),
O3+O→ 2O2. (23) In the future, further atomic O beam dose TPD experiments (combined with RAIRS analysis) performed over a range of atomic O beam irradiation times are required to explore the kinetic surface processes of O, O2, and O3in more detail. The results obtained could be used towards explaining why O3has yet to be observed in the ISM.36
IV. CONCLUSIONS AND ASTROPHYSICAL IMPLICATIONS
The extensive modifications made to the ICE RIG UHV system have resulted in a new dual atomic beam system enabling surface mechanisms to be extensively explored at both the sub-monolayer and multilayer levels on dust grain mimics. The characterisation results of the atomic O and H plasma have provided detailed analysis of the emission species occurring in the atomic O and H beams. Further beam analysis could be obtained by combining these results with mass spectrometry observations performed in-line with each of the atomic beams. This chemical analysis of the two atomic beams will enable more accurate surface mechanisms to be deduced in the future single and dual beam irradiation experiments resulting in more accurate kinetic analysis of the processes occurring in the ISM. This has already been illustrated in this paper by the observation of surface formed O2desorbing at a lower surface temperature than that of adsorbed O2molecules. Ultimately, this apparatus will advance the current understanding of chemistry for a range of species occurring on dust grains in the ISM. In the distant future, this apparatus could be altered to study the surface chemistry of other systems like H and C (fourth most abundant element in the ISM) or H and N (fifth most abundant element) by similar replacing the O plasma tube and reactor with another. Overall, this article illustrates that the new dual atomic beam UHV apparatus will contribute towards understanding the surface science occurring in astrochemistry.
ACKNOWLEDGMENTS
V.L.F., M.P.C., and M.R.S.M. acknowledge the support of the UK Engineering and Physical Sciences Research
Council (EPSRC, EP/D506158/1). A.R.F. thanks HWU for a James Watt scholarship. J.L. acknowledges funding from the European Community FP7-ITN Marie-Curie Programme (LASSIE project, Grant Agreement No. 238258). We also thank Clair Pommier and Aude Pleuvry for their assistance in the laboratory.
1Spectroscopic identification of interstellar molecules, last updated 28
November 2014.
2E. Gibbs, D. Whittet, W. Schutte, A. Boogert, J. Chiar, P. Ehrenfreund,
P. Gerakines, J. Keane, A. Tielens, E. van Dishoeck, and O. Kerkhof, Astrophys. J.536, 347 (2000).
3R. J. Trumpler,Lick Obs. Bull.14, 154 (1930). 4A. E. Whitford,Astron. J.63, 201 (1958).
5E. Herbst and H. Cuppen,Proc. Natl. Acad. Sci. U. S. A.103, 12257
(2006).
6J. M. Greenberg,Surf. Sci.500, 793 (2002).
7D. C. B. Whittet,Dust in the Galactic Environment(IOP Publishing Ltd,
Bristol, 2003).
8I. Butchart, A. D. McFadzean, D. C. B. Whittet, T. R. Geballe, and J. M.
Greenberg, Astron. Astrophys.154, L5 (1986).
9A. Li and J. M. Greenberg, Astron. Astrophys.323, 566 (1997).
10S. P. Willner, R. W. Russell, R. C. Puetter, B. T. Soifer, and P. M. Harvey,
Astrophys. J.229, L65 (1979).
11R. Gould and E. Salpeter,Astrophys. J.138, 393 (1963).
12K. Kolasinski,Surface Science: Foundations of Catalysis and Nanoscience
(Wiley, 2002).
13G. Vidali, J. Roser, G. Manico, and V. Pirronello,Adv. Space Res.33, 6
(2004).
14L. Hornekaer, A. Baurichter, V. Petrunin, A. Luntz, B. Kay, and A.
Al-Halabi,J. Chem. Phys.122, 124701 (2005).
15F. Dulieu, L. Amiaud, S. Baouche, A. Momeni, J. Fillion, and J. Lemaire,
Chem. Phys. Lett.404, 187 (2005).
16J. Perry, J. Gingell, K. Newson, J. To, J. Watanabe, and S. Price,Meas. Sci.
Technol.13, 1414 (2002).
17O. Biham and A. Lipshtat,Phys. Rev. E66, 56103 (2002).
18N. Katz, I. Furman, O. Biham, V. Pirronello, and G. Vidali,Astrophys. J. 522, 305 (1999).
19S. Cazaux and A. Tielens,Astrophys. J.604, 222 (2004).
20T. Stantcheva, V. Shematovich, and E. Herbst,Astron. Astrophys.391, 1069
(2002).
21S. Charnley,Astrophys. J.562, L99 (2001).
22H. M. Cuppen, S. Ioppolo, C. Romanzin, and H. Linnartz,Phys. Chem.
Chem. Phys.12, 12077 (2010).
23F. Dulieu, L. Amiaud, E. Congiu, J. H. Fillion, E. Matar, A. Momeni, V.
Pirronello, and J. L. Lemaire,Astron. Astrophys.512, A30 (2010).
24N. Miyauchi, H. Hidaka, T. Chigai, A. Nagoka, N. Watanabe, and A. Kouchi,
Chem. Phys. Lett.456, 27 (2008).
25S. Ioppolo, H. M. Cuppen, C. Romanzin, E. F. van Dishoeck, and H.
Linnartz,Phys. Chem. Chem. Phys.12, 12065 (2010).
26H. Chaabouni, M. Minissale, G. Manico, E. Congiu, J. A. Noble, S. Baouche,
M. Accolla, J. L. Lemaire, V. Pirronello, and F. Dulieu,J. Chem. Phys.137, 234706 (2013).
27S. Ioppolo, H. M. Cuppen, C. Romanzin, E. F. van Dishoeck, and H.
Linnartz,Astrophys. J.686, 1474 (2008).
28C. Romanzin, S. Ioppolo, H. M. Cuppen, E. F. van Dishoeck, and H.
Linnartz,J. Chem. Phys.134, 084504 (2011).
29D. M. Meyer, M. Jura, and J. A. Cardelli,Astrophys. J.493, 222 (1998). 30B. Larssonet al.,Astron. Astrophys.466, 999 (2007).
31P. F. Goldsmith, G. J. Melnick, E. A. Bergin, J. E. Howe, R. L. Snell, D.
A. Neufeld, M. Harwit, M. L. N. Ashby, B. M. Patten, S. C. Kleiner, R. Plume, J. R. Stauffer, V. Tolls, Z. Wang, Y. F. Zhang, N. R. Erickson, D. G. Koch, R. Schider, G. Winnewisser, and G. Chin,Astrophys. J.539, L123 (2000).
32D. C. B. Whittet,Astrophys. J.710, 1009 (2010).
33M. P. Collings, V. L. Frankland, J. Lasne, D. Marchione, A.
Rosu-Finsen, and M. R. S. McCoustra,Mon. Not. R. Astron. Soc.449, 1826 (2015).
34H. J. Fraser, M. P. Collings, and M. R. S. McCoustra,Rev. Sci. Instrum.35,
2161 (2002).
35J. D. Thrower, M. P. Collings, F. J. M. Rutten, and M. R. S. McCoustra,Mon.
36C. J. Bennett and R. I. Kaiser,Astrophys. J.635, 1362 (2005). 37P. C. Cosby,J. Chem. Phys.98, 9560 (1993).
38A. Corney,Nucl. Instrum. Methods110, 151 (1973).
39D. G. Kuehn and L. M. Chanin,J. Chem. Phys.76, 349 (1982).
40H. Boenig,Plasma Science and Technology(Cornell University Press,
Lon-don, 1982).
41H. Yamazaki and R. J. Cvetanovic,J. Chem. Phys.39, 1902 (1963). 42W. B. DeMore,J. Chem. Phys.47, 2777 (1967).
43B. Das and J. W. Farley,J. Chem. Phys.95, 8809 (1991). 44G. J. Schulz,J. Chem. Phys.33, 1661 (1960).
45H. D. Morgan and J. E. Mentall,J. Chem. Phys.60, 4734 (1974).
46M. J. Loeffler, B. D. Teolis, and R. A. Baragiola,Astrophys. J.639, L103
(2006).
47W. Zheng, Y. S. Kim, and R. I. Kaiser,Phys. Chem. Chem. Phys.13, 15749
(2011).
48B. Sivaraman, C. S. Jamieson, N. J. Mason, and R. I. Kaiser,Astrophys. J. 669, 1414 (2007).
49P. Ehrenfreund, R. Breukers, L. d’Hendecourt, and J. M. Greenberg, Astron.
Astrophys.260, 431 (1992).
50J. E. Roser, G. Manico, V. Pirronello, and G. Vidali,Astrophys. J.581, 276
(2002).