International Journal of Innovative Technology and Exploring Engineering (IJITEE) ISSN: 2278-3075, Volume-8 Issue-10, August 2019
Brain Tumor Detection and Identification Using
Histogram Method
MB Bramarambika, Seshashayee
Abstract: Brain tumor is a collection of unwanted cells that grow abnormally in different parts of human brain. Detection of this is done effectively by MR image scanning of human brain. Certain process can be carried out to partition the input MR images into the regions. To convert these regions into coherent segments is done by Histogram Method which can utilize peaks and valleys to analyze the regions into segment of the MR images. This process can be done by program division method to detect the tumor in the earlier stages .This work aims at it.
Index terms: Brain tumor, Histogram and Segmentation.
I. INTRODUCTION
A human brain is centre of the nervous system; it is a collection of white mass of cells. A tumor of brain is collection of uncontrolled increasing of these cells abnormally found in different part of the brain namely Glial cells, neurons, lymphatic tissues, blood vessels, pituitary glands and other part of brain which lead to the cancer. Cancer of Brain is of two types. Benign which is not cancerous not danger at all, other one is Malignant which is cancerous tumor; it grows abnormally by multiplying the cells rapidly, which leads to the death of the person if not detected. Manually it is not so easily possible to detect and identify the tumor. Programming division method by MRI is way to detect and identify the tumor. In order to give precise output a strong segmentation method is needed. In this paper we discussed the Histogram segmentation method of the MR Images. The scanned human brain MRI images are taken from the database and experimented in the MATLAB.
II MRI IMAGES OF BRAIN
This magnetic resonance imaging is a very helpful for the brain tumor detection for cancer imaging in which proton and neutron having the angular momentum known as spin, is identified. If the sub atomic particles in nucleus is even there exists no spin. Whereas there exists a spin when the sub atomic particles in the nucleus are odd, this is a base for MR imaging. MRI uses very strong magnets to polarize and excite the hydrogen nucleus which contains the single proton in human tissue to produce the signal, to be detected
.
Revised Manuscript Received on August 05, 2019
MB Bramarambika, Research Scholar in GITAM (Deemed to be University), Vishakhapatnam.
[image:1.595.312.526.147.288.2]Seshashayee, Assistant Professor in GITAM (Deemed to be University), Vishakhapatnam.
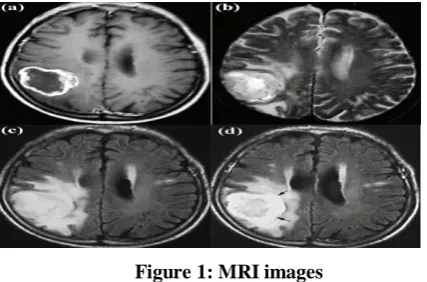
Figure 1: MRI images
The MRI scan shows a clear view and detailed information inside the human brain which is extraordinary compared to the CT scan and X-Ray.
The contrast of MRI
The different MR Images produce different types of contrast images which provide the valuable structured information to enable the diagnosis and segment the tumor with their sub regions to the medical analysts.
There are four standard MRI models used for Glioma diagnosis which include T1-weighted MRI (T1), T2-weighted MRI (T2), T1-T2-weighted MRI with gadolinium contrast enhancement (T1-Gd) and Fluid Attenuated Inversion Recovery (FLAIR) (see Fig. 1). Although MRI acquisition, can vary from device to device, around one hundred and fifty slices of 2D images are produced to represent the 3D brain volume. Furthermore, when the slices from the required standard various modalities are combined for diagnosis the data becomes very populated and complicated.
The various methods have been developed for MRI to divide the image into number of sub regions in order to identify the tumor at very early stage by pathologists. Here the digital MRI is divided according to their intensity values from 0 to 255. By these intensity values first we should locate object and then identifying the boundaries and their position easily by the MR Imaging techniques.
III PROPOSED METHODOLOGY The proposed methodology process steps as followed.
• Pre-processing • Identification • Segmentation
At the first, we take input image as brain tumor MRI images. The MRI images are pre-processed by using Wiener filter techniques. After that, the histogram based model is used for tumor region identification and segmentation.
An input MRI image might have noise and unwanted signal which occurred during the movement of the patient or while generating the images.
The image preprocessing steps involve removing the noise. In order to enhance the image for more quality the image segmentation process is carried out. There are also some morphological techniques used to detect the tumor in the medical field but they are not up to the mark in the accuracy. In preprocessing, we smoothen and sharpen the image, by reducing the speckles without destroying its main features of brain MRI for diagnosis.
We apply different filtering techniques to extract image highlights. For this we apply the Wiener filter to reduce the impact of unwanted noise.
Wiener filter is preferred since it has the highest Peak Signal to Noise Ratio. This is helpful for MR brain image quality.
Weiner filter
Weiner filter is mostly used in digital image processing. This is frequently used in de-convolution process to reduce the noise, by linear invariant technique. It studies the stationary signal, noise spectra and additive noise. These artifacts are detected and removed. Weiner filter also minimizes the Mean Square Error (MSE) between estimated and desired signals in order to reducing the blurring in the MR images.
A pixel wise Wiener filter is created by pixel wise using the. Eq. 1
(
,
)
)
,
(
22 2
b
a
u
p
b
a
v
----(1) Where
-Mean
-variancep
- is the average of all the local estimated variances)
,
(
a
b
u
andv
(
a
,
b
)
- are the pixel values in the original image.B. IDENTIFICATION AND SEGMENTATION
Brain tumor is tissue of mass in the different parts of the brain. Identification by the pathologist is somewhat complicated and tedious, which is prone to error and inaccuracy. We cannot acquire easily the status of the cancer. To avoid this disadvantage, we developed and applied the program division method (PDM) along with MR Images which gives the desired output. To segment the image into regions we use Histogram Based Segmentation method.
Histogram based brain MRI segmentation algorithm.
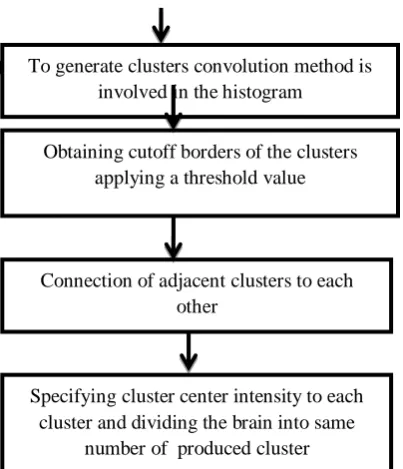
[image:2.595.306.508.50.285.2]figure: 2
Figure 2: Seven step analysis of histogram
Histogram based model scrutinizes peaks and valleys of the input image which uniquely support values of voxel, which can be utilized for image segmentation.
Histogram is shown as seven steps segments, based on the model in the figure 2.
Step 1: The image power of histogram depends on the image intensity. The image values are represented the matrix form from 0 to N1 of the image I. Given H[u] denotes the normalized histogram of I.
1
,....,
1
,
0
,
pixels
of
number
total
u
intensity
with
pixels
of
number
]
[
u
u
N
H
--- (2)
Step 2: For smoothen the histogram H[u] we use local weighted techniques using eq 3
L u H w u
H
L i
i
i i
i
] [ * ]
[
---(3)
i Li
w i
i
u
A
w
||
||
2---(4)
Where
H[u]=Histogram distribution value of ith bin Wi=weight corresponding to the ith bin Ai=average of the window
ui= pixel intensity for the ith element
=local average value of Histogram Step 3:
The local maximum of smoothed histogram is calculated by: Smoothing the histogram
Obtaining local maximum of the histogram
To generate clusters convolution method is involved in the histogram
Obtaining cutoff borders of the clusters applying a threshold value
Connection of adjacent clusters to each other
Specifying cluster center intensity to each cluster and dividing the brain into same
number of produced cluster
International Journal of Innovative Technology and Exploring Engineering (IJITEE) ISSN: 2278-3075, Volume-8 Issue-10, August 2019
])
[
]
[
(
])
[
]
[
(
|
]
[
]
[
( 1) ( 1)maxlocal
u
H
u
iH
u
i
H
u
i
H
u
i
H
u
iH
---(5)
Step 4: The rectangular window is convoluted, the histogram values from previous step, show the
intensity
values of neighborhood which represents the
various fragments in the brain image
The convolution
H
maxlocal[
u
]
of rectangular
window is employed to connect the local maxima
that of each neighborhood.
Let R be the length of rectangle window and A be the length of
H
maxlocal[
u
]
then V[u] is vector of length A+R-1
j local in localin u H u R jH u j
R u
V[ ] [ ]* max [ ] [ ] max [ ]
---(6)
The function V[u] potentially leads many segments, the convolved window produces high no of segments.
Step 5 The threshold values are used in cut of borders to acquire the segments then the convolution of
]
[
max
u
H
local and a rectangular window,R
in,was calculated which results inV[u].The threshold value Th1 controls the cut of boundaries smaller then threshold values and removes as segments. The cut of boundaries are calculated by V[u].}
]
[
]
[
|
{
]
[
u
u
V
u
( 1)Thl
V
u
( 1)Thl
U
low i
i
I
i
--- (7)
}
]
[
]
[
|
{
]
[
u
u
V
u
( 1)Thl
V
u
( 1)Thl
U
high i
i
i
--- (8)
Step 6: The upper cut off borders of uth segment is associated with lower cut off border of (u+1)th segment. The gaps between
U
high[
u
s]
andU
high[
u
(s1)]
.Againevery pixel should be assigned of particular section. In this progression, upper cutoff border of one segment reaches to the lower cutoff border of the following one rule
.
U
upnew[
S
u]
U
lownew[
S
(i1)]
----(9)
U
up(
S
u)
(
U
low(
S
u1)
U
up(
S
u))
--- --- (10)
)
(
)
(
)
(
1
u u uS
LM
S
LM
S
LM
--- (11) Where uS
= Index of the uth segment)
(
S
uLM
= local maximum amplitude of the segmentu
S
Step 7: One special intensity value is specified for every created section. All intensity values between lower and upper cutoff borders of one segment would be represented
by one intensity value named
U
center(
S
u)
.The intensity of theS
usegment is defined as:2
)
(
)
(
)
(
u low new u up new ucenter
S
U
S
U
S
U
(12)The number of the segments which are visible in histogram data is the same as the total number of lower or upper cutoff boundaries of the function V[u].
IV. EVALUATION METRICS
Detection of brain tumor is very important task now days in the present generation. In human brain the mass of tissue spread is abnormal as result of the growth of irregular cells. There is no mechanism to identify them manually. There are several techniques that have been developed till now, but there is lack of accuracy and prone to errors. In this paper we implemented Histogram segmentation method with MRI images using MATLAB experiments for better detection and identification of brain tumor in the earlier stages. The proposed model will definitely help the researchers to go further steps to implement the classification by using the clustering algorithms. Apart from the conventional method this method produced good result in detection and identification. The system performance is analyzed by using the assessment metrics such as Sensitivity, Specificity, Accuracy, PPV, NPV, FPR, FNR and FDR which are depicted in below.
Sensitivity/ Recall
The ratio of a number of true positives to the sum of true positive and false negative is called as sensitivity.
100
)
(
.
)
(
.
)
(
.
FN
of
No
TP
of
No
TP
of
No
y
Sensitivit
--- (1)Specificity
Specificity is the ratio of a number of true negative to the sum of true negative and false positive.
100
)
(
.
)
(
.
)
(
.
FP
of
No
TN
of
No
TN
of
No
y
Specificit
--- (2)Accuracy
Accuracy is calculated by the measures of sensitivity and specificity. It is denoted as follows,
100
FN
FP
TN
TP
TN
TP
Accuracy
---(3)
Positive Predictive Value (PPV)/ Precision
The fraction of positive experiment consequences which are considered as the Positive Predictive Value:
FP
TP
TP
PPV
---(4) Negative Predictive Value (NPV)The fraction of negative experiment consequences which are considered as the Negative
FN
TN
TN
NPV
---(5) False Positive Rate (FPR)
FPR is calculated as the number of incorrect positive predictions divided by the total number of negatives. It can also be calculated as 1 – specificity.
TN
FP
FP
FPR
--- (6) False Negative Rate (FNR)
FNR is calculated as the number of incorrect negative predictions divided by the total number of negatives.
TP
FN
FN
FNR
--- (7) False Discovery Rate (FDR)
The FDR is the rate that features called significant are truly empty which is defined as.
TP
FP
FP
FDR
---(8) V PERFORMANCE EVALUATION
In this paper, an improved version for brain tumor segmentation technique of MRI image is proposed. Initially, pre-processing is done for the MRI brain images, and then the pre-processed image is segmented using novel segmentation techniques. Finally, classification algorithm is applied to the segmented image to find out the normal and abnormal portions. This workr exhibits the experimental outcomes obtained for the proposed methodology compared with the existing techniques.Some of the input database MRI images are
HGG1.jpg HGG2.jpg HGG3.jpg
[image:4.595.50.288.39.344.2]
HGG4.jpg LGG2.JPG
Figure: 3 MR Images From The Database Histogram Based MR Imagessegmentationdescription
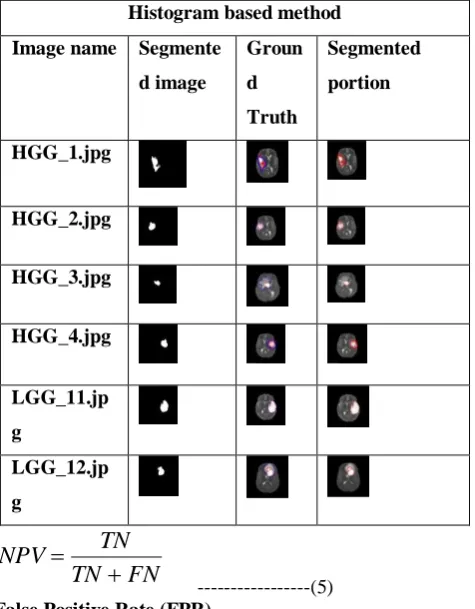
Figure 4: Histogram Segmented Images
The MRI brain images are shown in the above figure (fig 4). Here the segmented image, ground truth portion and the segmented result using proposed histogram based method are highlighted with different colors. In this technique, a histogram is computed from all of the pixels in the image, and the peaks and valleys in the histogram to locate the clusters in the image. In this histogram seeking segmentation segment-in-segmentation process carried out to produce the smaller segment until no more segments is formed. Histogram-based approaches can also be quickly adapted to apply to multiple frames, while maintaining their single pass efficiency. One advantage of the Histogram method is that it identifies the analysis of peak and valley confinement to compare the values with desired threshold setting value, which leads to division of smaller segments. The threshold values depends on pixel intensity value of every image from (0=black to 255=white). The histogram can be done in multiple fashions when multiple frames are considered. Table below is given which displays histogram MATLAB experimented values using metrics.
VI. CONCLUSION
The histogram method is very efficient segmentation technique for MR images, since it uses recursive logic to segment the images. The future application is that it helps in making clustering of images and later on we can apply the classification method.
Table 1: MATLAB experimented values Image name Segmente
d image
Groun d Truth
Segmented portion
HGG_1.jpg
HGG_2.jpg
HGG_3.jpg
HGG_4.jpg
LGG_11.jp g
LGG_12.jp g
Histogram based method
TP TN F
P
FN Reca ll
prec Acc
HGG_1.j
pg 1483 54332 5 4 775
0.65 68
0.65 68
0.98 54 HGG_2.j
pg
1010 2
38820
1 2 3650 0.73
46 0.73
46 0.99
09 HGG_3.j
pg 5488
38386 9 0
1896 0
0.22 45
0.22 45
0.95 36 HGG_4.j
pg 1376 53486 0 833 0.62
29 0.62
29 0.98
50 LGG_11.
jpg
1834 9
38896 5
1 7 3546
0.83 80
0.83 80
0.99 13 LGG_12.
jpg
1005 3
38572 7 0
1766 5
0.36 27
0.36 27
International Journal of Innovative Technology and Exploring Engineering (IJITEE) ISSN: 2278-3075, Volume-8 Issue-10, August 2019
REFERENCES
1. AlAzawee, WarqaaShaher. "Computer Aided Brain Tumor Edge Extraction Using Morphological Operations." (2015).
2. Carl Sherman and et al. ," The Dana Alliance for Brain Initiatives ." (2015).
3. Kandewal, Roan, and Ashok Kumar. "An Automated System for Brain Tumor Detection and Segmentation." International Journal of Advanced Research in Computer Science and Software Engineering 4.3 (2014): 97-100.
4. Wang, Ping, et al. "Long non-coding RNA CASC2 suppresses malignancy in human gliomas by miR-21." Cellular signalling 27.2 (2015): 275-282.
5. Langbecker, Danette, and Patsy Yates. "Primary brain tumor patients’ supportive care needs and multidisciplinary rehabilitation, community and psychosocial support services: awareness, referral and utilization." Journal of neuro-oncology 127.1 (2016): 91-102. 6. Huang, Li-Kuo, et al. "Simultaneous head and facial computed
tomography scans for assessing facial fractures in patients with traumatic brain injury." Injury (2017).
7. Ms. Sangeetha C and Ms. Shahin A," Brain Tumor segmentation using Artificial neural network." International Research Journal of Engineering and Technology (IRJET) 2.4 (2015):
8. Malathi, R., and N. Kamal. " Brain Tumor Detection and Identification Using K-Means Clustering Technique." Proceedings of the UGC Sponsored National Conference on Advanced Networking and Applications. 2015.
9. Geng, Dianzhong, et al. "Medulloblastoma with soft‑tissue and skeletal metastases in an adult: A case report." Oncology letters 10.4 (2015): 2295-2298.
10.Bhujbal, Swapnil V., Paul de Vos, and Simone P. Niclou. "Drug and cell encapsulation: alternative delivery options for the treatment of malignant brain tumors." Advanced drug delivery reviews 67 (2014): 142-153.
11.Zhang, Yudong, et al. "A multilayer perceptron based smart pathological brain detection system by fractional Fourier entropy." Journal of medical systems 40.7 (2016): 173.
12.Zhang, Yu-Dong, et al. "Pathological brain detection in MRI scanning by wavelet packet Tsallis entropy and fuzzy support vector machine." SpringerPlus 4.1 (2015): 716.
13.Kanade, PranitaBalaji, and P. P. Gumaste. "Brain tumor detection using MRI images." Brain 3.2 (2015).
14.Simran Arora and Gurjit Singh, "A Study of Brain Tumor Detection Techniques." International Journal of Advanced Research in Computer Science and Software Engineering 5.5 (2015).