Abstract -In recent years, traffic accidents have become the major cause to injuries, deaths and property damages. One of the main reasons to such accidents is due to high speed of vehicles. In order to maintain proper speed limit and thus provide significant contribution to improve safety, we propose Speed Limit sign detection and recognition method which is one of the features of Advanced Driver Assistance System (ADAS). In this paper we propose two approaches, i.e., histogram oriented gradient feature with SVM classifier namely HOG-SVM and CNN based approach. In these approaches we first pre-process the image using red color enhancement method and then we detect the Region of Interest using Maximally Stable Extremal Regions (MSER). Later, we classify the image by using different classifiers. In the HOG-SVM method, we are using HOG for feature extraction and Support Vector Machine (SVM) classifier for classification. In the CNN approach, we are using Convolutional Neural Networks (CNN) both for feature extraction and classification. Performance analysis of SVM classifier and CNN classifier are first evaluated on simple German Traffic Sign Recognition Benchmark (GTSRB) dataset using 5 fold classification, we got accuracy 100% for SVM classifier and 98.5% for CNN classifier. Also Further evaluated on German Traffic Sign Detection and Recognition Benchmark datasets and the experimental results show detection accuracy upto 93.6% for SVM classifier and 85.8% for CNN classifier.
Keywords: Speed-limit sign, MSER, SVM, Histogram of Oriented Gradients, Convolutional Neural Network.
I.INTRODUCTION
Traffic Sign Recognition (TSR) plays an important role in Advanced Driver Assistance Systems. The need of Speed-Limit Sign recognition system is, present day GPS helps in finding out Turn Traffic signs, but not able to alert the drive of doped speed limits and slow speed zones. In order to maintain proper speed limit and thus provide significant contribution to improve safety, we propose Speed Limit sign detection and recognition method which is one of the important features of Advanced Driver Assistance System (ADAS). Traffic signs are of primarily three types Mandatory signs, Cautionary signs and Informatory signs. Our work concentrate on Speed limit signs, which is a type of mandatory signs. In this paper we presented Speed-Limit Sign Recognition system which is important part of the ADAS system, since it provides the alerts for the driver about speed limit to improve the traffic flow efficiency and safety of the driver. Mostly, the TSR consists of two stages,
Revised Version Manuscript Received on July 18, 2019.
Anusha Akula, G Narayanamma Institute of Technology and Science, Shaikpet, Hyderabad,Telangana, India. (Email: [email protected]) Dr. Renuka Devi S.M, G Narayanamma Institute of Technology and Science, Shaikpet, Hyderabad, Telangana, India (Email: [email protected])
detection and classification [1] [2] [3]. In detection stage, Region of Interest is detected and in classification stage, sign will be classified as particular class.
In the detection stage, Color and shape based techniques are mostly used because traffic sign consists of particular shapes and distinct colors for different signs. Color based methods such as Hue-Saturation-Value, HIS[1] and YUV [2] have been used. Yan Han and Virupakshappa [5] developed a TSR system in which the color based HSI is used for segmentation, Speed up robust feature (SURF) for feature extraction and K-NN classifier for classification. The drawbacks of these color based detection method is mainly due to changing in lighting conditions and blurriness in images. Rubel Biswas and Hasan Fleych [3] presented a system that uses shape based method i.e., Circular Hough Transform for detection, property curve [3] and SVM classifier for Classification. In this circular shaped traffic signs was used which requires more computation time.
The disadvantage of shape based method is, that this does not detect speed limit sign properly when occlusions occur. Recently CNN is used in traffic sign recognition and the advantage of CNN is, this does not require feature extraction. Yihui Wu et al. [4] proposed a method which has two stages namely color transformation and classification using CNN. In [4] simple Germany Traffic Sign Recognition Benchmark (GTSRB) dataset was used, but the system was not tested on the challenging or real time detection dataset i.e., German Traffic Sign Detection Benchmark (GTSDB) dataset.This paper presents speed limits sign detection and recognition system based on MSER, and the system consists of three mainly stages. 1) Pre-processing performed using red color enhancement method [3], 2) Detection stage uses Maximally Stable Extremal Regions (MSERs)[6] to extract Region of Interest due to its robustness to handle the different weather conditions 3)In Classification stage we use two methods, in first method HOG features are extracted from the ROI and applied to SVM classifier and this approach is termed as HOG-SVM. In second approach ROI is directly applied to CNN for classification.
The main contribution of our work is, usually Red color thresholding [6] method is used in preprocessing to detect MSER regions, but in this paper we used red color enhancement [3] in preprocessing stage, to decrease the search area for ROI extraction, this method works efficiently
Automatic Speed-Limit Sign Detection and
Recognition for Advanced Driver Assistance
Systems
and plays major role in detecting desired MSER regions. By using this method precision increased by 4% compared to results in [6] for same GTSRB and GTSDB dataset. In image processing selection of features that best fit to application is difficult to decide. To avoid this we used CNN classifier which does feature extraction and classification. In this paper we presented a CNN architecture which has less number of layers compared to [4] and also using this architecture accuracy increased by 2% compared to[4] for same GTSRB dataset
The rest of the paper is organized as follows. Section 2 describes the proposed system for speed limit detection and classification. Section 3 introduces the data sets used for evaluation of the two approaches. Section 4 provides the discussions and results and finally the paper is concluded in Section 5.
II. SYSTEM OVERVIEW
Speed-limit sign detection and recognition system has three stages: preprocessing, detection, and recognition. We implemented two approaches, namely the HOG-SVM and the CNN approach. In both methods preprocessing and detection stages are same. The preprocessing stage enhances the input image so that the speed-limit sign can be extracted easily. MSER detection [7] is used in detection stage to find Region of Interest (ROI). In first method, the recognition stage extracts HOG features from the ROI, which is the input to trained SVM for sign classification. In the second method, CNN is used in Recognition stage for both feature extraction and classification.
2.1 Speed-Limit Sign Recognition of HOG-SVM:
The process flow of Speed-Limit Sign Recognition using HOG-SVM is shown in Fig1. In Training phase, images from GTSRB dataset [15], used shown in fig 2(a) are used which is the most commonly used dataset. GTSRB dataset images are of only ROIs i.e., the traffic signs hence MSER detection is not required, HOG features are extracted for all the input images and then given to SVM classifier to generate a model. In Testing phase, challenging images from the GTSDB dataset shown in fig,2. are used for testing. These dataset images require extraction of the ROI, for each input image. This requires to first emphasizing the pixels that have dominant red channels using red color enhancement method during pre-processing, and then we detect the ROI using MSER. Finally HOG features of detected ROI are applied to the generated model.
Fig.1.Speed limit sign recognition of HOG-SVM
2.1.1 Preprocessing:
The speed-limits are designed to have bright red colors, so we can take advantage of this feature to emphasize the pixels that are dominant in red channel using (1) as specified in [3].
S=R-g (1)
Where R:Red channel component of the input image g: is the grayscale image of the input image. S: Segmented Image. Output of the preprocessing stage is shown in Fig.2 (b).The benefit of the preprocessing stage is to take out all unwanted objects in the image and keep the small number of candidates, which have similar characteristics to the speed limit sign.
2.1.2 ROI Detection using MSER:
In this stage, MSERs[7] are detected to find probable speed limit sign region. The advantage of MSER detection is that it is robust in various environmental conditions. MSER detection is performed on the grayscale image which is output of the preprocessed stage. Steps in MSER detection is as follows: First the image is binarized by number of thresholds and connected components are found in the image, where 8-connectivity is used. The area of each connected component as a function of intensity is stored producing a data structure. These connected components which retain their own shapes through different threshold values are detected as MSERs. Fig.2(c) shows the detected MSER regions of pre-processed image. Since there are some false candidates in the resulting MSERs, these are filtered using parameters like aspect ratio, eccentricity, bounding box which are resolved empirically. After eliminating the false candidates, desired speed limit sign candidate region is cropped from the input image and resized to 64x64 which is the input to recognition stage.
2.1.3. HOG feature Extraction:
(a).Input Image (b).Preprocessed
(c).Detected MSER regions (d).Detected ROI
(e).HOG features
Fig.2. Output images of each stage for HOG-SVM
2.2. Speed-Limit Sign Recognition using CNN:
Block level representation of Speed-Limit Sign Recognition using CNN is shown in Fig.3. Both preprocessing and ROI Detection stage are same as HOG-SVM method. In image processing, feature extraction is very important task and it is difficult to select the type of features that fit to the application. This tedious task of feature extraction is avoided using CNN. CNN itself does feature extraction and classification using different layers. The three basic components that define CNN are i.e., Convolution Layer, Pooling Layer and Output Layer (or) Fully Connected Layer. The architecture of CNN is shown in Fig.4. Convolutional layer and pooling Layer together acts as feature extractor,fully connected layer works as classifier.
Training phase
Testing phase
Fig.3.Speed Limit Sign Recognition of CNN
First the input RGB image is applied to the convolutional layer. The Convolutional Layer makes use of a set of learnable filters, to detect the presence of specific features or patterns present in the original image (input). The filters size of 3x3 with depth same as input image is used. This filter is convolved (slided) across the width and height of the input file, and a dot product is computed to give an activation map.
Next pooling layer is used between the convolution layers to reduce the amount of parameters and computation in the network. The most common form of pooling layer generally used is the max pooling. These layers are used continuously to extract the features of image. The convolution and pooling layers would only be able to extract features and reduce the number of parameters from the original images. The Fully connected (FC) layer and output layers are used to classify the output. FC layer do classification based on the features extracted by the previous layers.
Fig.4.Structure of CNN
2.2.1 Details of CNN:
The details of CNN is given in Table 1, indicating the size, weight, bias and parameters of each layer. The architecture consists of five convolutional layers with same kernel size of 3x3, same padding, four max pooling layers with size 2x2 of stride 2, and one fully connected layer and one softmax layer. Visualization of convolutional layer_4 and layer_5 is shown in Fig.5.
Table1: Detailed structure of CNN
Layer Name Size Weight Bias Parameters
Input Layer 64x64x3 0 0 0
Convolutional layer_1 (16)
64x64x16 432 16 448
Max pool Layer_1 32x32x16 0 0 0 Convolutional
layer_2(32)
32x32x32 4608 32 4640
Max pool Layer_2 16x16x32 0 0 0 Convolutional
Layer_3(64)
16x16x64 18432 64 18496
Max pool Layer_3 8x8x64 0 0 0 Convolutional
Layer_4(64)
8x8x64 36864 64 36928
Max pool Layer_4 4x4x64 0 0 0 Convolutional
Layer_5(64)
4x4x64 36864 64 36928
Fig.5. Visualization of conv_4 layer and conv_5 layer features
III. THE DATASET
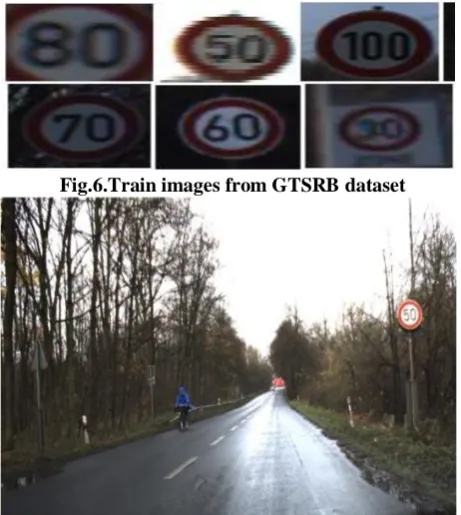
[image:4.595.60.295.52.128.2]In this paper, we used two public traffic sign datasets. The German Traffic Sign Recognition Benchmark (GTSRB)[15] is used for training, and the German Traffic Sign Detection Benchmark (GTSDB)[16] is used for testing. Images from GTSRB dataset contain ROI only, i.e., traffic signs. From this dataset we have taken six classes, with each class containing 150 images. Images from the GTSDB dataset (Fig.7.) are challenging and are similar to images as obtained in real time, also these dataset images include blurriness. Each image from the GTSDB dataset is of size 1360X800. Although both datasets have different type of mandatory, cautionary, informatory traffic signs, we have taken 6 classes of speed-limit signs images(Fig.6.) i.e. eighty ,fifty, hundred, sixty, thirty, seventy for training the classifier. GTSDB dataset is used to test the overall performance of both the HOG-SVM and CNN approach
Fig.6.Train images from GTSRB dataset
Fig.7 Challenging image from GTSDB dataset
IV. EXPERIMENTAL RESULTS:
In HOG-SVM method, during training phase, SVM is trained using 8100 dimensional extracted HOG features, of images from GTSRB dataset. In testing phase, HOG features of MSER detected stage output are applied to the trained SVM model to predict the output. In traffic sign recognition using CNN during training phase, CNN is trained using
images from GTSRB dataset. In testing phase ROIs detected from images using MSERs are directly applied to CNN classifier to predict the output. Finally confusion matrix obtained for two classifiers i.e. SVM and CNN is given in Table 2 and Table 3 respectively.
Thus using GTSRB training dataset with 5-fold, models are generated for KNN, SVM and CNN classifiers. Prediction percentage is calculated using (2) for each classifier shown in Table 1.From Table 1 it is observed that SVM and CNN classifiers give best prediction percentage compared to KNN. But advantage of the CNN classifier is , feature extraction is not needed at recognition stage.
Prediction =(Number of Correctly detected signs)/(Total number of Testing Samples) x100 (2)
Table 2: Prediction of different classifiers using simple GTSRB dataset
Classes/class ifiers
Eigh ty
Fift y
Hundr ed
Seve nty
Sixt y
Thir ty (HOG+KNN
)
89% 60% 83% 81% 81% 77%
(HOG+SVM )
100 %
100 %
100% 100% 100 %
100 % CNN 97% 97.8
%
99.2 %
99.8 %
98.6 %
[image:4.595.318.556.351.562.2]99.1 %
Table 3: Confusion Matrix for HOG -SVM using GTSRB dataset for training and GTSDB dataset for
[image:4.595.57.288.388.646.2]testing
[image:4.595.325.553.616.832.2]From Table 3 and Table 4 we concluded that accuracy is decreased, when system is tested by challenging GTSDB dataset compared to the Table 2 results. To increase the system accuracy we have to improve the detection stage by choosing better preprocessing method and improve the CNN performance by taking more training samples.
V CONCLUSION
This paper presents two methods of Traffic sign recognition i.e., HOG-SVM and CNN for automatic detection and recognition of speed-limit signs. Firstly, preprocessing is done on input images to reduce the search area, and then MSER is used for detection of speed-limit sign from input image. Different speed-limit signs are classified using SVM and CNN classifier. The proposed system gives better performance under poor lightening conditions and for blurry images because of use of MSER in detection stage. Future work includes improving the preprocessing, train the CNN with more examples to improve the performance and implementing the system in real time environment. Also the system can be extended to test other class of prime Mandatory and Cautionary signs.
REFERENCES
1. R. Malik, J. Khurshid, and S. N. Ahmad, “Road sign detection and recognition using color segmentation, shape analysis and template matching,” IEEE International Conference on Machine Learning and Cybernetics, pp. 3556-3560, 2007.
2. W. Shadeed, D. Abu-Al-Nadi, and M. Mismar, “Road traffic sign detection in color images,” Proceedings of the IEEE International Conference on Electronics, Circuits and Systems, Vol. 2, pp. 890-893, 2003.
3. R. Biswas, H. Fleyeh and M. Mostakim, "Detection and classification of speed limit traffic signs," 2014 World Congress on Computer Applications and Information Systems (WCCAIS), Hammamet, 2014, pp. 1-6. 4. YihiWu,Yulong Liu ,” Traffic sign Detection based on
Convolutional Neural Networks”, Proceedings of IEEE International Joint conference on Neural Networks,pp.747-753,2013
5. Y. Han, K. Virupakshappa and E. Oruklu, "Robust traffic sign recognition with feature extraction and k-NN classification methods," 2015 IEEE International Conference on Electro/Information Technology (EIT), Dekalb, IL, 2015, pp. 484-488.
6. Y. B. Damavandi and K. Mohammadi, "Speed limit traffic sign detection and recognition," IEEE Conference on Cybernetics and Intelligent Systems, 2004., Singapore, 2004, pp. 797-802.
7. Venkatesan, C., P. Karthigaikumar, and S. Satheeskumaran. "Mobile cloud computing for ECG telemonitoring and real-time coronary heart disease risk detection." Biomedical Signal Processing and Control 44 (2018): 138-145.
8. Navneet Dalal and Bill Triggs, ”Histograms of Oriented Gradients for Human Detection”, Proceedings of the IEEE Computer Society Conference on Computer Vision and Pattern Recognition,2005
9. Satheeskumaran, S., and M. Sabrigiriraj. "A new LMS based noise removal and DWT based R-peak detection in ECG signal for biotelemetry applications." National Academy Science Letters 37, no. 4 (2014): 341-349. 10. Jack Greenhalgh and Majid Mirmehdi ,”Real-Time
Detection and Recognition of Road Traffic Signs”, IEEE Transcations on Intelligent Transport Systems, vol. 13,
no. 4, 2012
11. Meng-yin fu, Yuan-shui huang,” A Survey of Traffic Sign Recognition”,IEEE International Conference on Wavelet Analysis and Pattern Recognition,2010
12. Fatin Zaklouta, Bogdan Stanciulescu, “Real-time traffic sign recognition in three stages”, Elsevier conference on Robotics and Autonomous Systems, 2012
13. A.dela Escalera, J.MaArmingol, M. Mata “Traffic sign recognition and analysis for intelligent vehicles”,Image Vis.Comput,, vol.21,no. 3,pp.247-258,Mar. 2003. 14. S. Ardianto, C. Chen and H. Hang, "Real-time traffic sign
recognition using color segmentation and SVM," 2017 International Conference on Systems, Signals and Image Processing (IWSSIP), Poznan, 2017, pp. 1-5.
15. J. Stallkamp, M. Schlipsing, J. Salmen, and C. Igel, “The German Traffic Sign Recognition Benchmark: A multiclass classification competition,” The International Joint Conference on Neural Networks (IJCNN), pp. 1453-1460, 2011.
16. J. Stallkamp, M. Schlipsing, J. Salmen, and C. Igel, “Man vs. computer: Benchmarking machine learning algorithms for traffic sign recognition,” Neural Networks, Vol. 32, pp. 323-332, 2012.
17. Shustanov, Alexander & Yakimov, Pavel. (2017), “CNN Design for Real-Time Traffic Sign Recognition” Procedia
Engineering”. 201. 718-725.
10.1016/j.proeng.2017.09.594.