T E C H N I C A L N O T E
Open Access
GO Trimming: Systematically reducing
redundancy in large Gene Ontology datasets
Stuart G Jantzen
†, Ben JG Sutherland
†, David R Minkley and Ben F Koop
*Abstract
Background:The increased accessibility of gene expression tools has enabled a wide variety of experiments
utilizing transcriptomic analyses. As these tools increase in prevalence, the need for improved standardization in processing and presentation of data increases, as does the need to guard against interpretation bias. Gene Ontology (GO) analysis is a powerful method of interpreting and summarizing biological functions. However, while there are many tools available to investigate GO enrichment, there remains a need for methods that directly remove redundant terms from enriched GO lists that often provide little, if any, additional information.
Findings:Here we present a simple yet novel method called GO Trimming that utilizes an algorithm designed to
reduce redundancy in lists of enriched GO categories. Depending on the needs of the user, this method can be performed with variable stringency. In the example presented here, an initial list of 90 terms was reduced to 54, eliminating 36 largely redundant terms. We also compare this method to existing methods and find that GO Trimming, while simple, performs well to eliminate redundant terms in a large dataset throughout the depth of the GO hierarchy.
Conclusions:The GO Trimming method provides an alternative to other procedures, some of which involve
removing large numbers of terms prior to enrichment analysis. This method should free up the researcher from analyzing overly large, redundant lists, and instead enable the concise presentation of manageable, informative GO lists. The implementation of this tool is freely available at: http://lucy.ceh.uvic.ca/go_trimming/cbr_go_trimming.py
Background
Transcriptomic experiments conducted using high-den-sity microarrays or RNA-seq often compare two or more states and can generate differentially expressed gene lists comprising hundreds or thousands of genes. These datasets generally require further analysis to iden-tify reliable patterns in expression profiles, such as developmental changes at certain time points, and vari-able biological processes, such as metabolic pathways. Further analyses such as Gene Ontology (GO) enrich-ment, pathway enrichenrich-ment, or clustering methods [1,2] can aid in both the discovery and summarization of important large-scale expression patterns.
GO vocabularies are structured as directed acyclic graphs with a clearly defined hierarchical structure. However, this hierarchy contains an added complexity
by allowing terms to have multiple parents, or ascen-dants [3]. An ascendant and a descendant exist in a defined parent-child relationship and constitute a path through the GO hierarchy, connected by zero or more intermediate GO terms. A gene annotated with any term is also annotated with every term that is an ascen-dant, or parent term, of the more specific term; each GO category will contain all of the genes from each of its children categories. As a gene will be annotated by a term and every ancestor of this term, terms at a variety of depths in the hierarchy will appear in an enriched GO list, given that the GO tool being used recognizes all levels of annotation for an input gene. In most cases, multiple terms from the same hierarchical path will appear in a significant GO list. These multiple categories of differing specificities are not necessarily problematic. On the contrary, they allow for several levels of inter-pretation, ranging from specific terms that encompass few genes, to higher-level categories that may describe large-scale effects on the system being studied.
* Correspondence: [email protected] †Contributed equally
Department of Biology & Centre for Biomedical Research, University of Victoria, Victoria, British Columbia, V8W 3N5, Canada
A current area of study to improve GO analysis focuses on the issue of interdependence between terms in the GO hierarchy, the problem being that many tools used to investigate GO enrichment search for enrich-ment on a term-for-term basis and do not account for correlations among terms along a path in the hierarchy [4]. Due to the detailed structure and incremental speci-ficity of the GO database, as well as the correlation among enriched terms in a path, there will often be instances in which multiple categories from the same path appear in a list and differ only slightly, or not at all in gene content. When this occurs, often the parent term provides no additional information to the researcher or reader, especially when the terms them-selves differ only in a small qualifier. An incorrect assumption can be made by the researcher that the mul-tiplicity of similar categories increases the importance of the function or process to which they relate, whereas it is more likely that one group of genes is causing the inclusion of multiple terms. Accordingly, it makes analy-sis and presentation clearer when closely related terms containing the same genes are removed. However, this term removal can introduce another issue if the subset of terms to be presented is selected mainly due to the specific interest of the researcher. Reducing the size of GO lists in this manner typically uses arbitrary criteria and can be misleading, as the selected subset may not adequately reflect the entire dataset.
Several tools and databases have been developed for the purpose of reducing the inclusion of terms of vary-ing specificity. One type of method proposed to address this issue involves reducing the size of the input data-base. The Gene Ontology Consortium has produced the GO Slim database, which is a subset comprising more general GO terms [5]. Alternatively, the GO Fat data-base, developed as part of the Annotation Tool of the DAVID suite of bioinformatics resources, is a subset comprising more specific terms [6]. Both of these meth-ods function by limiting information prior to the enrich-ment test and therefore do not fully utilize the complete GO database.
An alternative method to reduce the resulting amount of enriched terms is through the use of multiple test corrections (MTC) during GO enrichment tests. These methods not only reduce the output dataset, but can also reduce false positives. Goeman and Mansmann [7] present a method that uses the structure of the GO hierarchy to perform MTC in a top-down, bottom-up, or bi-directional ‘focus level’ manner (working in both directions from a user-defined level of the hierarchy), depending on the desired objective of the researcher.
Other methods use the full GO database for enrich-ment analysis and remove terms or modify relationships between terms during the enrichment test to address
the interdependency issue [4,8]. Alexa et al. [8] present iterative bottom-up algorithms that either remove genes from parent categories when a child in the same path is significantly enriched (elim), or reduce the weight of genes in categories that have more significant neigh-bours in its path (weight). Grossman et al. [4] present the parent-child intersection/union algorithms to reduce the inheritance problem by investigating enrichment in the context of parent-child relationships; a term is sig-nificant only if the enrichment is due to its own enriched gene set, rather than due to genes inherited from other categories.
Alterovitz et al. [9] have provided a method to investi-gate categories across a specified information level of the GO hierarchy by generating a numerical value of the
“information content”of each GO term and thus could
be used to reduce the size of the output dataset.
Clustering GO terms with similar content has also been implemented in both the GOstat and DAVID tools [10,11]. Clustering GO terms using these tools increases an understanding of commonalities between terms due to containment of similar sets of genes. However, these methods do not select or remove terms from the total list of enriched terms, and therefore the large dataset remains. Additionally, these clusters do not use the GO hierarchy or follow the parent-child path, but rather cluster based on gene content alone.
We have developed a simple, systematic method called GO Trimming for removal of redundancy from a GO category list after enrichment scores are given to terms, and is independent of any statistical package or analysis method. This method consists of an algorithm that is executed in two phases. We present an example of this process performed on a sample GO dataset, and high-light the categories that would be removed by the GO Trimming process according to different levels of strin-gency. Additionally, we compare GO Trimming to sev-eral of the aforementioned approaches performed on a second published dataset.
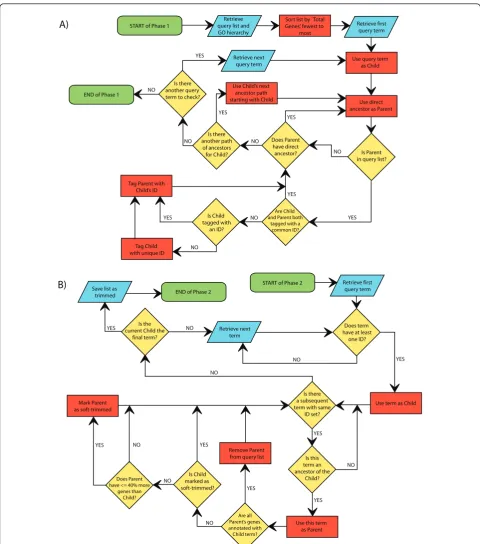
Algorithm
The GO Trimming algorithm is fully described by the flowchart in Figure 1 and is outlined here. GO Trim-ming consists of two phases, each requiring one pass through the list of significant GO terms. In the first phase, terms are connected to all other terms that share a common path by labelling with common identifiers (Figure 1A). In the second phase, terms are removed from the list based on levels of redundancy between terms found in a given path (Figure 1B).
%.$ OF 0HASE
34!24 OF 0HASE 2ETRIEVE FIRST QUERY TERM
5SE TERM AS #HILD
5SE THIS TERM AS 0ARENT
$OES TERM HAVE AT LEAST
ONE )$ 9%3
9%3 9%3
9%3
9%3
9%3 9%3
9%3
./ ./
./
./
./
./ ./
)S THERE A SUBSEQUENT TERM WITH SAME
)$ SET
)S THIS TERM AN ANCESTOR OF THE
#HILD )S THE
CURRENT #HILD THE FINAL TERM 3AVE LIST AS
TRIMMED
2ETRIEVE NEXT TERM %.$ OF 0HASE
34!24 OF 0HASE
2ETRIEVE QUERY LIST AND '/ HIERARCHY
2ETRIEVE FIRST QUERY TERM 3ORT LIST BY {4OTAL
'ENES FEWEST TO MOST
5SE QUERY TERM AS #HILD
5SE DIRECT ANCESTOR AS 0ARENT
)S 0ARENT IN QUERY LIST 9%3
9%3 9%3
./
./
./ ./
./
$OES 0ARENT HAVE DIRECT ANCESTOR )S THERE
ANOTHER PATH OF ANCESTORS FOR #HILD
5SE #HILDS NEXT ANCESTOR PATH STARTING WITH #HILD )S THERE
ANOTHER QUERY TERM TO CHECK
2ETRIEVE NEXT QUERY TERM
9%3
9%3
./
!RE #HILD AND 0ARENT BOTH
TAGGED WITH A COMMON )$ )S #HILD
TAGGED WITH AN )$
4AG #HILD WITH UNIQUE )$ 4AG 0ARENT WITH #HILDS )$
!RE ALL 0ARENTS GENES ANNOTATED WITH #HILD TERM 2EMOVE 0ARENT FROM QUERY LIST
)S #HILD MARKED AS SOFTTRIMMED $OES 0ARENT
HAVE MORE GENES THAN
#HILD -ARK 0ARENT AS SOFTTRIMMED
[image:3.595.57.538.86.631.2]"
!
addition, each term must have the following associated information: the number of differentially regulated genes annotated with the term (labelled“Diff. Genes”in Table 1) and the total number of genes annotated with the GO term (e.g. all genes on a microarray annotated with the term; labelled“Total Genes” in Table 1). Since these are the numbers used to test for enrichment, these values should be available from the same tool used to generate the list of significant terms. The hierarchical relationships of these categories are then obtained from the GO tree whether from within a software package like GeneSpring GX, or from the web platform AmiGO [12] or a downloadable database [13]. GO categories are considered query terms and are sorted in ascending order of “Total Genes”. This order of query terms is maintained throughout both phases. Care should be taken after sorting to ensure that in cases of equal totals for a pair of terms in a parent-child relationship, parents are ranked after children in the list to avoid missed identification.
For any set of genes annotated with a common GO term, it can be said that this GO category contains this set of genes. For each term in the list of GO categories, all ancestors of the term (i.e. having parent-child rela-tionships with the term) are examined, again starting with the term containing the fewest genes and moving towards broader terms. All parent-child paths are labelled with unique identifiers to mark the hierarchical connections between terms. Two terms may have a common parent, so each of these two children will be labelled with different identifiers, and the parent will be labelled with both identifiers. A term may have no par-ents present in the GO list, and therefore will have no identifier.
Once the entire list has been processed in the first phase, two types of trimming can be applied (Figure 1B). The first more strict approach removes terms that are entirely redundant. The second approach, soft trim-ming, uses more relaxed stringency, and terms that are largely redundant can be removed. A uniqueness thresh-old was designed to filter terms based on the respective gene sets contained by the parent and child categories. A value of 0% is used for the strict approach and a value of 40% is used for the soft trimming approach. If the parent category contains the same set of genes as the child category (i.e. parent contains 0% unique genes), it is deemed fully redundant and removed from the strict list (and soft list). With respect to the soft trimming threshold, if the parent term contains 40% or fewer additional genes than the child term (e.g. the child term contains ten genes; the parent term contains these ten plus an additional four), the parent term is removed from the soft trimmed list. In both of these examples, the more specific child category is retained.
If a category is involved in multiple paths in the list and so has more than one identifier, it can only be removed if a descendant shares all identifiers (i.e. has the same ID set) and indicates that the parent category is redundant. When both soft and strict trimming are performed concurrently, soft trimmed terms should not be removed from the list until the end of the process as they may still be used in the strict trimming approach. Note that some IDs may be processed multiple times through the course of the list with different untrimmed terms as the child. This allows for broader terms to be trimmed based on the representation of intermediate terms. During the second phase, it is still important to check for ancestry before trimming, since the structure of the GO hierarchy (i.e. a term can have multiple par-ents) may allow two terms to have the same ID set, yet not be in a parent-child relationship. As a final note, the 40% value is somewhat arbitrary, and can be raised or lowered, but provides a cut-off that can be used to elim-inate terms that seem to be generally unworthy of sepa-rate discussion from related terms. Once trimming is complete, all terms that were soft or strict trimmed can be fully removed from the GO list and the reduced list can be presented as fully processed.
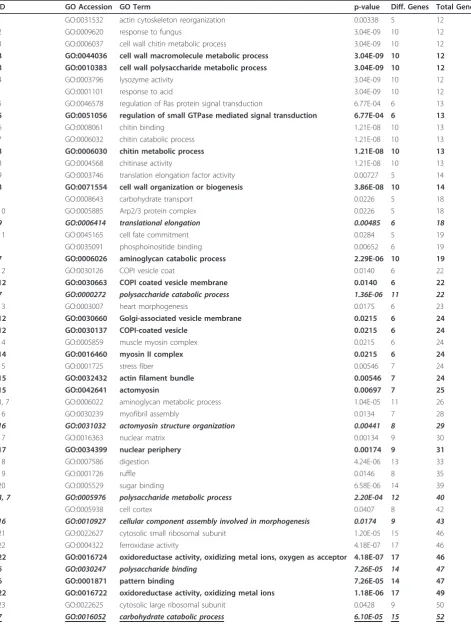
Testing
We present here an example of the use of this method in removing redundant terms from an enriched Gene Ontology term list. This sample dataset was taken from a recent experiment exploring the transcriptional effects of sea lice (Lepeophtheirus salmonis) on pink salmon (Oncorhynchus gorbuscha) [14]. Although the para-meters for the data presented here are slightly different from those for the GO lists shown in this earlier experi-ment, the biological question and the majority of the information remains the same. An initial list of 90 GO terms (Table 1) were enriched from an input list of 3388 differentially regulated entities. GeneSpring GX 11.0 was used to determine GO enrichment and the hierarchical relationships between enriched terms; the GO database used was from November 04, 2010.
Table 1 Sample Gene Ontology terms and GO Trimming results
ID GO Accession GO Term p-value Diff. Genes Total Genes
1 GO:0031532 actin cytoskeleton reorganization 0.00338 5 12
2 GO:0009620 response to fungus 3.04E-09 10 12
3 GO:0006037 cell wall chitin metabolic process 3.04E-09 10 12
3 GO:0044036 cell wall macromolecule metabolic process 3.04E-09 10 12 3 GO:0010383 cell wall polysaccharide metabolic process 3.04E-09 10 12
4 GO:0003796 lysozyme activity 3.04E-09 10 12
GO:0001101 response to acid 3.04E-09 10 12
5 GO:0046578 regulation of Ras protein signal transduction 6.77E-04 6 13
5 GO:0051056 regulation of small GTPase mediated signal transduction 6.77E-04 6 13
6 GO:0008061 chitin binding 1.21E-08 10 13
7 GO:0006032 chitin catabolic process 1.21E-08 10 13
3 GO:0006030 chitin metabolic process 1.21E-08 10 13
8 GO:0004568 chitinase activity 1.21E-08 10 13
9 GO:0003746 translation elongation factor activity 0.00727 5 14
3 GO:0071554 cell wall organization or biogenesis 3.86E-08 10 14
GO:0008643 carbohydrate transport 0.0226 5 18
10 GO:0005885 Arp2/3 protein complex 0.0226 5 18
9 GO:0006414 translational elongation 0.00485 6 18
11 GO:0045165 cell fate commitment 0.0284 5 19
GO:0035091 phosphoinositide binding 0.00652 6 19
7 GO:0006026 aminoglycan catabolic process 2.29E-06 10 19
12 GO:0030126 COPI vesicle coat 0.0140 6 22
12 GO:0030663 COPI coated vesicle membrane 0.0140 6 22
7 GO:0000272 polysaccharide catabolic process 1.36E-06 11 22
13 GO:0003007 heart morphogenesis 0.0175 6 23
12 GO:0030660 Golgi-associated vesicle membrane 0.0215 6 24
12 GO:0030137 COPI-coated vesicle 0.0215 6 24
14 GO:0005859 muscle myosin complex 0.0215 6 24
14 GO:0016460 myosin II complex 0.0215 6 24
15 GO:0001725 stress fiber 0.00546 7 24
15 GO:0032432 actin filament bundle 0.00546 7 24
15 GO:0042641 actomyosin 0.00697 7 25
3, 7 GO:0006022 aminoglycan metabolic process 1.04E-05 11 26
16 GO:0030239 myofibril assembly 0.0134 7 28
16 GO:0031032 actomyosin structure organization 0.00441 8 29
17 GO:0016363 nuclear matrix 0.00134 9 30
17 GO:0034399 nuclear periphery 0.00174 9 31
18 GO:0007586 digestion 4.24E-06 13 33
19 GO:0001726 ruffle 0.0146 8 35
20 GO:0005529 sugar binding 6.58E-06 14 39
3, 7 GO:0005976 polysaccharide metabolic process 2.20E-04 12 40
GO:0005938 cell cortex 0.0407 8 42
16 GO:0010927 cellular component assembly involved in morphogenesis 0.0174 9 43
21 GO:0022627 cytosolic small ribosomal subunit 1.20E-05 15 46
22 GO:0004322 ferroxidase activity 4.18E-07 17 46
22 GO:0016724 oxidoreductase activity, oxidizing metal ions, oxygen as acceptor 4.18E-07 17 46
6 GO:0030247 polysaccharide binding 7.26E-05 14 47
6 GO:0001871 pattern binding 7.26E-05 14 47
22 GO:0016722 oxidoreductase activity, oxidizing metal ions 1.18E-06 17 49
23 GO:0022625 cytosolic large ribosomal subunit 0.0428 9 50
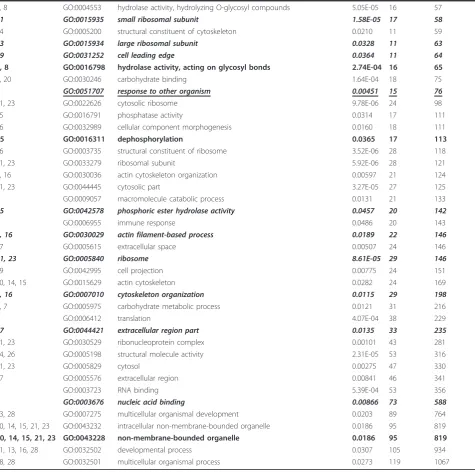
Through the GO Trimming process with 0%, 40%, and 50% uniqueness thresholds, the list was substantially reduced (Table 1), with 19 of 90 terms identified as com-pletely redundant (0% threshold; bolded text). With the use of a 40% soft trimming threshold, another 15 terms were found to be largely redundant (bolded and italicized text). To show the relative flexibility of the threshold value, we also performed the procedure with a threshold
of 50% (bolded, italicized and underlined text). With this reduced stringency, only two additional terms were removed from the list when compared with the list after the use of the 40% threshold. Note that several of the most specific and the most general terms are retained, and many of intermediate specificity are discarded.
[image:6.595.61.537.102.574.2]Looking at the list trimmed using the conservative approach (0% threshold), 19 of 90 terms were shown to
Table 1 Sample Gene Ontology terms and GO Trimming results(Continued)
4, 8 GO:0004553 hydrolase activity, hydrolyzing O-glycosyl compounds 5.05E-05 16 57
21 GO:0015935 small ribosomal subunit 1.58E-05 17 58
24 GO:0005200 structural constituent of cytoskeleton 0.0210 11 59
23 GO:0015934 large ribosomal subunit 0.0328 11 63
19 GO:0031252 cell leading edge 0.0364 11 64
4, 8 GO:0016798 hydrolase activity, acting on glycosyl bonds 2.74E-04 16 65
6, 20 GO:0030246 carbohydrate binding 1.64E-04 18 75
2 GO:0051707 response to other organism 0.00451 15 76
21, 23 GO:0022626 cytosolic ribosome 9.78E-06 24 98
25 GO:0016791 phosphatase activity 0.0314 17 111
16 GO:0032989 cellular component morphogenesis 0.0160 18 111
25 GO:0016311 dephosphorylation 0.0365 17 113
26 GO:0003735 structural constituent of ribosome 3.52E-06 28 118
21, 23 GO:0033279 ribosomal subunit 5.92E-06 28 121
1, 16 GO:0030036 actin cytoskeleton organization 0.00597 21 124
21, 23 GO:0044445 cytosolic part 3.27E-05 27 125
7 GO:0009057 macromolecule catabolic process 0.0131 21 133
25 GO:0042578 phosphoric ester hydrolase activity 0.0457 20 142
GO:0006955 immune response 0.0486 20 143
1, 16 GO:0030029 actin filament-based process 0.0189 22 146
27 GO:0005615 extracellular space 0.00507 24 146
21, 23 GO:0005840 ribosome 8.61E-05 29 146
19 GO:0042995 cell projection 0.00775 24 151
10, 14, 15 GO:0015629 actin cytoskeleton 0.0282 24 169
1, 16 GO:0007010 cytoskeleton organization 0.0115 29 198
3, 7 GO:0005975 carbohydrate metabolic process 0.0121 31 216
9 GO:0006412 translation 4.07E-04 38 229
27 GO:0044421 extracellular region part 0.0135 33 235
21, 23 GO:0030529 ribonucleoprotein complex 0.00101 43 281
24, 26 GO:0005198 structural molecule activity 2.31E-05 53 316
21, 23 GO:0005829 cytosol 0.00275 47 330
27 GO:0005576 extracellular region 0.00841 46 341
9 GO:0003723 RNA binding 5.39E-04 53 356
9 GO:0003676 nucleic acid binding 0.00866 73 588
13, 28 GO:0007275 multicellular organismal development 0.0203 89 764
10, 14, 15, 21, 23 GO:0043232 intracellular non-membrane-bounded organelle 0.0186 95 819
10, 14, 15, 21, 23 GO:0043228 non-membrane-bounded organelle 0.0186 95 819
11, 13, 16, 28 GO:0032502 developmental process 0.0307 105 934
18, 28 GO:0032501 multicellular organismal process 0.0273 119 1067
be redundant. For example, “oxidoreductase activity, oxidizing metal ions” and“oxidoreductase activity, oxi-dizing metal ions, oxygen as acceptor”are removed and the term“ferroxidase activity”is retained.
With slightly less stringency, we can remove a number of terms that offer little additional information to the analysis. For example,“polysaccharide catabolic process” adds only one gene to the set of those annotated with the term“chitin catabolic process”.
Highly similar terms that remain in the list are often a result of being from different GO domains, such as Bio-logical Process and Molecular Function, the top-level categories of “chitin catabolic process” and “chitinase activity”, respectively. Also “sister” terms that appear quite similar but are not in a parent-child relationship (e.g.“cell wall chitin metabolic process”and“chitin cata-bolic process”) cannot be eliminated because they are from different hierarchical paths, and therefore may refer to distinct processes or functions.
In addition to this sample dataset, we performed a comparison of GO Trimming with other methods that attempt to ease interpretation or take into account the interdependencies in the hierarchy during enrichment testing. For this comparison, zebrafish (Danio rerio) was deemed to be a suitable organism of study because each of the methods we wished to compare provided the abil-ity to use a ZFIN identifier [15] in annotating genes with GO terms. Accordingly, we found a microarray
experiment studying hypoxia in D. rerio [16] that
resulted in a large number of differentially expressed genes using a well annotated array [17]. Of 1520 signifi-cantly differentially regulated entities, 1017 had official gene symbols which were used to link to ZFIN IDs in
the GO Consortium’s ZFIN annotation file (May 27,
2011) [18]. 617 genes had a corresponding ZFIN ID with GO annotation. This set of 617 ZFIN IDs was the sample dataset or the list of differentially regulated genes. In the same manner, of 42990 entities on the whole array, 24888 had a gene symbol, of which 12674 had a linked ZFIN ID associated with GO annotation. This was the population or total set of genes.
It is apparent that level of annotation and choice of sta-tistical test have a large influence on the results of
enrich-ment testing. For example, GOstat uses ac2 test and
does not permit custom annotation files [10]. Therefore, the default ZFIN annotation database was used, which appeared to have annotation for all but 17 terms in the sample list. This resulted in a large difference in signifi-cant terms when compared to the traditional term-for-term method employed in the Ontologizer (175 vs. 236 terms; p-value≤0.1) [19]. Additionally, GOstat did not include an option for a 0.05 p-value cut-off. The DAVID tool also used its own associations with ZFIN IDs, result-ing in a different list of enriched terms.
Due to the differences in statistical tests and annota-tion, we restricted the formal comparison to those tests which could be performed using the Ontologizer [19], including elim, weight, and the parent-child methods [4,8]. The traditional term-for-term method was also included, and the output of this method was used as the input list for the GO Trimming process. A p-value cut-off of 0.05 was employed, and no MTC was used, as the impact of MTC may differ between methods. In this sample dataset, no gene count threshold was used.
The significantly enriched terms (p-value ≤ 0.05)
resulting from each method are presented in Additional file 1. Any term enriched through one or more methods is listed in the table, and the enrichment is represented by a p-value. In summary, the term-for-term method resulted in the largest number of enriched terms (147), followed by elim (137), weight (86), GO Trimming (80), parent-child union (78), and parent-child intersection (46). The term-for-term output included all but 24 terms; the elim, child intersection and parent-child union methods resulted in the inclusion of some additional terms.
We used the D. reriodataset on two other methods:
GOstat clustering [10] and DAVID clustering [11] (data not shown). Instead of reducing the number of terms produced by enrichment testing, the significant terms are clustered into groups that aim to improve interpre-tation of the results.
Discussion
GO Trimming was designed with the idea of reducing redundancy while fully utilizing the size and detail of the GO database. We believe this method is versatile and can be tailored to the needs of researchers while still being systematic by nature so that it can be easily integrated into an analysis workflow.
The first sample dataset (Table 1) provides a good example of what GO Trimming does and does not do. In this example, there is no real biological information lost to the researcher through the trimming process. Nor in fact, is there any biological information added that was not already present. The p-value of individual terms is not adjusted. Neither does GO Trimming serve to intentionally eliminate false positives. In fact this pro-cess is independent of MTC, as MTC can be applied during the enrichment testing, and GO Trimming may be performed on the output list.
After trimming, the information in Table 1 becomes more focused and balanced, making interpretation easier. Redundant terms no longer overwhelm the list as in the cases of IDs 3 and 12. Terms in a unique path,
such as “immune response”, a biologically important
polysaccharide, actin, and oxidoreductase functions, it becomes easier to consider and present the entire list, and terms such as“ruffle”, which was important in the context of the experiment [14], can come to the fore-front. Additionally, it becomes more feasible to present the list in the manuscript, instead of picking out only a select few to discuss. Ultimately it is up to the researcher how to interpret and discuss results, however GO Trimming provides a way to assist in this process.
Although the GO Trimming output list is easier to manage and interpret than an untrimmed list, it is important to use a non-destructive workflow where the full list of terms is retained for potential further explora-tion of specific results. We encourage researchers to append the full GO category list to published articles as supplemental documents, but for general table and text presentation, the trimmed list should be used.
Furthermore, working with GO lists in this way can familiarize the researcher to the general patterns and functions present in the data. Adding identifiers to par-ent-child relationships in the GO lists not only assists with the trimming process, but also connects terms with related functions and properties, allowing for ease in locating reoccurring themes. For example in the sample dataset above (Table 1),“actin cytoskeleton reorganiza-tion” and“myofibril assembly” share the parent“actin cytoskeleton organization and biogenesis”.
Terms with multiple identifiers represent a synthesis of information, as they represent the union of multiple paths in the GO hierarchy. Alternatively, terms without identifiers are those that have no parents or children present in the list. This in itself provides some informa-tion about the term and the associated genes. Increased understanding of the connections between terms will allow for increased comprehension of the processes under investigation.
Understanding these connections between terms is a similar benefit to that offered by GOstat or DAVID clustering [10,11]. These clustering methods cannot be directly compared to GO Trimming, primarily due to the structure of the output. Instead of reducing terms in the output lists, terms are organized into categories that share information. One benefit of GO Trimming is the more manageable presentation. With clustering, either the researcher can present all terms, which can result in very sizeable lists, or the researcher can select a repre-sentative from each cluster to present. If a reprerepre-sentative is selected, such as the most significant term, a main function or process may be preserved, but other valu-able information could be lost.
With respect to GOstat specifically, the clustering method is highly inclusive while creating clusters. Any term containing a subset of genes annotated to another term will be clustered together. This does not take into
account the GO hierarchy, which in some cases may be beneficial, in that closely related terms under difference roots (e.g.“biological process”and“molecular function”) can be clustered together. However, this can also result in more disparate terms being grouped into a cluster, simply by containing common genes. Regarding the clustered output of DAVID, non-significant terms appear to be included, which could be removed after clustering. Also, clusters can consist entirely of terms that are essentially redundant. Overall, these clustering methods can aid in interpretation of results, however the problem of redundancy is not addressed, the GO hierarchy is not taken into account, and clusters can be too inclusive.
The comparison between GO Trimming and methods employed by the Ontologizer [19] provides insight into benefits and drawbacks of each method. There are a few trends identifiable based on specificity of enriched terms (Additional file 1). It is apparent that elim and weight methods produce more specific enriched terms and fewer general terms. This is not necessarily negative, since specific terms are arguably more interesting and informative to a researcher, although it can be informa-tive to examine higher level terms. One major benefit of Gene Ontology is the ability to identify functions and processes at different depths [21]. Furthermore, there appear to be many redundant terms enriched using the elim and weight methods through the Ontologizer (e.g.
many parents of “negative regulation of neutrophil
chemotaxis”).
The parent-child union method seems to result in a much lower level of redundancy and provides a lighter but still informative set of terms. The method behind it appears to be strong, in checking for enrichment of a term in the context of its parent(s), but it too results in
some redundancy in the list (e.g.“branching
morpho-genesis of a tube”,“morphogenesis of branching epithe-lium”, “morphogenesis of a branching structure"; Additional file 1). The parent-child intersection method seems to result in much fewer terms being enriched, and may be too stringent, resulting in information being lost. These methods are more directed towards decorre-lating terms from each other so as to minimize the effect of genes being inherited through the hierarchy and to reduce false positives [4].
Compared to these other methods, GO Trimming is highly effective at reducing redundancy at both specific and general levels. For example, regarding the parents of
“negative regulation of neutrophil chemotaxis”, GO
the issue of false positives, GO Trimming specifically targets and reduces redundancy without losing informa-tion, which may occur through more stringent methods.
Conclusion
We have a developed a novel and important method for systematically reducing redundancy in Gene Ontology datasets. The simplicity of this method allows for ease of incorporation into a typical transcriptomic workflow, while still using the full structure of the GO hierarchy. It focuses on improving interpretation and presentation, and compares well against other GO enrichment meth-ods that take into consideration interdependencies in the GO hierarchy. With the exception of the stringent parent-child intersection method, the resulting list of terms contains the least redundancy, offering a cleaner, more focused representation of the dataset. With this method, researchers are able to analyze and present terms in a way that will provide the most information about the genes and systems being studied.
Additional material
Additional file 1: Supplementary Table 1. Comparison of GO Trimming and enrichment methods onD. reriodataset. Using the Ontologizer tool, a number of methods produce statistically enriched GO terms (p-value≤0.05; no MTC) from a set of 617 differentially regulated genes. The union of GO terms enriched by one or more methods is presented, along with the p-values each method produced for enriched terms, sorted by“Total Genes”from specific terms to general terms. GO Trimming was performed on the output of the traditional term-for-term method using a 40% soft trimming threshold. P-values from the term-for-term method are presented for those term-for-terms retained by the GO Trimming method.
Acknowledgements
Thanks to S Pavey and C Sahlmann for additional testing and providing feedback on the method. Thanks to anonymous reviewers for constructive criticism of the manuscript.
Authors’contributions
SGJ and BJGS developed the algorithm and drafted the manuscript. DRM implemented the algorithm. BFK provided discussion of ideas and assisted in preparing the manuscript. All authors read and approved the final manuscript.
Competing interests
The authors declare that they have no competing interests.
Received: 9 February 2011 Accepted: 28 July 2011 Published: 28 July 2011
References
1. Ashburner M, Ball C, Blake J, Botstein D, Butler H, Cherry J, Davis A, Dolinski K, Dwight S, Eppig J, Harris M, Hill D, Issel-Tarver L, Kasarskis A, Lewis S, Matese J, Richardson J, Ringwald M, Rubin G, Sherlock G, Consortium GO:Gene Ontology: tool for the unification of biology.Nat Genet2000,25(1):25-29.
2. Kanehisa M, Goto S:KEGG: Kyoto Encyclopedia of Genes and Genomes. Nucleic Acids Res2000,28(1):27-30.
3. Ashburner M, Ball C, Blake J, Butler H, Cherry J, Corradi J, Dolinski K, Eppig J, Harris M, Hill D, Lewis S, Marshall B, Mungall C, Reiser L, Rhee S,
Richardson J, Richter J, Ringwald M, Rubin G, Sherlock G, Yoon J, Consortium GO:Creating the gene ontology resource: Design and implementation.Genome Res2001,11(8):1425-1433.
4. Grossmann S, Bauer S, Robinson PN, Vingron M:Improved detection of overrepresentation of Gene-Ontology annotations with parent-child analysis.Bioinformatics2007,23(22):3024-3031.
5. GO Slim.[http://www.geneontology.org/GO.slims.shtml].
6. Dennis G, Sherman B, Hosack D, Yang J, Gao W, Lane H, Lempicki R:DAVID: Database for annotation, visualization, and integrated discovery.Genome Biol2003,4(9):R60.
7. Goeman JJ, Mansmann U:Multiple testing on the directed acyclic graph of gene ontology.Bioinformatics2008,24(4):537-544.
8. Alexa A, Rahnenfuehrer J, Lengauer T:Improved scoring of functional groups from gene expression data by decorrelating GO graph structure. Bioinformatics2006,22(13):1600-1607.
9. Alterovitz G, Xiang M, Mohan M, Ramoni MF:GO PaD: The gene ontology partition database.Nucleic Acids Res2007,35(Sp. Iss. SI):D322-D327. 10. Beissbarth T, Speed TP:GOstat: find statistically overrepresented Gene
Ontologies within a group of genes.Bioinformatics2004,20(9):1464-1465. 11. Huang DW, Sherman BT, Tan Q, Kir J, Liu D, Bryant D, Guo Y, Stephens R,
Baseler MW, Lane HC, Lempicki RA:DAVID Bioinformatics Resources: expanded annotation database and novel algorithms to better extract biology from large gene lists.Nucleic Acids Res2007,35:W169-W175. 12. AmiGO.[http://amigo.geneontology.org/cgi-bin/amigo/go.cgi]. 13. GO Database Downloads.[http://www.geneontology.org/GO.downloads.
database.shtml].
14. Sutherland BJG, Jantzen SG, Sanderson DS, Koop BF, Jones SRM:
Differentiating size-dependent responses of juvenile pink salmon (Oncorhynchus gorbuscha) to sea lice (Lepeophtheirus salmonis) infections.Comp Biochem Physiol Part D Genomics Proteomics2011,
6(2):213-223.
15. Bradford Y, Conlin T, Dunn N, Fashena D, Frazer K, Howe DG, Knight J, Mani P, Martin R, Moxon SA, Paddock H, Pich C, Ramachandran S, Ruef BJ, Ruzicka L, Bauer Schaper H, Schaper K, Shao X, Singer A, Sprague J, Sprunger B, Van Slyke C, Westerfield M:ZFIN: enhancements and updates to the zebrafish model organism database.Nucleic Acids Res2011,
39(suppl 1):D822-D829.
16. Martinovic D, Villeneuve DL, Kahl MD, Blake LS, Brodin JD, Ankley GT:
Hypoxia alters gene expression in the gonads of zebrafish (Danio rerio). Aquat Toxicol2009,95:258-272.
17. Platform GPL6563: Agilent-015064.[http://www.ncbi.nlm.nih.gov/geo/ query/acc.cgi?acc=GPL6563].
18. GO Current Annotations.[http://www.geneontology.org/GO.downloads. annotations.shtml].
19. Bauer S, Grossmann S, Vingron M, Robinson PN:Ontologizer 2.0 - a multifunctional tool for GO term enrichment analysis and data exploration.Bioinformatics2008,24:1650-1651.
20. Toronen P, Pehkonen P, Holm L:Generation of Gene Ontology benchmark datasets with various types of positive signal.BMC Bioinformatics2009,10:319.
21. Khatri P, Draghici S:Ontological analysis of gene expression data: current tools, limitations, and open problems.Bioinformatics2005,
21(18):3587-3595.
doi:10.1186/1756-0500-4-267